ELK日志框架(2):log4net.ElasticSearch+ Kibana实现日志记录和显示
环境说明
1. windows server 2012 R2 64位
2. log4net.ElasticSearch
3. kibana-5.5.0-windows-x86.zip
架构说明
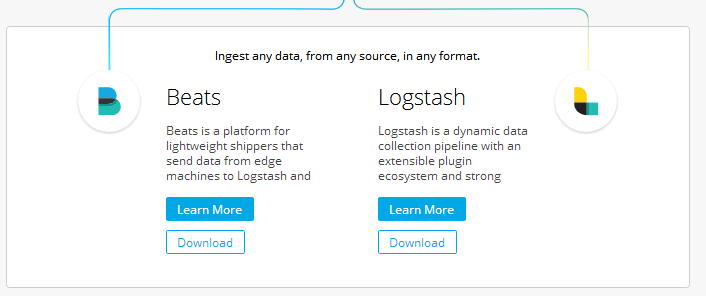
数据采集有两种方案Beats或Logstash,Logstash支持很多种数据源,有log4j但没有log4net,本想使用log4net.redis+redis+logstash的方式实现日志收集。无意间发现了 log4net.ElasticSearch可以直接写日志到ES,经过测试非常好用、方便。
log4net.ElasticSearch is a module for the log4net library to log messages to the ElasticSearch document database. ElasticSearch offers robust full-text searching an analyzation so that errors and messages can be indexed quickly and searched easily.
Features:
- Supports .NET 4.0+
- Easy installation and setup via Nuget
- Full support for the Elasticsearch _bulk API for buffered logging
安装kibana
1.下载kibana
首先下载windows版本的kibana文件,地址:https://artifacts.elastic.co/downloads/kibana/kibana-5.5.0-windows-x86.zip,解压到E:\elk\kibana目录
2.配置Kibana
打开配置文件E:\elk\kibana\config\kibana.yml,修改server.host和server.host,如下:
server.host: "192.168.5.175"

elasticsearch.url: "http://192.168.5.175:9200"
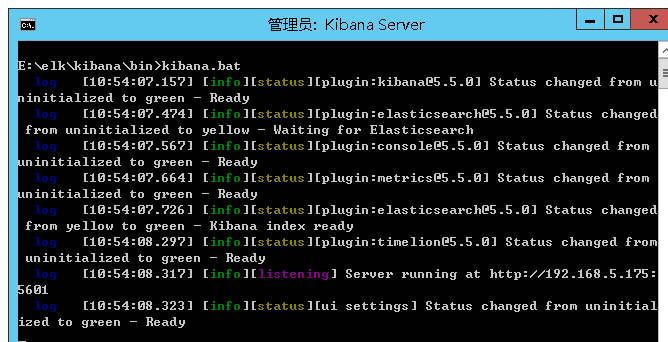
3.运行Kibana
命令行下执行E:\elk\kibana\bin\kibana.bat文件
使用log4net.ElasticSearch
1.安装log4net.ElasticSearch
log4net.ElasticSearch可以通过Nuget安装,要注意保持和正在使用的log4net版本一致
Install-Package log4net.ElasticSearch -Version 2.3.4
log4net.ES.Example是一个测试Demo,修改配置后就能使用。
2.配置log4net.config文件
 <!-- Default style appender. You can change the name but make sure you reference it corectly. Change the type if you're using .NET 4.0 -->
    <appender name="ElasticSearchAppender" type="log4net.ElasticSearch.ElasticSearchAppender, log4net.ElasticSearch">
      <layout type="log4net.Layout.PatternLayout,log4net">
        <param name="ConversionPattern" value="%d{ABSOLUTE} %-5p %c{1}:%L - %m%n" />
      </layout>

      <!-- You can also use scheme, user, password here if you need https and http authentication, see the docs -->
      <connectionString value="Server=192.168.5.175;Index=log;Port=9200;rolling=true"/>

      <!-- false means do not eject older messages when the buffer is full, try to keep them all. -->
      <lossy value="false" />

      <!-- Any buffer > 1 will use the Elasticsearch _bulk API. Tune as needed depending on how high volume your app is and how fast you want messages to show up in ES -->
      <bufferSize value="1" />

      <!-- When an event comes in that matches or is above the treshold, the buffer will flush. I don't reccommend setting to "ALL" or it will defeat the purpose of having a buffer -->
      <evaluator type="log4net.Core.LevelEvaluator">
        <threshold value="ALL"/>
      </evaluator>
    </appender>
Index=log:索引的名字
rolling=true:每天生成一个索引,比如log-2017.07.13
bufferSize :批量提交到ES,这里为了演示设置成1
    <!-- Common to all log4net configs. See log4net docs for more details  -->
    <root>
      <level value="ALL"/>
      <appender-ref ref="ElasticSearchAppender" />
    </root>
2.写入日志
运行测试程序,即可写入几条日志到ES中。
--查询索引列表
http://192.168.5.175:9200/_cat/indices
返回值:
yellow open log-2017.07.13 UBT3YG2qQpWkfJKRNw-XCQ 5 1 1 0 16.5kb 16.5kb
yellow open log-2017.07.07      pMXjGKkiRRSsrBdl5qNlNw 5 1    4 0  62.6kb  62.6kb

--查询索引内容
http://192.168.5.175:9200/log-2017.07.13/_search?q=*
返回值:
{
  "took": 1,
  "timed_out": false,
  "_shards": {
    "total": 5,
    "successful": 5,
    "failed": 0
  },
  "hits": {
    "total": 1,
    "max_score": 1,
    "hits": [
      {
        "_index": "log-2017.07.13",
        "_type": "logEvent",
        "_id": "AV05k9nbXp-PycfFP2XN",
        "_score": 1,
        "_source": {
          "timeStamp": "2017-07-13T01:32:53.9948595Z",
          "message": "System Error",
          "messageObject": {},
          "exception": {
            "Type": "System.Exception",
            "Message": "Something terrible happened.",
            "HelpLink": null,
            "Source": null,
            "HResult": -2146233088,
            "StackTrace": null,
            "Data": {},
            "InnerException": null
          },
          "loggerName": "log4net.ES.Example.Program",
          "domain": "log4net.ES.Example.exe",
          "identity": "",
          "level": "ERROR",
          "className": "log4net.ES.Example.Program",
          "fileName": "F:\\soft\\elk\\log4net.ES.Example-master\\log4net.ES.Example\\Program.cs",
          "lineNumber": "18",
          "fullInfo": "log4net.ES.Example.Program.Main(F:\\soft\\elk\\log4net.ES.Example-master\\log4net.ES.Example\\Program.cs:18)",
          "methodName": "Main",
          "fix": "LocationInfo, UserName, Identity, Partial",
          "properties": {
            "log4net:Identity": "",
            "log4net:UserName": "BJ-BL\\Administrator",
            "log4net:HostName": "BJ-BL",
            "@timestamp": "2017-07-13T01:32:53.9948595Z"
          },
          "userName": "BJ-BL\\Administrator",
          "threadName": "1",
          "hostName": "BJ-BL"
        }
      }
    ]
  }
}
日志字段非常全。。。。很赞
配置kibana
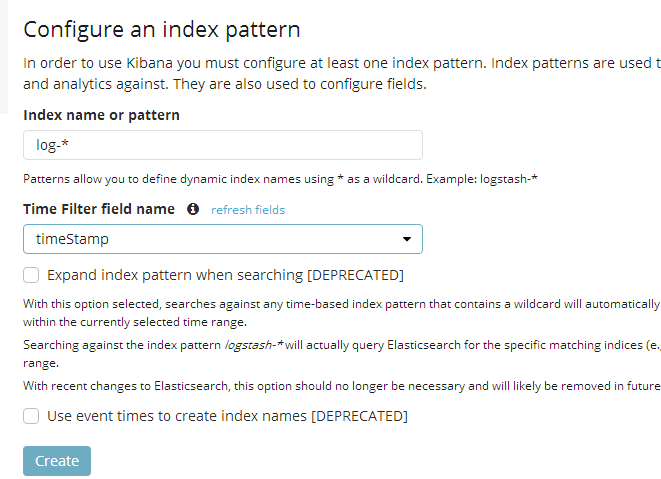
1.创建索引模式
打开kibana,http://192.168.5.175:5601。
点击Management=>Index Patterns=>Create Index Pattern,输入log-*就可以匹配上log-yyyy.mm.dd的索引了。
2.查询日志
点击Discover,选中log-*索引,就可以查询日志了。

总结
ELK日志框架已经搭建完成,这里的L变成了Log4net,ES和Kibana的熟练使用还需要时间去积累。Logstash的插件功能真是强大,也写了几个简单的配置文件实现输入输出的转化,如下:


input {
  redis {
        host => "192.168.5.175"
        port => 6379
        data_type => "list"
        key => "logstash"
        codec=> json
    }

 }
output {
  elasticsearch {
  hosts => ["192.168.5.175:9200"]
  }
  stdout { codec => rubydebug }
}
input { stdin { } }
output {
  elasticsearch { hosts => ["192.168.5.175:9200"] }
  stdout { codec => rubydebug }
}
input { stdin { } }
output {
  elasticsearch { hosts => ["192.168.5.175:9200"] }
  file{path=>[
  "stdin-log.txt"
  ]}
  stdout { codec => rubydebug }
}
input { stdin { } }
output {
  redis {
        host => "192.168.5.175"
        port => 6379
        data_type => "channel"
        key => "logstash_list_0"
    }

  stdout { codec => rubydebug }
}
用到的参考资料如下:
2.https://www.elastic.co/guide/en/logstash/current/plugins-inputs-redis.html#_description_30\
3.https://www.elastic.co/products/kibana,需要一行一行仔细看
4.ELK部署详解,CentOS7环境
6.转:ElasticSearch 索引查询使用指南——详细版

 浙公网安备 33010602011771号