map+echart+vue 大数据多次渲染卡顿问题
尤其是地图组件比较庞大,再导入大批量数据最容易造成卡顿的出现。
尤其是渲染次数多,交互多的情况。
所以每次重新加载数据一定要先销毁之前的。
不然越越卡直到卡死
父组件:
   <div class="mapchart">
           <amap :key="mapkey" ref='mymap'></amap>
      </div>
 chosethismaptab(ind){ // 每次重新交互接受新数据
      this.tabind = ind
      this.$refs.mymap.destr() // 每次重新加载 通知子组件先销毁再渲染
      this.mapkey+=1
    },
子组件
 destr(){
      this.myChart.dispose();
    },
这样就不会再卡顿了,不管怎么交互,点击多少次重新渲染都没问题了。
卡顿容易造成渲染等待越来越长:
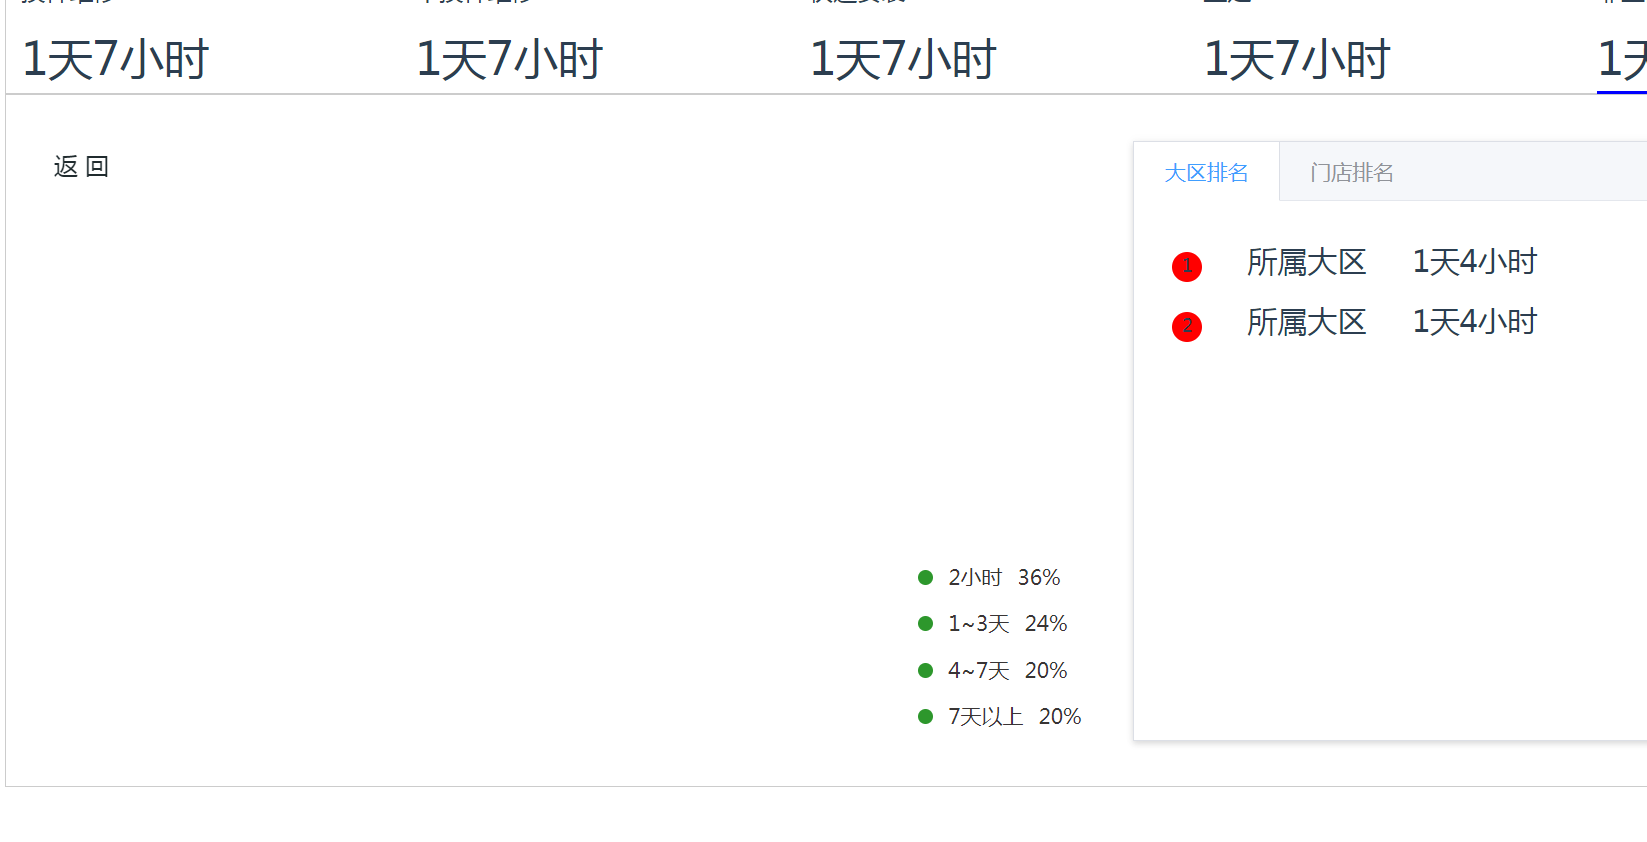
不卡顿状态:
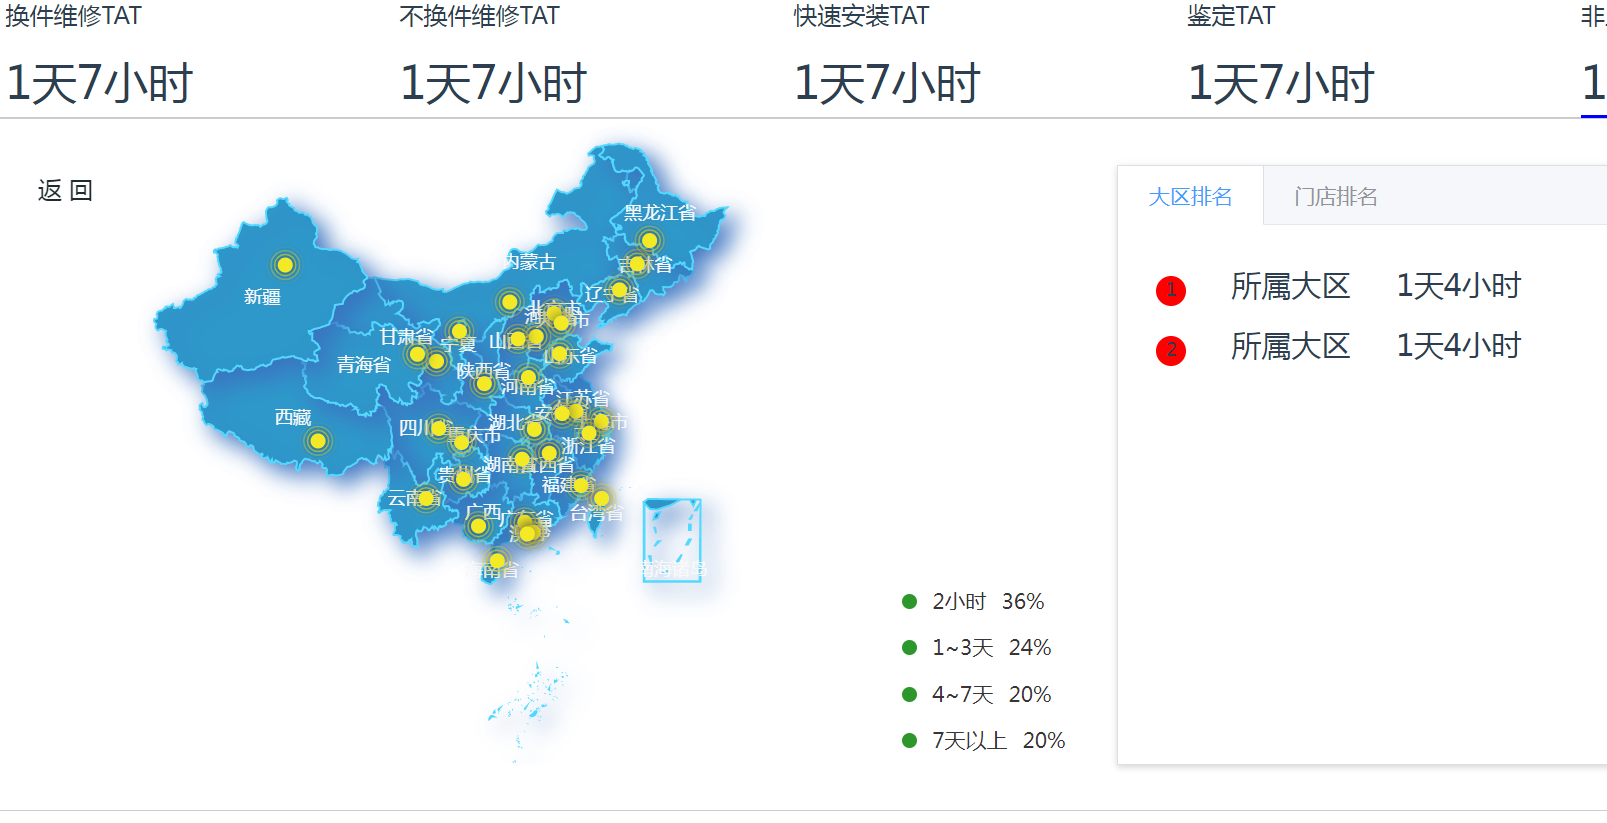
就算下钻再深也没关系
完整代码:
<!-- 大区服务 -->
<template>
  <div class="main">
     <headbreak style="background: #fff" :titlearr="titlearr"></headbreak>
     <div style="display:none;">
      <el-button @click="toPage('1')">30分钟及时预约率</el-button>
    <el-button @click="toPage('2')">预约准时上门率</el-button>
    <el-button @click="toPage('3')">TAT平均服务完成时长</el-button>
    <el-button @click="toPage('4')">投诉7天解决率</el-button>
    <el-button @click="toPage('5')">一次修复率</el-button>
    <el-button @click="toPage('6')">2天维修达成率</el-button>
    <el-button @click="toPage('7')">N+1投诉解决方案提交率</el-button>
     </div>
    <!-- 搜索栏 -->
    <div style="width:100%;display:flex;margin:10px;">
      <!-- <amap></amap> -->
    <el-button @click="qucklysearch('近3天')">近3天</el-button>
    <el-button @click="qucklysearch('近7天')">近7天</el-button>
    <el-button @click="qucklysearch('近30天')">近30天</el-button>
    <el-button @click="qucklysearch('本周')">本周</el-button>
    <el-button @click="qucklysearch('本月')">本月</el-button>
    <el-button @click="qucklysearch('自定义')">自定义</el-button>
    <div style="width:300px;margin-left:10px;">
    <mytimer :timerrange.sync = "timerangedate"></mytimer>
    </div>
    <span>
      <el-select v-model="pinleitype">
        <el-option value="1">1</el-option>
        <el-option value="2">2</el-option>
      </el-select>
    </span>
    <span>
      <el-button v-popover:popover2>默认 <i class="el-icon-arrow-down"></i></el-button>
      <el-popover
        ref="popover2"
        placement="bottom"
        title="标题"
        width="200"
        trigger="click"
        content="这是一段内容,这是一段内容,这是一段内容,这是一段内容。">
        <p>
          <span>洗衣机品类近七日数据</span>
          <span>首选项</span>
          <span><i class="el-icon-delete"></i></span>
        </p>
        <p>21212112</p>
        <p>21212112</p>
      </el-popover>
    </span>
    </div>
    <!-- 折现图表看板 -->
    <div class="boardbox1">
      <ul>
        <li>
           <cardyuyuelv></cardyuyuelv>
        </li>
        <li>
           <cardyuyuelv id="chart_category_2"
           title="预约准时上门率"
           wanchenglv="80%"
           ></cardyuyuelv>
        </li>
        <li>
           <cardyuyuelv id="chart_category_3" title="改约率"
            wanchenglv="10%"
           ></cardyuyuelv>
        </li>
        <li>
           <cardyuyuelv id="chart_category_4" title="TAT平均服务完成时长"
            wanchenglv="1天3小时"
           ></cardyuyuelv>
        </li>
      </ul>
    </div>
    <!-- 地图 -->
    <div class="mapbox">
      <ul>
        <li  @click="chosethismaptab(1)">
          <p>换件维修TAT</p>
          <p :class="this.tabind == 1 ? 'active' : ''">1天7小时</p>
        </li>
        <li  @click="chosethismaptab(2)">
          <p>不换件维修TAT</p>
          <p :class="this.tabind == 2 ? 'active' : ''">1天7小时</p>
        </li>
         <li  @click="chosethismaptab(3)">
          <p>快速安装TAT</p>
          <p :class="this.tabind == 3 ? 'active' : ''">1天7小时</p>
        </li>
          <li  @click="chosethismaptab(4)">
          <p>鉴定TAT</p>
          <p :class="this.tabind == 4 ? 'active' : ''">1天7小时</p>
        </li>
         <li @click="chosethismaptab(5)">
          <p>非上门服务TAT</p>
          <p :class="this.tabind == 5 ? 'active' : ''">1天7小时</p>
        </li>
      </ul>
      <div class="mapcontent">
         <div class="mapchart">
           <amap :key="mapkey" ref='mymap'></amap>
      </div>
      <div class="zhibiao">
        <p>
          <span></span>
          <span>2小时</span>
          <span>36%</span>
        </p>
         <p>
          <span></span>
          <span>1~3天</span>
          <span>24%</span>
        </p>
         <p>
          <span></span>
          <span>4~7天</span>
          <span>20%</span>
        </p>
         <p>
          <span></span>
          <span>7天以上</span>
          <span>20%</span>
        </p>
      </div>
      <div class="maptabs">
        <el-tabs style="margin-top:20px;height:400px;" type="border-card">
          <el-tab-pane label="大区排名">
            <p @click="fnchosethislist">
              <span>1</span>
              <span>所属大区</span>
              <span>1天4小时</span>
            </p>
            <p>
              <span>2</span>
              <span>所属大区</span>
              <span>1天4小时</span>
            </p>
          </el-tab-pane>
          <el-tab-pane label="门店排名">
             <p>
              <span>1</span>
              <span>所属门店</span>
              <span>1天4小时</span>
            </p>
            <p>
              <span>2</span>
              <span>所属门店</span>
              <span>1天4小时</span>
            </p>
          </el-tab-pane>
        </el-tabs>
      </div>
      </div>
    </div>
  </div>
</template>
<script>
export default {
  data() {
    return {
      timerangedate:"",
      pinleitype:"",
      titlearr:["数据看板","大区服务"],
      tabind:1,
      mapkey:1,
    }
  },
  components:{
    headbreak: () => import("../partsManagement/components/headbreak.vue"),
    amap:()=>import('./charts/mapchart.vue'),
    mytimer: ()=>import('../settlementMgt/components/mypickerange.vue'),
    cardyuyuelv: ()=>import('./components/cardyuyuelv.vue')

  },
  methods: {
    fnchosethislist(){
    },
    chosethismaptab(ind){ // 每次重新交互接受新数据
      this.tabind = ind
      this.$refs.mymap.destr() // 每次重新加载 通知子组件先销毁再渲染
      this.mapkey+=1
    },
    toPage(val) {
      switch (val) {
        case'1':
          this.$router.push({ name:'timelyRatw'});
          break;
        case '2':
          this.$router.push({ name:'punctualRate'});
          break;
        case '3':
          this.$router.push({ name:'avgTime'});
          break;
        case '4':
          this.$router.push({ name:'resolutionRate'});
          break;
        case '5':
          this.$router.push({ name:'repairRate'});
          break;
        case '6':
          this.$router.push({ name:'maintenanceRate'});
          break;
        case '7':
          this.$router.push({ name:'reductionRate'});
          break;
      }

      return type;
    },
    qucklysearch(timer){
      console.log(timer)
    },
  }
}
</script>
<style lang="less" scoped>
.main{
  width:99.8%;
  // background:pink;
}
.mapbox{
  margin:10px;
  ul{
    display: flex;justify-content:space-between;cursor:pointer;border:1px solid #ccc;
    li{
      p{position:relative;bottom:-11px;}
       p:nth-child(1){
         font-size:16px;
       }
      p:nth-child(2){
        font-size:30px;
        &.active{
          border-bottom:2px solid blue;
        }
      }
    }
  }
  .mapcontent{
    border:1px solid #ccc;padding-bottom:20px;
    display: flex;justify-content:flex-start;
    .mapchart{width:50%;
      height:430px;
      background:#fff;
    }
    .zhibiao{width:12%;
    position:relative;top:300px;
    >p{
      color:rgb(57, 53, 53);font-size:14px;
      span:nth-child(1){display: inline-block;width:10px;height:10px;border-radius:10px;background:rgb(45, 151, 44);}
      span:nth-child(2){margin-left:10px;}
      span:nth-child(3){margin-left:10px;}
    }
    }
    .maptabs{width:38%;padding:10px;
      p{
        cursor:pointer;
        span:nth-child(1){display: inline-block;width:20px;height:20px;border-radius:10px;background:red;text-align: center;}
        span:nth-child(2){margin-left:30px;font-size:20px;}
        span:nth-child(3){margin-left:30px;font-size:20px;}
      }
    }
  }
}
  .boardbox1{
    ul{
      display: flex;justify-content:space-between;
      li{
        width:25%;
        // border:1px solid #ccc;
        // box-shadow: 2px 4px 8px #ccc;
      }
    }
  }
</style>
<template>
<div>
<div id="container">
<div class="back" @click="backfn">返 回</div>
<div :id="root" class="rootCls"></div>
</div>
</div>
</template>
<script>
import AMapLoader from "@amap/amap-jsapi-loader";
import * as echarts from "echarts";
var geoJson = {
features: [],
};
var parentInfo = [
{
cityName: "全国",
level: "china",
code: 100000,
},
];
var timeTitle = ["2022"];
export default {
name: "",
props: {
root:{
type:String,
default:'root'
}
},
data() {
return {
myChart:null,
};
},
components: {},
methods: {
// 渲染地图echarts
initEchartMap(mapData, sum, pointData) {
//这里做个切换,全国的时候才显示南海诸岛 只有当注册的名字为china的时候才会显示南海诸岛
if (parentInfo.length === 1) {
echarts.registerMap("china", geoJson); //注册
} else {
echarts.registerMap("map", geoJson); //注册
}
var option = {
timeline: {
show:false, // 底部时间线关闭
data: timeTitle,
axisType: "category",
autoPlay: true,
playInterval: 3000,
left: "10%",
right: "10%",
bottom: "3%",
width: "80%",
label: {
normal: {
textStyle: {
color: "rgb(179, 239, 255)",
},
},
emphasis: {
textStyle: {
color: "#fff",
},
},
},
symbolSize: 10,
lineStyle: {
color: "#8df4f4",
},
checkpointStyle: {
borderColor: "#8df4f4",
color: "#53D9FF",
borderWidth: 2,
},
controlStyle: {
showNextBtn: true,
showPrevBtn: true,
normal: {
color: "#53D9FF",
borderColor: "#53D9FF",
},
emphasis: {
color: "rgb(58,115,192)",
borderColor: "rgb(58,115,192)",
},
},
},
baseOption: {
animation: true,
animationDuration: 1000,
animationEasing: "cubicInOut",
animationDurationUpdate: 1000,
animationEasingUpdate: "cubicInOut",
tooltip: {
trigger: "item",
},
toolbox: {
show:false, // 转为table 展示 关闭
feature: {
restore: {
show: false,
},
dataView: {
optionToContent: function (opt) {
let series = opt.series[0].data; //折线图数据
let tdHeads =
'<th style="padding: 0 20px">所在地区</th><th style="padding: 0 20px">销售额</th>'; //表头
let tdBodys = ""; //数据
let table = `<table border="1" style="margin-left:20px;border-collapse:collapse;font-size:14px;text-align:left;"><tbody><tr>${tdHeads} </tr>`;
for (let i = 0; i < series.length; i++) {
table += `<tr>
<td style="padding: 0 50px">${series[i].name}</td>
<td style="padding: 0 50px">${series[
i
].value.toFixed(2)}万</td>
</tr>`;
}
table += "</tbody></table>";
return table;
},
},
saveAsImage: {
show:false, // 下载地图功能
name:
parentInfo[parentInfo.length - 1].cityName + "销售额统计图",
},
dataZoom: {
show: false,
},
magicType: {
show: false,
},
},
iconStyle: {
normal: {
borderColor: "#1990DA",
},
},
top: 15,
right: 35,
},
geo: {
map: parentInfo.length === 1 ? "china" : "map",
zoom: 1.2, // 初始化大小
top:50,
roam: true,
tooltip: {
trigger: "item",
formatter: (p) => {
let val = p.value[2];
if (window.isNaN(val)) {
val = 0;
}
let txtCon =
"<div style='text-align:left'>" +
p.name +
":<br />销售额:" +
val.toFixed(2) +
"万</div>";
return txtCon;
},
},
label: {
normal: {
show: true,
color: "rgb(249, 249, 249)", //省份标签字体颜色
formatter: (p) => {
switch (
p.name // 地图上的标名
) {
case "内蒙古自治区":
p.name = "内蒙古";
break;
case "西藏自治区":
p.name = "西藏";
break;
case "新疆维吾尔自治区":
p.name = "新疆";
break;
case "宁夏回族自治区":
p.name = "宁夏";
break;
case "广西壮族自治区":
p.name = "广西";
break;
case "香港特别行政区":
p.name = "香港";
break;
case "澳门特别行政区":
p.name = "澳门";
break;
default:
break;
}
return p.name;
},
},
emphasis: {
show: true,
color: "#f75a00",
},
},
itemStyle: {
normal: {
areaColor: "#24CFF4",
borderColor: "#53D9FF",
borderWidth: 1.3,
shadowBlur: 15,
shadowColor: "rgb(58,115,192)",
shadowOffsetX: 7,
shadowOffsetY: 6,
},
emphasis: {
areaColor: "#8dd7fc",
borderWidth: 1.6,
shadowBlur: 25,
},
},
},
},
options: [],
};
timeTitle.forEach((item) => {
var min = mapData[item][mapData[item].length - 1].value;
var max = mapData[item][0].value;
if (mapData[item].length === 1) {
min = 0;
}
option.options.push({
// backgroundColor: "#012248",// 背景色
title: [ // 头部标题
// {
// left: "center",
// top: 10,
// text:
// item +
// "年" +
// parentInfo[parentInfo.length - 1].cityName +
// "销售额统计图(可点击)",
// textStyle: {
// color: "red",
// fontSize: 12,
// },
// },
// {
// text: "年度销售总额:" + sum[item].toFixed(2) + "万",
// left: "center",
// top: "6.5%",
// textStyle: {
// color: "#FFAC50",
// fontSize: 26,
// },
// },
],
visualMap: {
min: min,
max: max,
left: "-13%", // 隐掉左下脚本条
bottom: "5%",
calculable: true,
seriesIndex: [0],
inRange: {
color: ["#24CFF4", "#2E98CA", "#1E62AC"], // 地图颜色配置 -原色
// color: ["#010824", "#010824", "#010824"], // 地图颜色配置
},
textStyle: {
color: "#24CFF4",
},
},
series: [
{
name: item + "销售额度",
type: "map",
geoIndex: 0,
map: parentInfo.length === 1 ? "china" : "map",
roam: true,
zoom: 1.3,
tooltip: {
trigger: "item",
formatter: (p) => {
let val = p.value;
if (p.name == "南海诸岛") return;
if (window.isNaN(val)) {
val = 0;
}
let txtCon =
"<div style='text-align:left'>" +
p.name +
":<br />销售额:" +
val.toFixed(2) +
"万</div>";
return txtCon;
},
},
label: {
normal: {
show: false,
},
emphasis: {
show: false,
},
},
data: mapData[item],
},
{
name: "散点",
type: "effectScatter",
coordinateSystem: "geo",
rippleEffect: {
// brushType: "fill",
brushType: 'stroke'
},
showEffectOn: 'render', //'emphasis' 高亮(hover)的时候显示特效
hoverAnimation: true,//图形上的文本标签,可用于说明图形的一些数据信息,比如值,名称等
itemStyle: {
normal: {
// color: 'purple',
color: "#F4E925", // 地图散点配置色 - 原色
// color: "#6034fd", // 地图散点配置色
shadowBlur: 10,
shadowColor: "#333",
},
},
data: pointData[item],
// symbolSize: 8,
symbolSize: function (val) {
let value = val[1];
if (value == max) {
return 11;
}
return 10;
},
showEffectOn: "render", //加载完毕显示特效
},
],
});
});
console.log(this.root,'---')
var myChart = echarts.init(document.getElementById(this.root));
this.myChart = echarts.init(document.getElementById(this.root));
myChart.setOption(option, true); // 第二个参数尤其重要,如果不设置地图一点击就会跑偏甚至跑出content,设置后会原始坐标上渲染显示
//点击前解绑,防止点击事件触发多次
myChart.off("click");
myChart.on("click", this.echartsMapClick);
},
// 监听echarts 的点击事件
echartsMapClick(params) {
if (!params.data) {
return;
} else {
//如果当前是最后一级,那就直接return
if (parentInfo[parentInfo.length - 1].code == params.data.cityCode) {
return;
}
let data = params.data;
parentInfo.push({
cityName: data.name,
level: data.level,
code: data.cityCode,
});
this.getGeoJson(data.cityCode);
}
},
// 获取地图数据
getMapData() {
let mapData = {},
pointData = {},
sum = {};
for (let i = 0; i < timeTitle.length; i++) {
mapData[timeTitle[i]] = [];
pointData[timeTitle[i]] = [];
sum[timeTitle[i]] = 0;
for (let j = 0; j < geoJson.features.length; j++) {
let value = 1;
mapData[timeTitle[i]].push({
name: geoJson.features[j].properties.name,
value: value,
level: geoJson.features[j].properties.level,
cityCode: geoJson.features[j].properties.adcode,
});
pointData[timeTitle[i]].push({
name: geoJson.features[j].properties.name,
value: [
geoJson.features[j].properties.center[0],
geoJson.features[j].properties.center[1],
value,
],
cityCode: geoJson.features[j].properties.adcode,
});
sum[timeTitle[i]] += value;
}
mapData[timeTitle[i]] = mapData[timeTitle[i]].sort(function (a, b) {
return b.value - a.value;
});
}
this.initEchartMap(mapData, sum, pointData);
},
// 获取地图初始化json数据
getGeoJson(adcode) {
// console.log(this) // vue
let that = this;
console.log(adcode, AMapUI, "------");
AMapUI.loadUI(["geo/DistrictExplorer"], (DistrictExplorer) => {
var districtExplorer = new DistrictExplorer();
districtExplorer.loadAreaNode(adcode, function (error, areaNode) {
if (error) {
console.error(error);
return;
}
let Json = areaNode.getSubFeatures();
if (Json.length > 0) {
geoJson.features = Json;
} else if (Json.length === 0) {
geoJson.features = geoJson.features.filter(
(item) => item.properties.adcode == adcode
);
if (geoJson.features.length === 0) return;
}
// console.log(this) // DistrictExplorer
that.getMapData();
});
});
},
// 返回上一级
backfn() {
if (parentInfo.length === 1) {
return;
}
parentInfo.pop();
this.getGeoJson(parentInfo[parentInfo.length - 1].code);
},
// 初始化地图 必须
initAMap() {
AMapLoader.load({
key: mykey,
version: "2.0",
plugins: ["AMap.ToolBar", "AMap.Driving"],
AMapUI: {
version: "1.1",
plugins: [],
},
Loca: {
version: "2.0",
},
})
.then((AMap) => {
// 注释的内容是高德官网渲染其它地图的组件 测试用例 这里不再演示
// this.map = new AMap.Map("container", {
// viewMode: "3D",
// zoom: 5,
// zooms: [2, 22],
// center: [105.602725, 37.076636],
// });
// this.my_init(); // 高德测试用例用来调用高德ui组件
this.getGeoJson(100000);
})
.catch((e) => {
console.log(e);
});
},
my_init() {
// 高德测试用例用来调用高德ui组件
// initAMapUI(); //这里调用initAMapUI前先初始化
// //其他逻辑
// AMapUI.loadUI(
// [
// "overlay/SimpleMarker", //SimpleMarker
// "overlay/SimpleInfoWindow", //SimpleInfoWindow
// ],
// (SimpleMarker, SimpleInfoWindow) => {
// //....引用加载的UI....
// console.log(SimpleMarker, SimpleInfoWindow);
// this.initPage(SimpleMarker);
// }
// );
},
destr(){
console.log('dispose')
this.myChart.dispose();
},
//初始化到页面
initPage(SimpleMarker) {
//创建SimpleMarker实例
new SimpleMarker({
//前景文字
iconLabel: "点",
//图标主题
iconTheme: "default",
//背景图标样式
iconStyle: "pink",
//...其他Marker选项...,不包括content
map: this.map,
position: [117.405285, 39.904989],
});
//创建SimpleMarker实例
new SimpleMarker({
//前景文字
iconLabel: {
innerHTML: "<i>B</i>", //设置文字内容
style: {
color: "#fff", //设置文字颜色
},
},
//图标主题
iconTheme: "fresh",
//背景图标样式
iconStyle: "black",
//...其他Marker选项...,不包括content
map: this.map,
position: [110.315285, 39.924989],
});
},
},
mounted() {
// this.getGeoJson(100000);
this.initAMap();
},
};
</script>
<style scoped lang="less">
.rootCls {
width: 600px;
height: 430px;
// border: 1px solid rgb(161, 153, 153);
position: fixed;
top: 0px;
z-index: 10;
}
.back {
text-align: center;
width: 60px;
height: 30px;
line-height: 30px;
border: 1px solid #fff;
border-radius: 4px;
position: absolute;
left: 20px;
top: 30px;
color: rgb(32, 43, 46);
font-size: 16px;
cursor: pointer;
z-index: 100000;
}
#container {
padding: 0px;
margin: 0px;
// width: 100%;
// height: 100%;
position: absolute;
z-index: 9;
}
</style>

 浙公网安备 33010602011771号