
python爬取中国地震网
(一)选题背景
地震(earthquake)又称地动、地振动,是地壳快速释放能量过程中造成的振动,期间会产生地震波的一种自然现象。地球上板块与板块之间相互挤压碰撞,造成板块边沿及板块内部产生错动和破裂,是引起地震的主要原因。 地震开始发生的地点称为震源,震源正上方的地面称为震中。地震常常造成严重人员伤亡,能引起火灾、水灾、有毒气体泄漏、细菌及放射性物质扩散,还可能造成海啸、滑坡、崩塌、地裂缝等次生灾害。给人们带来灾难。
(二)主题式网络爬虫设计方案
1、爬虫名称:爬取中国地震网2013年到2021年的地震
2、爬取内容:爬取中国地震网的震级、发震时刻、维度、经度、深度、参考位置等
3、主题式网络爬虫设计方案概述:数据的爬取与清洗、数据模型分析,数据可视化处理,绘制分布图等
技术难点:数据化的分析还有可视化等不好解决
(三)、主题页面的结构特征分析
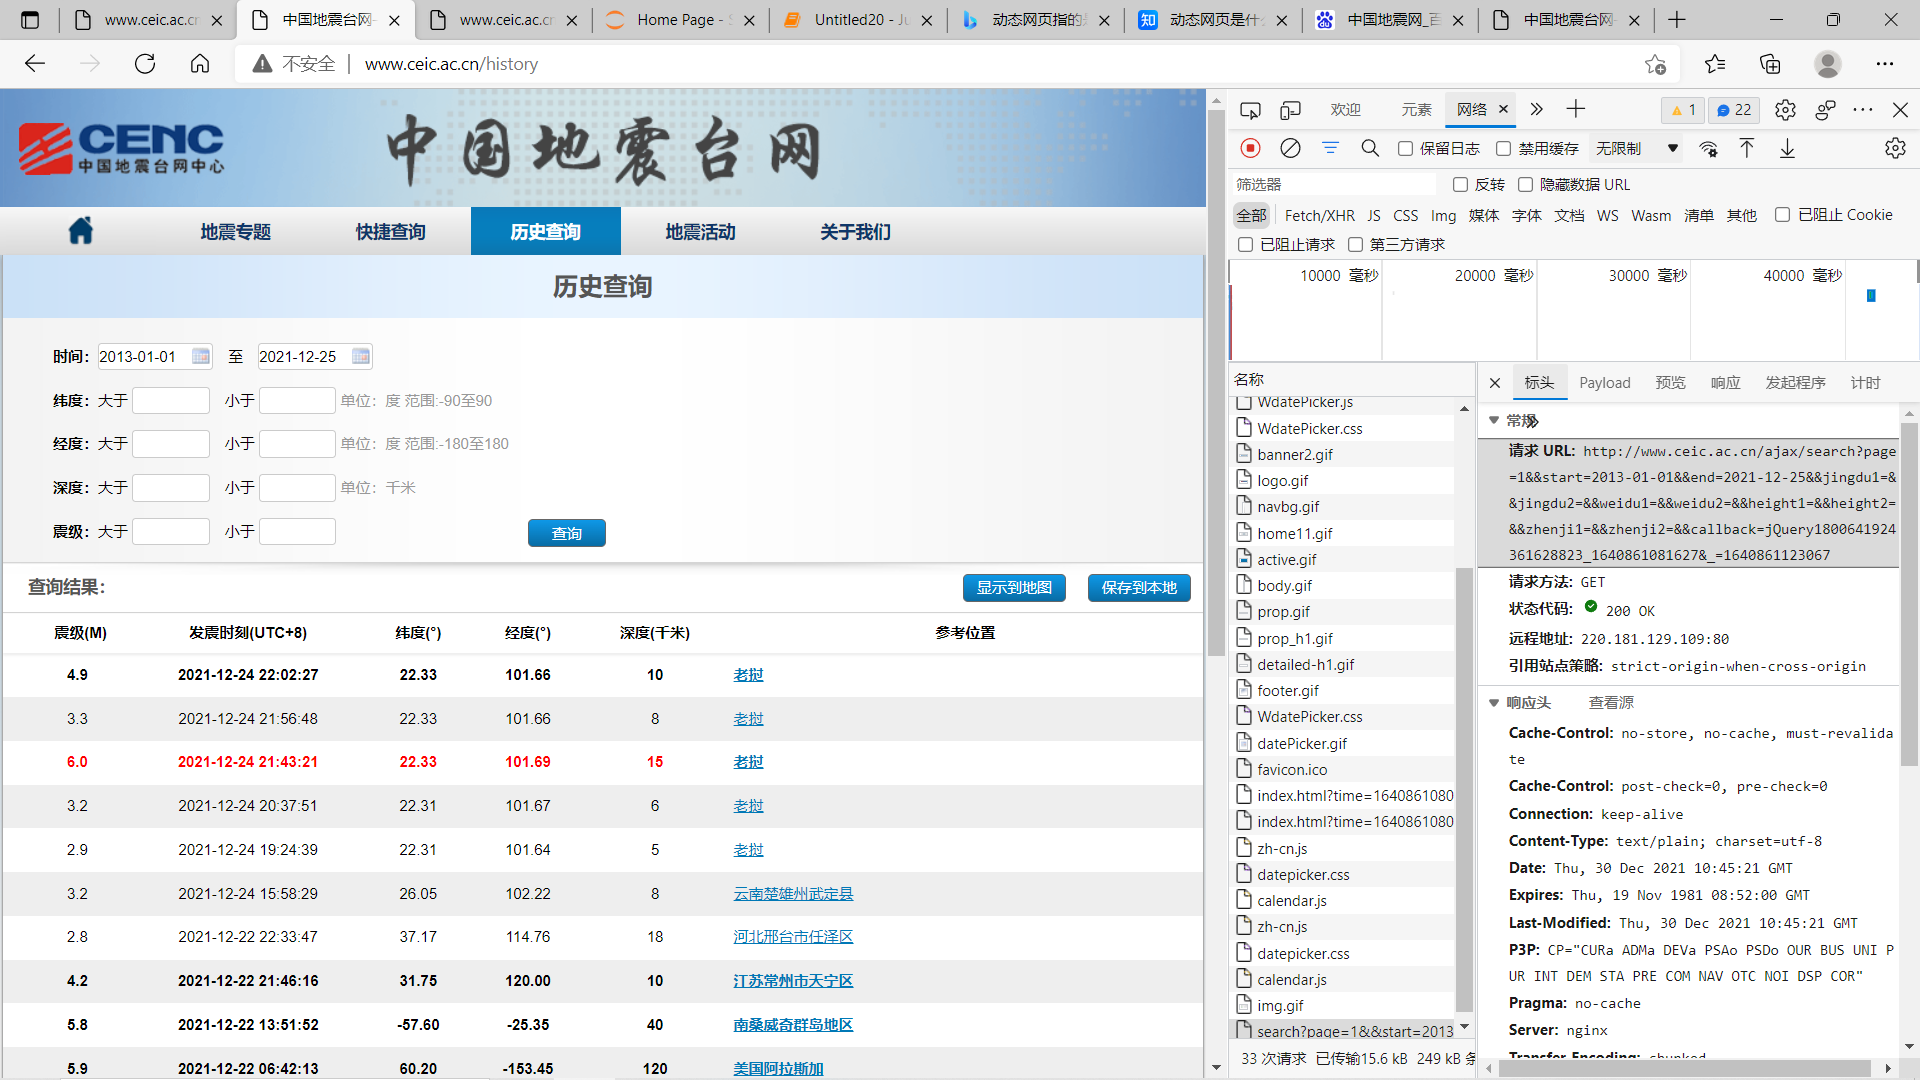
爬取网址首页地址:https://news.ceic.ac.cn
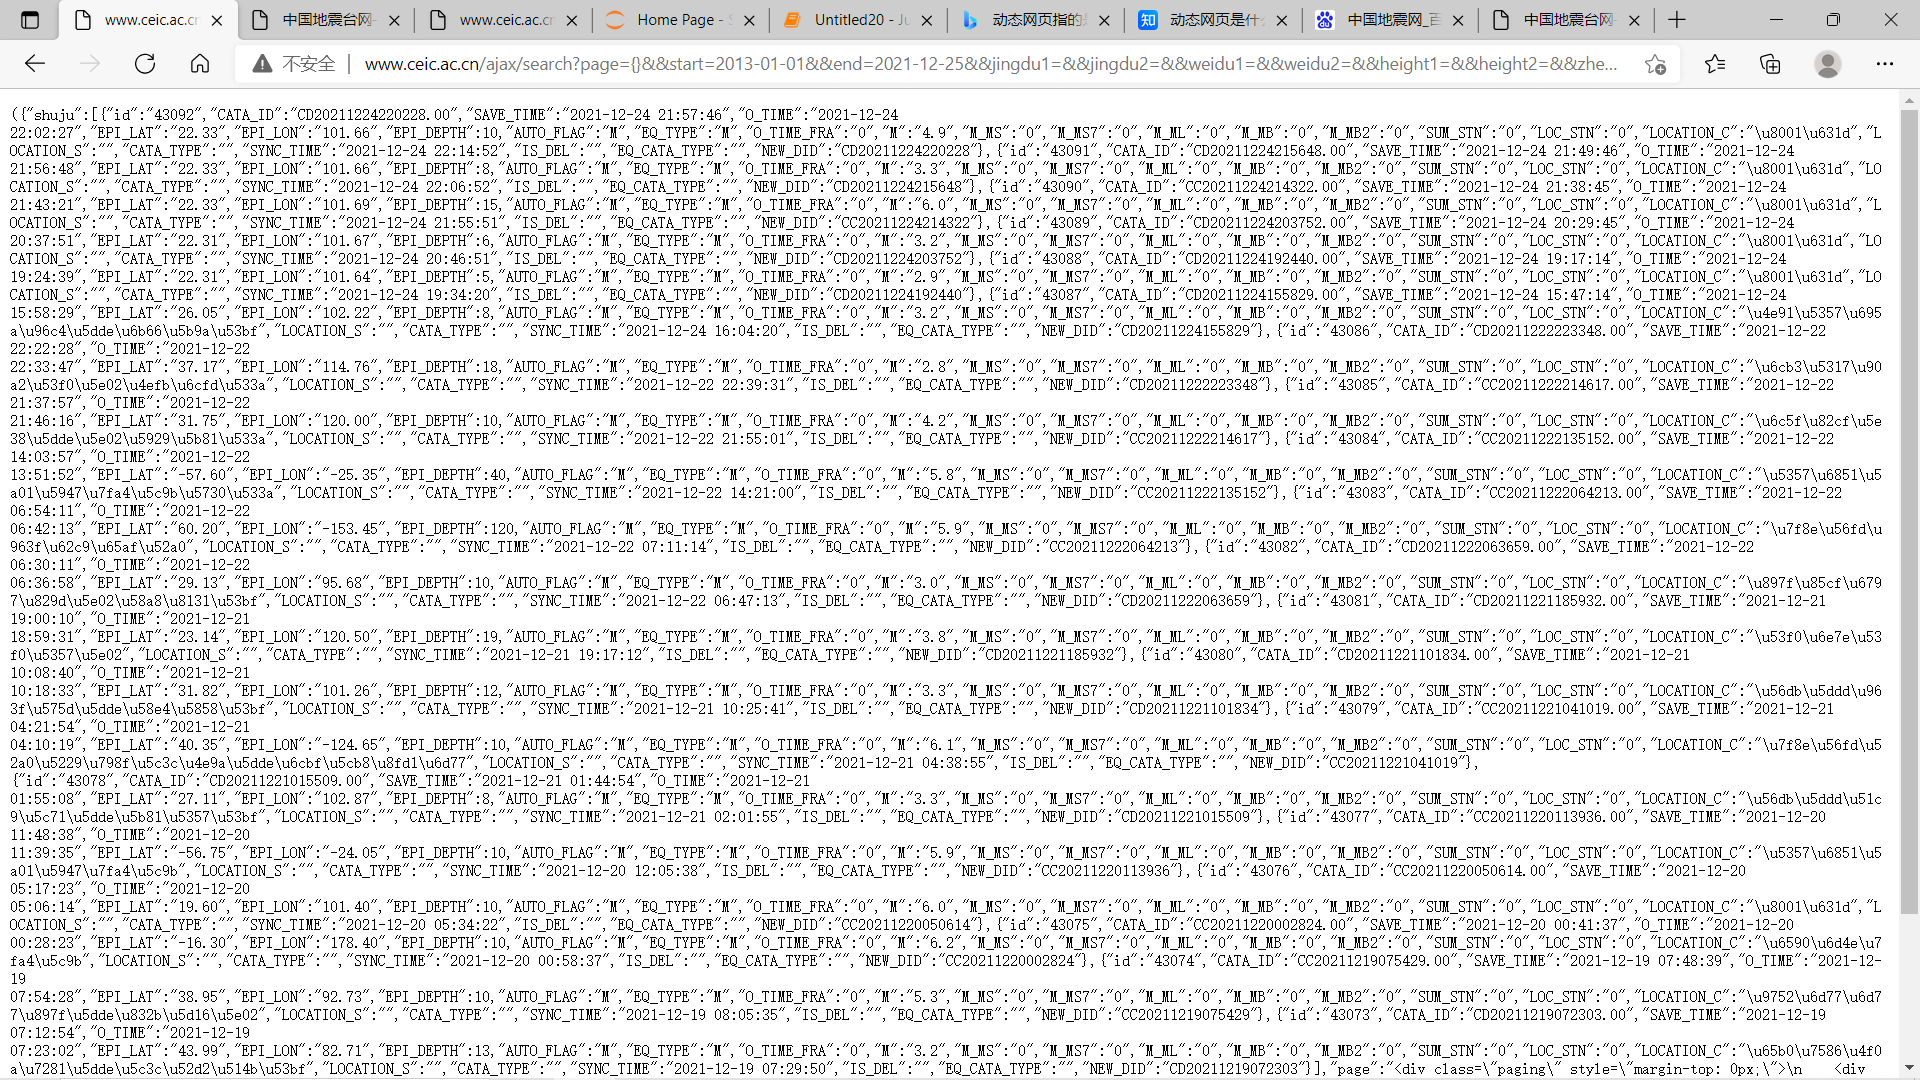
爬取的网址URL:http://www.ceic.ac.cn/ajax/search?page=1&&start=2013-01-01&&end=2021-12-25&&jingdu1=&&jingdu2=&&weidu1=&&weidu2=&&height1=&&height2=&&zhenji1=&&zhenji2=&&callback=jQuery1800641924361628823_1640861081627&_=1640861123067
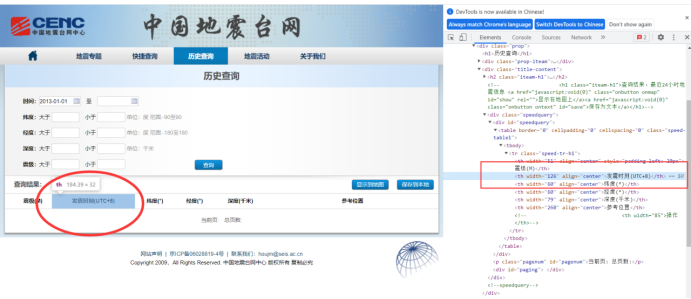
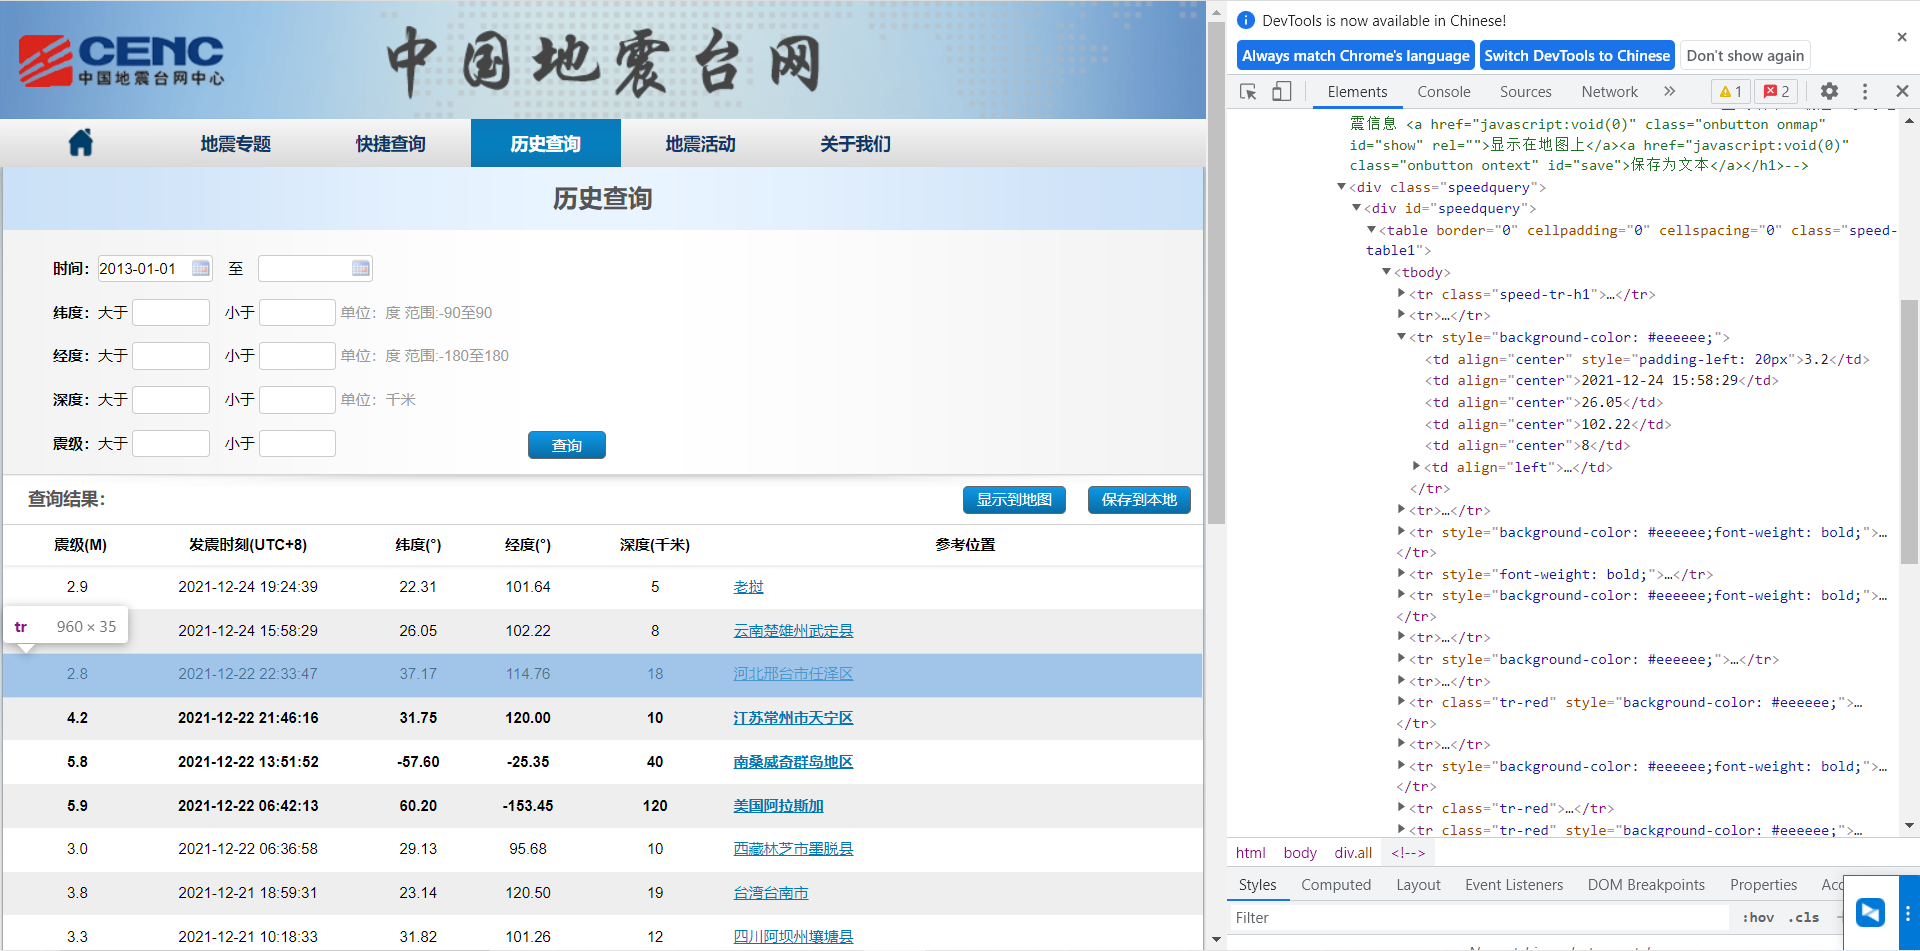
1、主题页面的结构与特征分析
通过解析HTML代码,找到table标签里的tr,没一个<tr>包含一行地震数据,<tr>里的<td>是每一条地震数据的具体信息,比如震级,日期,经度,纬度等等
2、页面解析:
(四)、网络爬虫程序设计
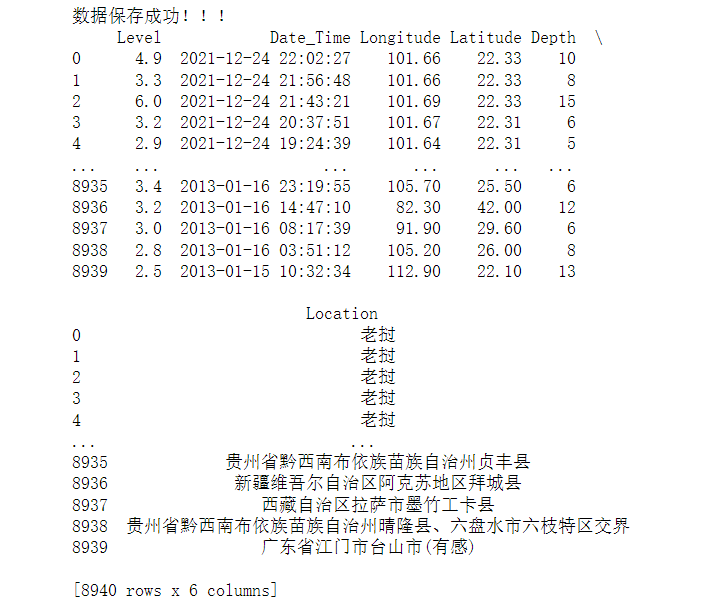
 1 import requests
 2 import pandas as pd
 3 import re
 4
 5
 6 # 获取所有的页面url
 7 def get_url():
 8     list = []
 9     for i in range(1, 448):  # 448
10         url = "http://www.ceic.ac.cn/ajax/search?page={}&&start=2013-01-01&&end=2021-12-25&&jingdu1=&&jingdu2=&&weidu1=&&weidu2=&&height1=&&height2=&&zhenji1=&&zhenji2=&&".format(
11             i)
12         list.append(url)
13     return list
14 # 爬取所有url
15 def crawl_data(ls):
16     list = []
17     for i in ls:
18         resp = requests.get(i)
19         list.append(resp.text)
20     return list
21 # 将Unicode编码转化为中文
22 def conversion(ls):
23     list = []
24     for i in ls:
25         s = eval('u"%s"' % i)
26         list.append(s)
27     return list
28 # 程序主体
29 if __name__ == '__main__':
30     all_url = get_url()
31     resp = crawl_data(all_url)
32     # 通过正则抓取所有的数据
33     Level = re.findall('"M":"(.*?)"', str(resp))  # 地震等级
34     Date_Time = re.findall('"O_TIME":"(.*?)"', str(resp))  # 时刻
35     Longitude = re.findall('"EPI_LON":"(.*?)"', str(resp))  # 经度
36     Latitude = re.findall('"EPI_LAT":"(.*?)"', str(resp))  # 纬度
37     Depth = re.findall('"EPI_DEPTH":([0-9]+)', str(resp))  # 深度
38     Location_U = re.findall('"LOCATION_C":"(.*?)"', str(resp))  # 地址
39     Location = conversion(conversion(conversion(Location_U)))  # 解码
40     # 将数据转化为datafram格式
41     df = pd.DataFrame(
42         {'Level': Level, 'Date_Time': Date_Time, 'Longitude': Longitude, 'Latitude': Latitude, 'Depth': Depth,
43          'Location': Location})
44     # 将数据保存为Excel
45     writer = pd.ExcelWriter('./earthquake.xlsx')
46     df.to_excel(writer, columns=['Level', 'Date_Time', 'Latitude', 'Longitude', 'Depth', 'Location'], index=False,
47                 encoding='utf-8')
48     writer.save()
49     print("数据保存成功!!!")
50     print(df)
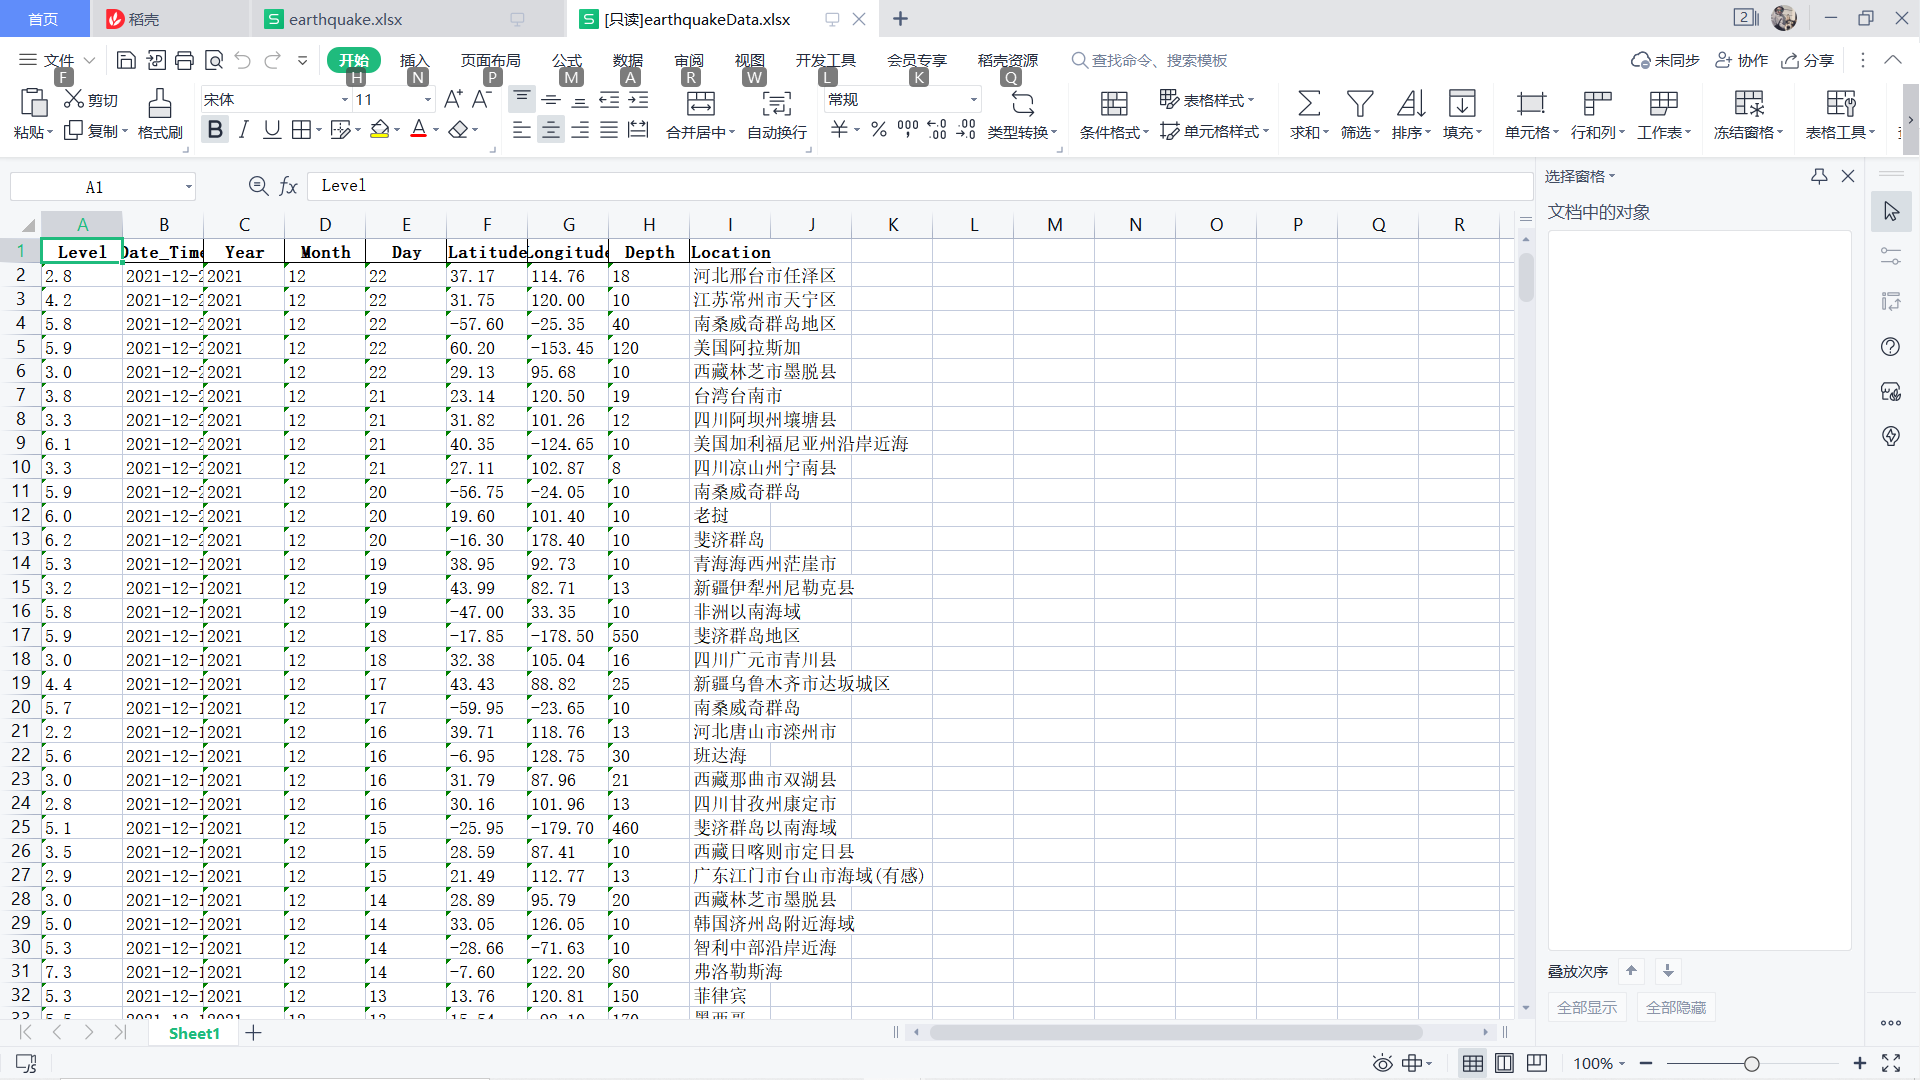
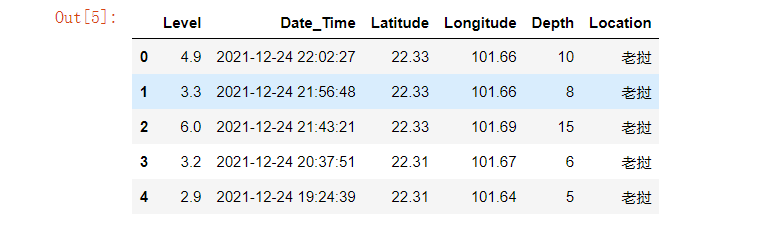
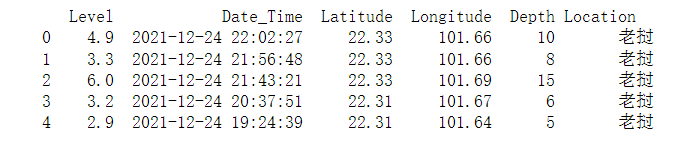
1 #读取csv文件
2 earthquake=pd.DataFrame(pd.read_excel('./Desktop/earthquake.xlsx'))
3 earthquake.head()
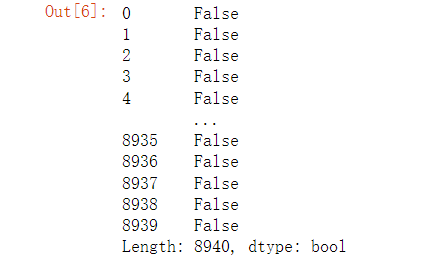
1 #检查是否有重复值 2 earthquake.duplicated()
1 #检查是否有空值 2 print(earthquake['Depth'].isnull().value_counts())

1 df = pd.DataFrame(pd.read_excel('./earthquake.xlsx')) 2 print(df.head())
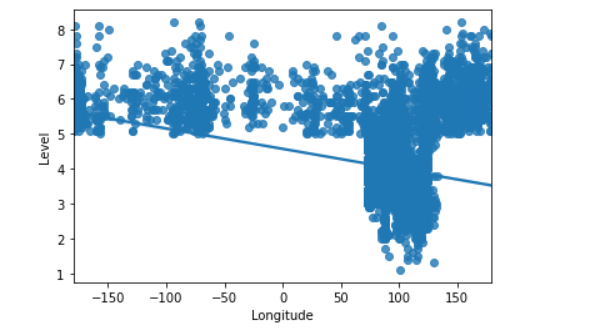
1 #绘制日期与深度回归图 2 import seaborn as sns 3 sns.regplot(earthquake.Longitude,earthquake.Level)
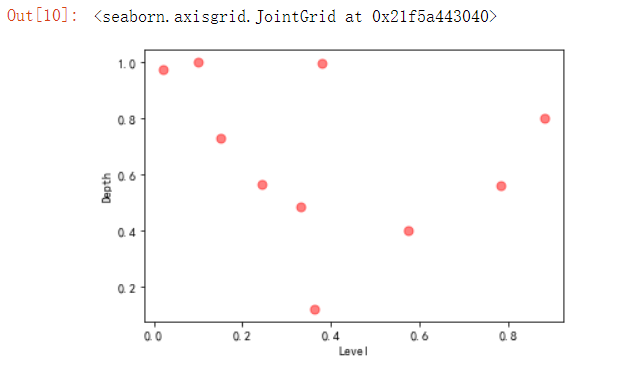
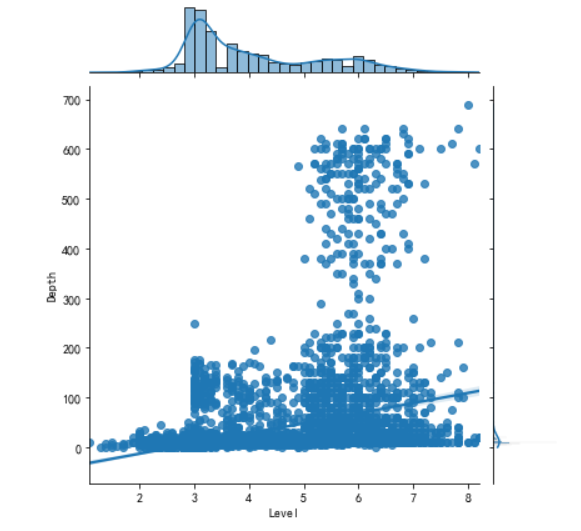
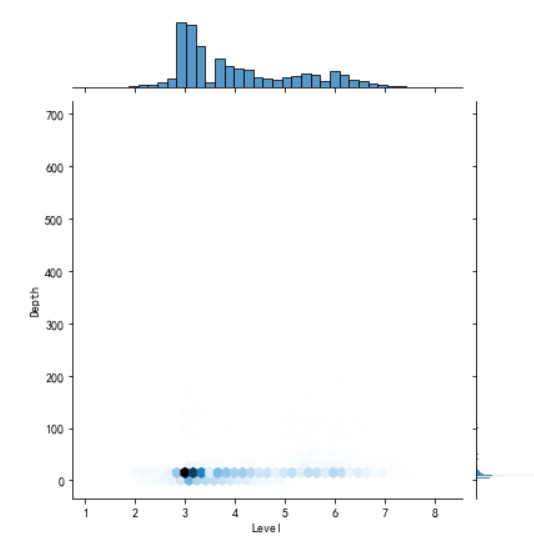
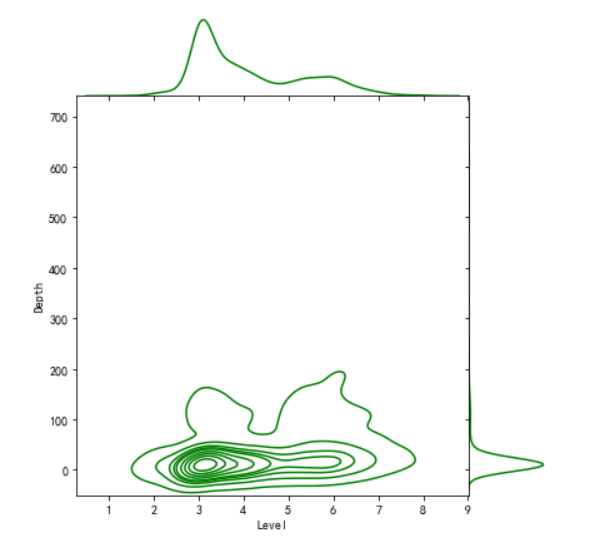
 1 import matplotlib.pyplot as plt
 2 import numpy as np
 3 #画出散点图
 4 plt.rcParams['font.sans-serif'] = ['SimHei']  # 用来正常显示中文标签
 5 plt.rcParams['axes.unicode_minus'] = False  # 用来正常显示负号
 6 N=10
 7 x=np.random.rand(N)
 8 y=np.random.rand(N)
 9 size=50
10 plt.xlabel("Level")
11 plt.ylabel("Depth")
12 plt.scatter(x,y,size,color='r',alpha=0.5,marker="o")
13 #散点图  kind='reg'
14 sns.jointplot(x="Level",y="Depth",data=earthquake,kind='reg')
15 #  kind='hex'
16 sns.jointplot(x="Level",y="Depth",data=earthquake,kind='hex')
17 # kind='kde'
18 sns.jointplot(x="Level",y="Depth",data=earthquake,kind="kde",space=0,color='g')
 1 #选择个特征变量,绘制分布图,用最小二乘法分析两个变量间的二次拟合方程和拟合曲线
 2 colnames=['Level', 'Date_Time', 'Latitude', 'Longitude', 'Depth', 'Location']
 3 df = pd.read_excel('./earthquake.xlsx',skiprows=0,names=colnames)
 4 X = df.Latitude
 5 Y = df.Level
 6 Z = df.Depth
 7 def A():
 8     plt.scatter(X,Y,color="blue",linewidth=2)
 9     plt.title("RM scatter",color="blue")
10     plt.grid()
11     plt.show()
12 A()

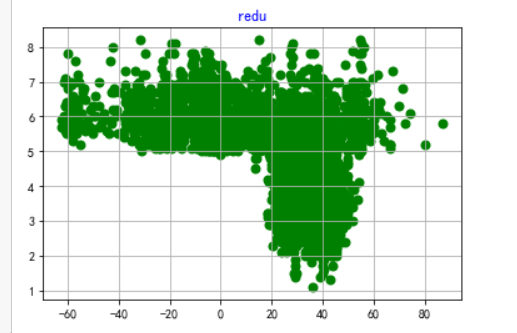
1 def B():
2     plt.scatter(X,Y,color="green",linewidth=2)
3     plt.title("redu",color="blue")
4     plt.grid()
5     plt.show()
6 B()
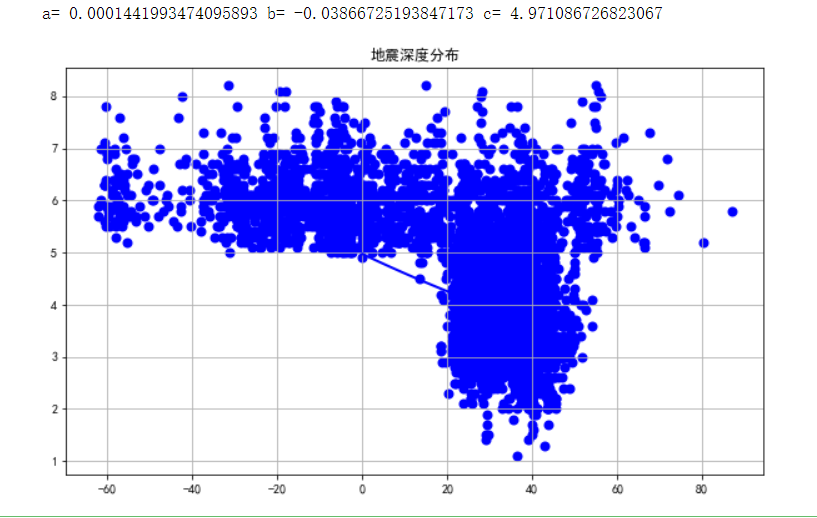
 1 from scipy.optimize import leastsq
 2 def func(p,x):
 3     a,b,c=p
 4     return a*x*x+b*x+c
 5 def error(p,x,y):
 6     return func(p,x)-y
 7 def main():
 8     plt.figure(figsize=(10,6))
 9     p0=[0,0,0]
10     Para = leastsq(error,p0,args=(X,Y))
11     a,b,c=Para[0]
12     print("a=",a,"b=",b,"c=",c)
13     plt.scatter(X,Y,color="blue",linewidth=2)
14     x=np.linspace(0,20,20)
15     y=a*x*x+b*x+c
16     plt.plot(x,y,color="blue",linewidth=2,)
17     plt.title("地震深度分布")
18     plt.grid()
19     plt.show()
20
21 main()
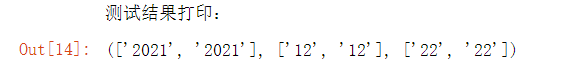
 1 # 用来清洗数据DateTime
 2 s = ['2021-12-22 22:33:47', '2021-12-22 21:46:16']  # 用来测试函数的数据
 3 def clear_datetime(date_list):
 4     # 为了拆分年月日,用来存放year、month 、day的空列表
 5     year = []
 6     month = []
 7     day=[]
 8     for s in date_list:
 9         #  通过split函数简单清洗数据
10         # 清洗年数据
11         s1 = s.split('-')[0]
12         # 清洗月数据
13         s2 = s.split('-')[1]
14         # 清洗日数据
15         ss = s.split('-')[2]
16         s3 = ss.split(' ')[0]
17         # 把数据添加到列表中
18         year.append(s1)
19         month.append(s2)
20         day.append(s3)
21         # 返回三元组,元组里的每一个元素是对应年月日的列表
22     return year,month,day
23
24 s = clear_datetime(s)      # 用于测试结果
25 print('测试结果打印:')
26 s
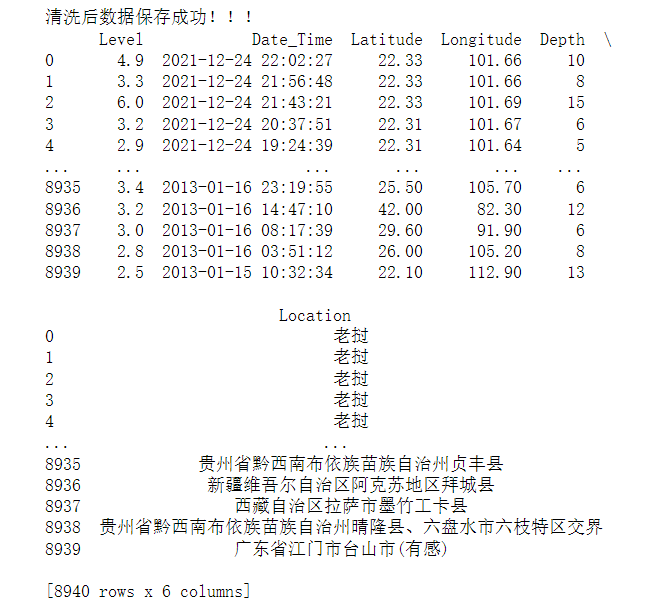
 1 # all_url = get_url()
 2 # resp = crawl_data(all_url)
 3 # 通过正则抓取所有的数据
 4 # 地震等级
 5 Level = re.findall('"M":"(.*?)"', str(resp))
 6  # 时刻
 7 Date_Time = re.findall('"O_TIME":"(.*?)"', str(resp))
 8  # 返回的是一个三元组
 9 date_result = clear_datetime(Date_Time)
10 # 元组里的每一元素是一个列表,对应年 月 日
11 Year = date_result[0]
12 Month = date_result[1]
13 Day = date_result[2]
14 # 经度
15 Longitude = re.findall('"EPI_LON":"(.*?)"', str(resp))
16 # 纬度
17 Latitude = re.findall('"EPI_LAT":"(.*?)"', str(resp))
18  # 深度
19 Depth = re.findall('"EPI_DEPTH":([0-9]+)', str(resp))
20  # 地址
21 Location_U = re.findall('"LOCATION_C":"(.*?)"', str(resp))
22 # 解码
23 Location = conversion(conversion(conversion(Location_U)))
24 # 将数据转化为datafram格式
25 df1 = pd.DataFrame(
26     {'Level': Level, 'Date_Time': Date_Time,'Year': Year,'Month': Month,'Day': Day,
27      'Longitude': Longitude, 'Latitude': Latitude, 'Depth': Depth, 'Location': Location})
28 # 将数据保存为Excel
29 # 清洗后的数据增加了年月日字段
30 writer = pd.ExcelWriter('./earthquakeData.xlsx')
31 df1.to_excel(writer, columns=['Level', 'Date_Time', 'Year', 'Month', 'Day', 'Latitude', 'Longitude', 'Depth', 'Location'], index=False,
32             encoding='utf-8')
33 writer.save()
34 print("清洗后数据保存成功!!!")
35 print(df)
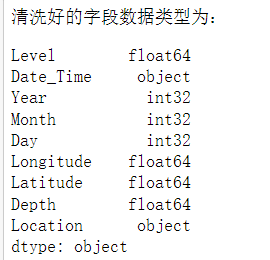
 1 # 对爬取的数据进行类型转换,为后面做比较做准备
 2 # 毕竟下载下来的数据是字符串类型,所以要转换为float类型和int类型
 3 # 把震级数据改成float浮点类型
 4 df1['Level'] = df1['Level'].astype('float')
 5 # 把年数据改成int整数类型
 6 df1['Year'] = df1['Year'].astype('int')
 7 # 把月数据改成int整数类型
 8 df1['Month'] = df1['Month'].astype('int')
 9 # 把日数据改成int整数类型
10 df1['Day'] = df1['Day'].astype('int')
11 # 把经度数据改成float浮点类型
12 df1['Latitude'] = df1['Latitude'].astype('float')
13 # 把维度数据改成float浮点类型
14 df1['Longitude'] = df1['Longitude'].astype('float')
15 # 把地震深度数据改成float浮点类型
16 df1['Depth'] = df1['Depth'].astype('float')
17 # 查看数据列类型
18 print('清洗好的字段数据类型为:')
19 df1.dtypes
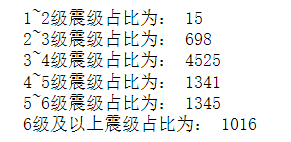
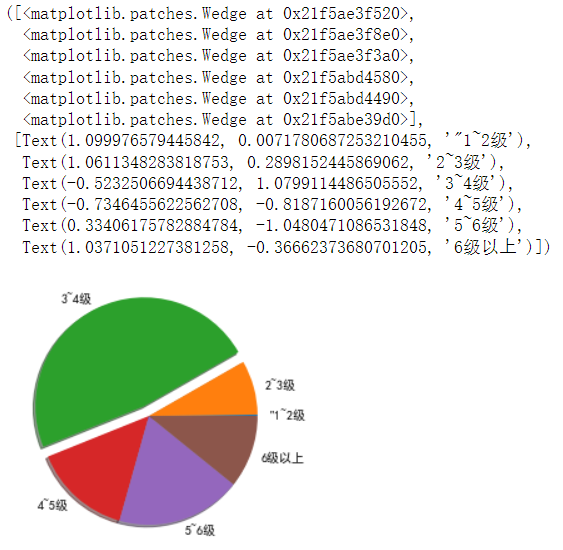
 1 all_data = df1
 2 # 统计2013~2021年的震级分布占比
 3 level_12 = all_data.query("Level >=1 and Level <2")
 4 # print(level_12)
 5 level_23 = all_data.query("Level >=2 and Level <3")
 6 # print(level_23)
 7 level_34 = all_data.query("Level >=3 and Level <4")
 8 # print(level_34)
 9 level_45 = all_data.query("Level >=4 and Level <5")
10 # print(level_45)
11 level_56 = all_data.query("Level >=5 and Level <6")
12 # print(level_56)
13 level_up_6 = all_data.query("Level >=6")
14 # print(level_up_6)
15
16 # result
17 print("1~2级震级占比为:", len(level_12))
18 print("2~3级震级占比为:", len(level_23))
19 print("3~4级震级占比为:", len(level_34))
20 print("4~5级震级占比为:", len(level_45))
21 print("5~6级震级占比为:", len(level_56))
22 print("6级及以上震级占比为:", len(level_up_6))
 1 # 导入绘图库
 2 import matplotlib.pyplot as plit
 3 # 设置中文字体
 4 plt.rcParams['font.family']=['SimHei']
 5 # 各种震级列表
 6 level = ['"1~2级','2~3级','3~4级','4~5级','5~6级','6级以上']
 7 # 各种震级所占数量列表
 8 slices= [14,544,3222,981,1250,729]
 9 # 绘制饼状图
10 plt.pie(slices, labels=level,shadow=True,explode=[0,0,0.1,0,0,0])
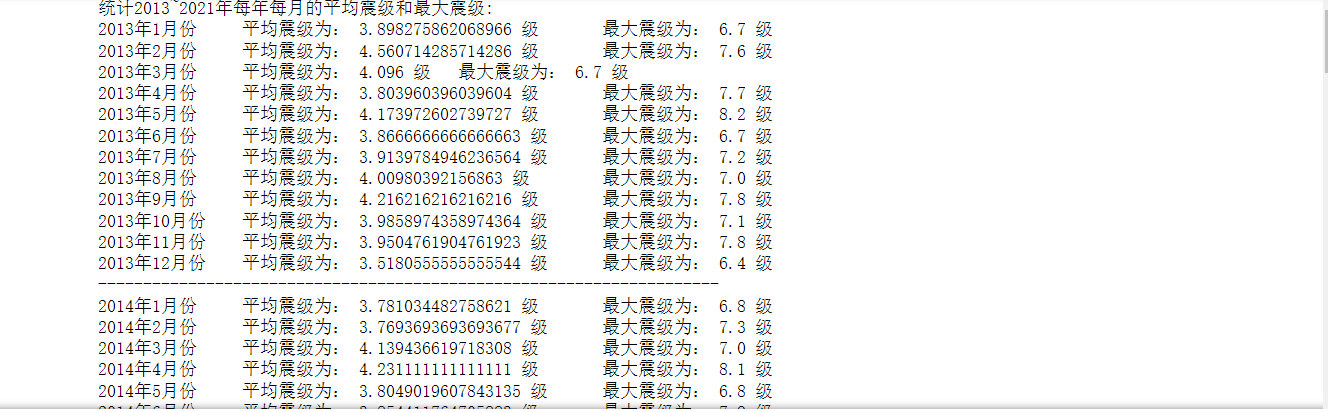
 1 # 统计2013~2021年每年每月的平均震级和最大震级
 2 print('统计2013~2021年每年每月的平均震级和最大震级:')
 3 for j in range(2013, 2022):
 4     data_year = all_data.query("Year == {}".format(j))
 5     for i in range(1, 13):
 6         average_level = data_year.query("Month == {}".format(i))['Level'].mean()
 7         max_level = data_year.query("Month == {}".format(i))['Level'].max()
 8         print("{}年".format(j) + str(i) + "月份\t" + "平均震级为:", str(average_level),
 9               "级\t" + "最大震级为:", str(max_level), "级")
10     print("---------------------------------------------------------------------")
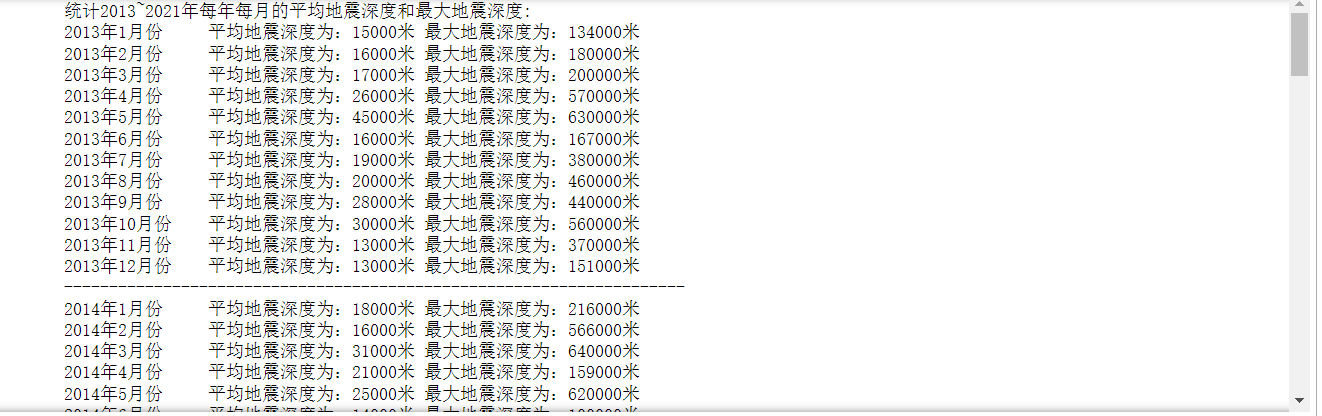
 1 # 统计2013~2021年每年每月的平均地震深度和最大地震深度
 2 print('统计2013~2021年每年每月的平均地震深度和最大地震深度:')
 3 for j in range(2013, 2022):
 4     data_year = all_data.query("Year == {}".format(j))
 5     for i in range(1, 13):
 6         average_level = data_year.query("Month == {}".format(i))['Depth'].mean()
 7         max_level = data_year.query("Month == {}".format(i))['Depth'].max()
 8         print("{}年".format(j) + str(i) + "月份\t" + "平均地震深度为:"+ str(int(average_level)*1000)+"米\t"
 9               + "最大地震深度为:"+ str(int(max_level)*1000)+"米")
10     print("---------------------------------------------------------------------")
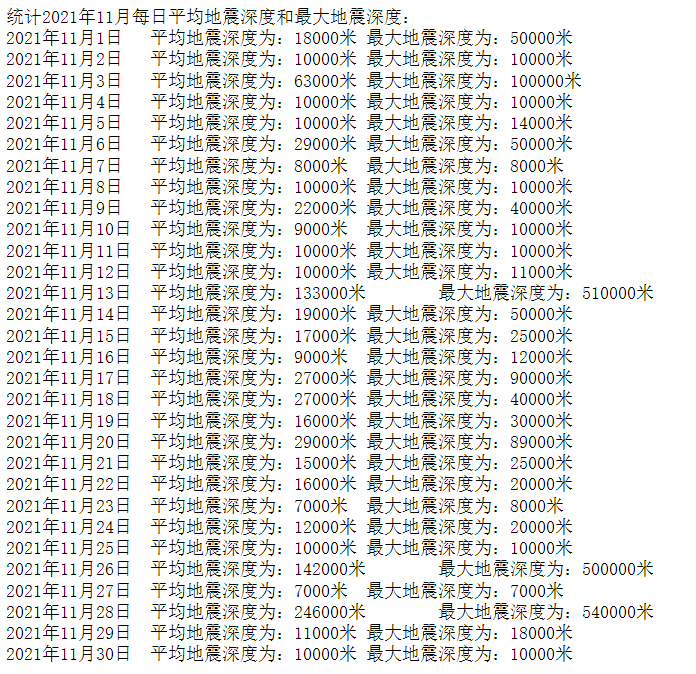
1 # 尝试
2 print("统计2021年11月每日平均地震深度和最大地震深度:")
3 data_2021_11 = all_data.query("Year == 2021 and Month == 11")
4 for i in range(1, 31):
5     average_level = data_2021_11.query("Day == {}".format(i))['Depth'].mean()
6     max_level = data_2021_11.query("Day == {}".format(i))['Depth'].max()
7     print("2021年11月" + str(i) + "日\t平均地震深度为:" + str(int(average_level)*1000) + "米\t"
8           + "最大地震深度为:" + str(int(max_level)*1000) + "米")
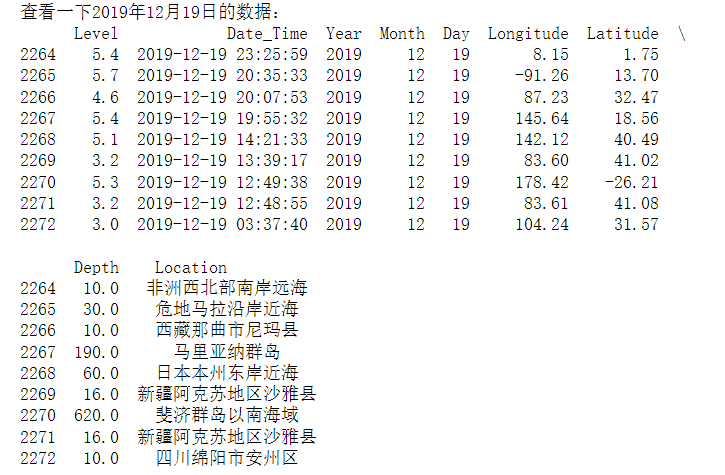
1 # 其中有一天数据比较离谱,查一下发现没错
2 print('查看一下2019年12月19日的数据:')
3 data_2019_12_19 = all_data.query("Year == 2019 and Month ==12 and Day == 19")
4 print(data_2019_12_19)
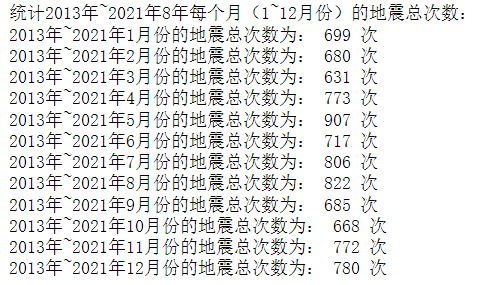
1 # 统计2013年~2021年7年每个月(1~12月份)的地震总次数
2 print("统计2013年~2021年8年每个月(1~12月份)的地震总次数:")
3 for i in range(1, 13):
4     month_data = all_data.query("Month == {}".format(i))
5     print("2013年~2021年" + str(i) + "月份的地震总次数为:", len(month_data), "次")
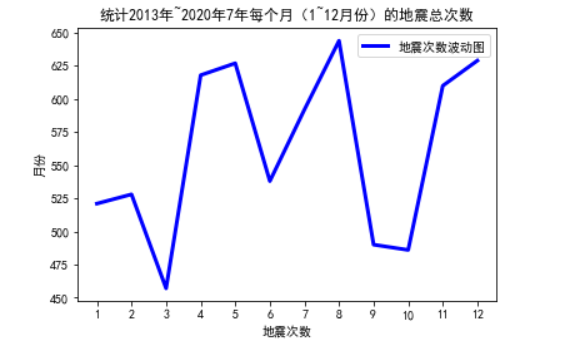
 1 # 导入绘图库
 2 import matplotlib.pyplot as plit
 3 # 设置中文字体
 4 plt.rcParams['font.family']=['SimHei']
 5 # x轴坐标数据
 6 x = ['1','2','3','4','5','6','7','8','9','10','11','12']
 7 # y轴坐标数据
 8 y = [521,528,457,618,627,538,592,644,490,486,610,629]
 9 # 绘制线段
10 plt.plot(x,y,'b',label='地震次数波动图',linewidth=3)
11 # 设置标题
12 plt.title('统计2013年~2021年7年每个月(1~12月份)的地震总次数')
13 # 添加y轴标题
14 plt.ylabel('月份')
15 # 添加x轴标题
16 plt.xlabel('地震次数')
17 # 设置图例
18 plt.legend()
19 # 显示图片
20 plt.show()
1 # 统计每年地震总次数以及每年每月份的地震总次数
2 print("统计每年地震总次数以及每年每月份的地震总次数")
3 for j in range(2013, 2022):
4     data_year = all_data.query("Year == {}".format(j))
5     print("{}年总共地震次数为:".format(j), len(data_year), "次")
6     for i in range(1, 13):
7         data_month = data_year.query("Year == {} and Month == {}".format(j, i))
8         print("{}年".format(j) + str(i) + "月份的地震次数为:", len(data_month), "次")
9     print("---------------------------------------------")

1 # 统计平均每年地震次数
2 print('统计平均每年地震次数')
3 earthquake_times = 0
4 for i in range(2013, 2022):
5     every_year = all_data.query("Year == {}".format(i))
6     earthquake_times += len(every_year)
7 earthquake_average_times = earthquake_times / 7
8 print("平均每年地震次数:" + str(round(earthquake_average_times)) + "次")

 1 # 导入需要的库
 2 import codecs  # 解码库
 3 import collections  # 词频统计库
 4 import csv  # 读取csv格式和写入csv表格数据
 5 import re  # 正则表达式库
 6
 7 import jieba  # 中文分词
 8 import matplotlib.pyplot as plt  # 图像展示库
 9 import numpy as np  # numpy数据处理库
10 import pandas as pd  # 数据分析库
11 import wordcloud  # 词云展示库
12 from PIL import Image  # 图像处理库
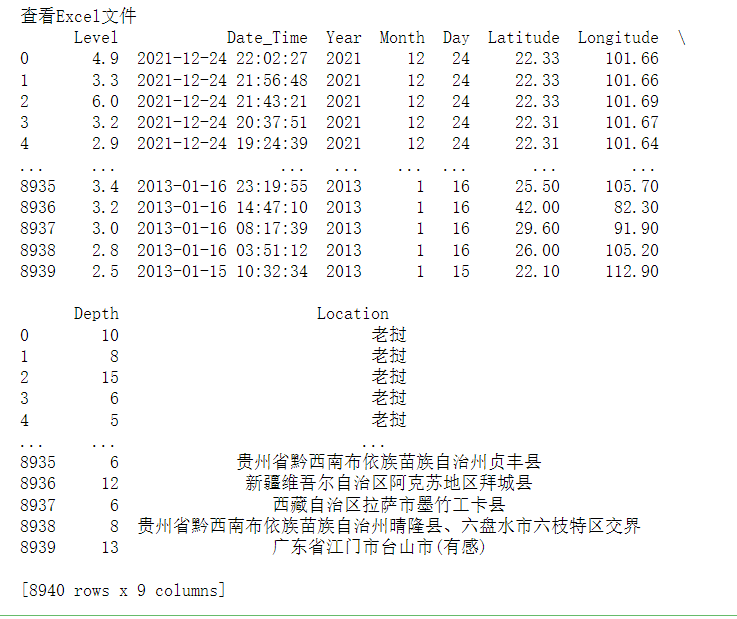
1 data = pd.read_excel('./earthquakeData.xlsx')  # 读取Excel文件
2 print('查看Excel文件')
3 print(data)
1 # 这是为了得到数据中的字符串
2 data_str = ''
3 # 数据有多少条就取多少条
4 for i in data.index:
5     # 取出每一条的地震位置
6     location = data.at[i, 'Location']
7     # 得到地震位置的字符串
8     data_str += location + "\n"
 1 # 设置停用词
 2 # 空集合用来存放停用词
 3 stopwords = set()
 4 # stopwords.txt里包括了:中文停用词表、哈工大停用词表、百度停用词表、四川大学机器智能实验室停用词库
 5 # codecs是一个解码库,文件读尽量用codecs.open方法,一般不会出现编码的问题
 6 stopw = codecs.open(r'./stopwords.txt', 'r', 'utf-8')
 7 for word in stopw:
 8     # 把每一个停用词转换成字符串并且去掉空格,然后添加到停用词的集合中
 9     stopwords.add(str(word).strip())
10 # 关闭文件
11 stopw.close()
 1 # 地震位置的词频统计和词云制作
 2 # 定义正则表达式匹配模式
 3 pattern = re.compile(u'\t|\n|\.|-|:|;|\)|\(|\?|"|\d|\W')
 4 # 将符合模式的字符去除,得到纯文字
 5 string_data = re.sub(pattern, '', data_str)
 6 # 文本分词:精确模式分词
 7 seg_list_exact = jieba.cut(string_data, cut_all=False)
 8 # 用来存放非停用词,以便于做词频统计和词云
 9 object_list = []
10 # 循环读出每个分词
11 for word in seg_list_exact:
12      # 如果不在要去除的停用词库中
13     if word not in stopwords:
14         # 分词追加到列表
15         object_list.append(word)
16 # 用collections.Counter()对分词做词频统计
17 word_counts = collections.Counter(object_list)
18 # 获取前20最高频的词,most_common()来实现Top n功能
19 word_counts_top20 = word_counts.most_common(20)
20 # 输出检查
21 print(word_counts_top20)

 1 # 词频展示
 2 # mask = np.array(Image.open('./词云背景图.png'))  # 定义词频背景
 3 wc = wordcloud.WordCloud(
 4     font_path='C:/Windows/Fonts/simhei.ttf',  # 设置字体格式
 5     # mask=mask,  # 设置背景图
 6     max_words=250,  # 最多显示词数
 7     background_color='black',  # 背景颜色
 8     max_font_size=50  # 字体最大值
 9 )
10 wc.generate_from_frequencies(word_counts)  # 根据字典生成词云
11 # image_colors = wordcloud.ImageColorGenerator(mask)  # 从背景图建立颜色方案
12 # wc.recolor(color_func=image_colors)  # 将词云颜色设置为背景图方案
13 # 去除图像周围的白边
14 plt.gca().xaxis.set_major_locator(plt.NullLocator())
15 plt.gca().yaxis.set_major_locator(plt.NullLocator())
16 plt.subplots_adjust(top=1, bottom=0, left=0, right=1, hspace=0, wspace=0)
17 plt.margins(0, 0)
18 # 显示词云
19 print("多次出现的地震地区词云图:")
20 plt.imshow(wc)
21 # 关闭坐标轴
22 plt.axis('off')

全部代码
  1 import requests
  2 import pandas as pd
  3 import re
  4
  5
  6 # 获取所有的页面url
  7 def get_url():
  8     list = []
  9     for i in range(1, 448):  # 448
 10         url = "http://www.ceic.ac.cn/ajax/search?page={}&&start=2013-01-01&&end=2021-12-25&&jingdu1=&&jingdu2=&&weidu1=&&weidu2=&&height1=&&height2=&&zhenji1=&&zhenji2=&&".format(
 11             i)
 12         list.append(url)
 13     return list
 14 # 爬取所有url
 15 def crawl_data(ls):
 16     list = []
 17     for i in ls:
 18         resp = requests.get(i)
 19         list.append(resp.text)
 20     return list
 21 # 将Unicode编码转化为中文
 22 def conversion(ls):
 23     list = []
 24     for i in ls:
 25         s = eval('u"%s"' % i)
 26         list.append(s)
 27     return list
 28 # 程序主体
 29 if __name__ == '__main__':
 30     all_url = get_url()
 31     resp = crawl_data(all_url)
 32     # 通过正则抓取所有的数据
 33     Level = re.findall('"M":"(.*?)"', str(resp))  # 地震等级
 34     Date_Time = re.findall('"O_TIME":"(.*?)"', str(resp))  # 时刻
 35     Longitude = re.findall('"EPI_LON":"(.*?)"', str(resp))  # 经度
 36     Latitude = re.findall('"EPI_LAT":"(.*?)"', str(resp))  # 纬度
 37     Depth = re.findall('"EPI_DEPTH":([0-9]+)', str(resp))  # 深度
 38     Location_U = re.findall('"LOCATION_C":"(.*?)"', str(resp))  # 地址
 39     Location = conversion(conversion(conversion(Location_U)))  # 解码
 40     # 将数据转化为datafram格式
 41     df = pd.DataFrame(
 42         {'Level': Level, 'Date_Time': Date_Time, 'Longitude': Longitude, 'Latitude': Latitude, 'Depth': Depth,
 43          'Location': Location})
 44     # 将数据保存为Excel
 45     writer = pd.ExcelWriter('./earthquake.xlsx')
 46     df.to_excel(writer, columns=['Level', 'Date_Time', 'Latitude', 'Longitude', 'Depth', 'Location'], index=False,
 47                 encoding='utf-8')
 48     writer.save()
 49     print("数据保存成功!!!")
 50     print(df)
 51 earthquake=pd.DataFrame(pd.read_excel('./earthquake.xlsx'))
 52 earthquake.head()
 53 #检查是否有重复值
 54 earthquake.duplicated()
 55 #检查是否有空值
 56 print(earthquake['Depth'].isnull().value_counts())
 57 df = pd.DataFrame(pd.read_excel('./earthquake.xlsx'))
 58 print(df.head())
 59 #绘制日期与深度回归图
 60 import seaborn as sns
 61 sns.regplot(earthquake.Longitude,earthquake.Level)
 62 import matplotlib.pyplot as plt
 63 import numpy as np
 64 #画出散点图
 65 plt.rcParams['font.sans-serif'] = ['SimHei']  # 用来正常显示中文标签
 66 plt.rcParams['axes.unicode_minus'] = False  # 用来正常显示负号
 67 N=10
 68 x=np.random.rand(N)
 69 y=np.random.rand(N)
 70 size=50
 71 plt.xlabel("Level")
 72 plt.ylabel("Depth")
 73 plt.scatter(x,y,size,color='r',alpha=0.5,marker="o")
 74 #散点图  kind='reg'
 75 sns.jointplot(x="Level",y="Depth",data=earthquake,kind='reg')
 76 #  kind='hex'
 77 sns.jointplot(x="Level",y="Depth",data=earthquake,kind='hex')
 78 # kind='kde'
 79 sns.jointplot(x="Level",y="Depth",data=earthquake,kind="kde",space=0,color='g')
 80 #选择个特征变量,绘制分布图,用最小二乘法分析两个变量间的二次拟合方程和拟合曲线
 81 colnames=['Level', 'Date_Time', 'Latitude', 'Longitude', 'Depth', 'Location']
 82 df = pd.read_excel('./earthquake.xlsx',skiprows=0,names=colnames)
 83 X = df.Latitude
 84 Y = df.Level
 85 Z = df.Depth
 86 def A():
 87     plt.scatter(X,Y,color="blue",linewidth=2)
 88     plt.title("RM scatter",color="blue")
 89     plt.grid()
 90     plt.show()
 91 A()
 92 def B():
 93     plt.scatter(X,Y,color="green",linewidth=2)
 94     plt.title("redu",color="blue")
 95     plt.grid()
 96     plt.show()
 97 B()
 98 from scipy.optimize import leastsq
 99 def func(p,x):
100     a,b,c=p
101     return a*x*x+b*x+c
102 def error(p,x,y):
103     return func(p,x)-y
104 def main():
105     plt.figure(figsize=(10,6))
106     p0=[0,0,0]
107     Para = leastsq(error,p0,args=(X,Y))
108     a,b,c=Para[0]
109     print("a=",a,"b=",b,"c=",c)
110     plt.scatter(X,Y,color="blue",linewidth=2)
111     x=np.linspace(0,20,20)
112     y=a*x*x+b*x+c
113     plt.plot(x,y,color="blue",linewidth=2,)
114     plt.title("地震深度分布")
115     plt.grid()
116     plt.show()
117
118 main()
119 # 用来清洗数据DateTime
120 s = ['2021-12-22 22:33:47', '2021-12-22 21:46:16']  # 用来测试函数的数据
121 def clear_datetime(date_list):
122     # 为了拆分年月日,用来存放year、month 、day的空列表
123     year = []
124     month = []
125     day=[]
126     for s in date_list:
127         #  通过split函数简单清洗数据
128         # 清洗年数据
129         s1 = s.split('-')[0]
130         # 清洗月数据
131         s2 = s.split('-')[1]
132         # 清洗日数据
133         ss = s.split('-')[2]
134         s3 = ss.split(' ')[0]
135         # 把数据添加到列表中
136         year.append(s1)
137         month.append(s2)
138         day.append(s3)
139         # 返回三元组,元组里的每一个元素是对应年月日的列表
140     return year,month,day
141
142 s = clear_datetime(s)      # 用于测试结果
143 print('测试结果打印:')
144 s
145 # all_url = get_url()
146 # resp = crawl_data(all_url)
147 # 通过正则抓取所有的数据
148 # 地震等级
149 Level = re.findall('"M":"(.*?)"', str(resp))
150  # 时刻
151 Date_Time = re.findall('"O_TIME":"(.*?)"', str(resp))
152  # 返回的是一个三元组
153 date_result = clear_datetime(Date_Time)
154 # 元组里的每一元素是一个列表,对应年 月 日
155 Year = date_result[0]
156 Month = date_result[1]
157 Day = date_result[2]
158 # 经度
159 Longitude = re.findall('"EPI_LON":"(.*?)"', str(resp))
160 # 纬度
161 Latitude = re.findall('"EPI_LAT":"(.*?)"', str(resp))
162  # 深度
163 Depth = re.findall('"EPI_DEPTH":([0-9]+)', str(resp))
164  # 地址
165 Location_U = re.findall('"LOCATION_C":"(.*?)"', str(resp))
166 # 解码
167 Location = conversion(conversion(conversion(Location_U)))
168 # 将数据转化为datafram格式
169 df1 = pd.DataFrame(
170     {'Level': Level, 'Date_Time': Date_Time,'Year': Year,'Month': Month,'Day': Day,
171      'Longitude': Longitude, 'Latitude': Latitude, 'Depth': Depth, 'Location': Location})
172 # 将数据保存为Excel
173 # 清洗后的数据增加了年月日字段
174 writer = pd.ExcelWriter('./earthquakeData.xlsx')
175 df1.to_excel(writer, columns=['Level', 'Date_Time', 'Year', 'Month', 'Day', 'Latitude', 'Longitude', 'Depth', 'Location'], index=False,
176             encoding='utf-8')
177 writer.save()
178 print("清洗后数据保存成功!!!")
179 print(df)
180 # 对爬取的数据进行类型转换,为后面做比较做准备
181 # 毕竟下载下来的数据是字符串类型,所以要转换为float类型和int类型
182 # 把震级数据改成float浮点类型
183 df1['Level'] = df1['Level'].astype('float')
184 # 把年数据改成int整数类型
185 df1['Year'] = df1['Year'].astype('int')
186 # 把月数据改成int整数类型
187 df1['Month'] = df1['Month'].astype('int')
188 # 把日数据改成int整数类型
189 df1['Day'] = df1['Day'].astype('int')
190 # 把经度数据改成float浮点类型
191 df1['Latitude'] = df1['Latitude'].astype('float')
192 # 把维度数据改成float浮点类型
193 df1['Longitude'] = df1['Longitude'].astype('float')
194 # 把地震深度数据改成float浮点类型
195 df1['Depth'] = df1['Depth'].astype('float')
196 # 查看数据列类型
197 print('清洗好的字段数据类型为:')
198 df1.dtypes
199 all_data = df1
200 # 统计2013~2021年的震级分布占比
201 level_12 = all_data.query("Level >=1 and Level <2")
202 # print(level_12)
203 level_23 = all_data.query("Level >=2 and Level <3")
204 # print(level_23)
205 level_34 = all_data.query("Level >=3 and Level <4")
206 # print(level_34)
207 level_45 = all_data.query("Level >=4 and Level <5")
208 # print(level_45)
209 level_56 = all_data.query("Level >=5 and Level <6")
210 # print(level_56)
211 level_up_6 = all_data.query("Level >=6")
212 # print(level_up_6)
213
214 # result
215 print("1~2级震级占比为:", len(level_12))
216 print("2~3级震级占比为:", len(level_23))
217 print("3~4级震级占比为:", len(level_34))
218 print("4~5级震级占比为:", len(level_45))
219 print("5~6级震级占比为:", len(level_56))
220 print("6级及以上震级占比为:", len(level_up_6))
221 # 导入绘图库
222 import matplotlib.pyplot as plit
223 # 设置中文字体
224 plt.rcParams['font.family']=['SimHei']
225 # 各种震级列表
226 level = ['"1~2级','2~3级','3~4级','4~5级','5~6级','6级以上']
227 # 各种震级所占数量列表
228 slices= [14,544,3222,981,1250,729]
229 # 绘制饼状图
230 plt.pie(slices, labels=level,shadow=True,explode=[0,0,0.1,0,0,0])
231 # 统计2013~2021年每年每月的平均震级和最大震级
232 print('统计2013~2021年每年每月的平均震级和最大震级:')
233 for j in range(2013, 2022):
234     data_year = all_data.query("Year == {}".format(j))
235     for i in range(1, 13):
236         average_level = data_year.query("Month == {}".format(i))['Level'].mean()
237         max_level = data_year.query("Month == {}".format(i))['Level'].max()
238         print("{}年".format(j) + str(i) + "月份\t" + "平均震级为:", str(average_level),
239               "级\t" + "最大震级为:", str(max_level), "级")
240     print("---------------------------------------------------------------------")
241 # 统计2013~2021年每年每月的平均地震深度和最大地震深度
242 print('统计2013~2021年每年每月的平均地震深度和最大地震深度:')
243 for j in range(2013, 2022):
244     data_year = all_data.query("Year == {}".format(j))
245     for i in range(1, 13):
246         average_level = data_year.query("Month == {}".format(i))['Depth'].mean()
247         max_level = data_year.query("Month == {}".format(i))['Depth'].max()
248         print("{}年".format(j) + str(i) + "月份\t" + "平均地震深度为:"+ str(int(average_level)*1000)+"米\t"
249               + "最大地震深度为:"+ str(int(max_level)*1000)+"米")
250     print("---------------------------------------------------------------------")
251 # 尝试
252 print("统计2021年11月每日平均地震深度和最大地震深度:")
253 data_2021_11 = all_data.query("Year == 2021 and Month == 11")
254 for i in range(1, 31):
255     average_level = data_2021_11.query("Day == {}".format(i))['Depth'].mean()
256     max_level = data_2021_11.query("Day == {}".format(i))['Depth'].max()
257     print("2021年11月" + str(i) + "日\t平均地震深度为:" + str(int(average_level)*1000) + "米\t"
258           + "最大地震深度为:" + str(int(max_level)*1000) + "米")
259 # 其中有一天数据比较离谱,查一下发现没错
260 print('查看一下2019年12月19日的数据:')
261 data_2019_12_19 = all_data.query("Year == 2019 and Month ==12 and Day == 19")
262 print(data_2019_12_19)
263 # 统计2013年~2021年7年每个月(1~12月份)的地震总次数
264 print("统计2013年~2021年8年每个月(1~12月份)的地震总次数:")
265 for i in range(1, 13):
266     month_data = all_data.query("Month == {}".format(i))
267     print("2013年~2021年" + str(i) + "月份的地震总次数为:", len(month_data), "次")
268 # 导入绘图库
269 import matplotlib.pyplot as plit
270 # 设置中文字体
271 plt.rcParams['font.family']=['SimHei']
272 # x轴坐标数据
273 x = ['1','2','3','4','5','6','7','8','9','10','11','12']
274 # y轴坐标数据
275 y = [521,528,457,618,627,538,592,644,490,486,610,629]
276 # 绘制线段
277 plt.plot(x,y,'b',label='地震次数波动图',linewidth=3)
278 # 设置标题
279 plt.title('统计2013年~2021年7年每个月(1~12月份)的地震总次数')
280 # 添加y轴标题
281 plt.ylabel('月份')
282 # 添加x轴标题
283 plt.xlabel('地震次数')
284 # 设置图例
285 plt.legend()
286 # 显示图片
287 plt.show()
288 # 统计每年地震总次数以及每年每月份的地震总次数
289 print("统计每年地震总次数以及每年每月份的地震总次数")
290 for j in range(2013, 2022):
291     data_year = all_data.query("Year == {}".format(j))
292     print("{}年总共地震次数为:".format(j), len(data_year), "次")
293     for i in range(1, 13):
294         data_month = data_year.query("Year == {} and Month == {}".format(j, i))
295         print("{}年".format(j) + str(i) + "月份的地震次数为:", len(data_month), "次")
296     print("---------------------------------------------")
297 # 统计平均每年地震次数
298 print('统计平均每年地震次数')
299 earthquake_times = 0
300 for i in range(2013, 2022):
301     every_year = all_data.query("Year == {}".format(i))
302     earthquake_times += len(every_year)
303 earthquake_average_times = earthquake_times / 7
304 print("平均每年地震次数:" + str(round(earthquake_average_times)) + "次")
305 # 导入需要的库
306 import codecs  # 解码库
307 import collections  # 词频统计库
308 import csv  # 读取csv格式和写入csv表格数据
309 import re  # 正则表达式库
310
311 import jieba  # 中文分词
312 import matplotlib.pyplot as plt  # 图像展示库
313 import numpy as np  # numpy数据处理库
314 import pandas as pd  # 数据分析库
315 import wordcloud  # 词云展示库
316 from PIL import Image  # 图像处理库
317 data = pd.read_excel('./earthquakeData.xlsx')  # 读取Excel文件
318 print('查看Excel文件')
319 print(data)
320 # 这是为了得到数据中的字符串
321 data_str = ''
322 # 数据有多少条就取多少条
323 for i in data.index:
324     # 取出每一条的地震位置
325     location = data.at[i, 'Location']
326     # 得到地震位置的字符串
327     data_str += location + "\n"
328 # 设置停用词
329 # 空集合用来存放停用词
330 stopwords = set()
331 # stopwords.txt里包括了:中文停用词表、哈工大停用词表、百度停用词表、四川大学机器智能实验室停用词库
332 # codecs是一个解码库,文件读尽量用codecs.open方法,一般不会出现编码的问题
333 stopw = codecs.open(r'./stopwords.txt', 'r', 'utf-8')
334 for word in stopw:
335     # 把每一个停用词转换成字符串并且去掉空格,然后添加到停用词的集合中
336     stopwords.add(str(word).strip())
337 # 关闭文件
338 stopw.close()
339 # 地震位置的词频统计和词云制作
340 # 定义正则表达式匹配模式
341 pattern = re.compile(u'\t|\n|\.|-|:|;|\)|\(|\?|"|\d|\W')
342 # 将符合模式的字符去除,得到纯文字
343 string_data = re.sub(pattern, '', data_str)
344 # 文本分词:精确模式分词
345 seg_list_exact = jieba.cut(string_data, cut_all=False)
346 # 用来存放非停用词,以便于做词频统计和词云
347 object_list = []
348 # 循环读出每个分词
349 for word in seg_list_exact:
350      # 如果不在要去除的停用词库中
351     if word not in stopwords:
352         # 分词追加到列表
353         object_list.append(word)
354 # 用collections.Counter()对分词做词频统计
355 word_counts = collections.Counter(object_list)
356 # 获取前20最高频的词,most_common()来实现Top n功能
357 word_counts_top20 = word_counts.most_common(20)
358 # 输出检查
359 print(word_counts_top20)
360 # 词频展示
361 # mask = np.array(Image.open('./词云背景图.png'))  # 定义词频背景
362 wc = wordcloud.WordCloud(
363     font_path='C:/Windows/Fonts/simhei.ttf',  # 设置字体格式
364     # mask=mask,  # 设置背景图
365     max_words=250,  # 最多显示词数
366     background_color='black',  # 背景颜色
367     max_font_size=50  # 字体最大值
368 )
369 wc.generate_from_frequencies(word_counts)  # 根据字典生成词云
370 # image_colors = wordcloud.ImageColorGenerator(mask)  # 从背景图建立颜色方案
371 # wc.recolor(color_func=image_colors)  # 将词云颜色设置为背景图方案
372 # 去除图像周围的白边
373 plt.gca().xaxis.set_major_locator(plt.NullLocator())
374 plt.gca().yaxis.set_major_locator(plt.NullLocator())
375 plt.subplots_adjust(top=1, bottom=0, left=0, right=1, hspace=0, wspace=0)
376 plt.margins(0, 0)
377 # 显示词云
378 print("多次出现的地震地区词云图:")
379 plt.imshow(wc)
380 # 关闭坐标轴
381 plt.axis('off')
(五)总结
通过这次爬取中国地震网可以知道,地震震级频率最高的是3到4级,六级的相对来说比较少,并且新疆地震频率相对来说比较高
在编写代码的过程中,python相对于其他编程来说更明了,爬取的年份比较多,得出来数据很杂,可视化也比较繁杂。编程这门语言,需要不断地动手敲打,才能熟能生巧,通过上机来编程来判断自己是否正确,完成编程的编写不一定万事大吉,只能靠自己的上机经验来分析判断错误的所在,通过这次的设计,只要努力,任何东西都不会太难。

 浙公网安备 33010602011771号