
EChats使用报错之 《"TypeError: Cannot read property 'getAttribute' of undefined"》
echats重新加载重绘问题:页面刷新时图表无法加载
解决办法:将图标EChats 单独抽出来作为公共组件
在src下的components中新建一个文件夹为echats,存放图表文件
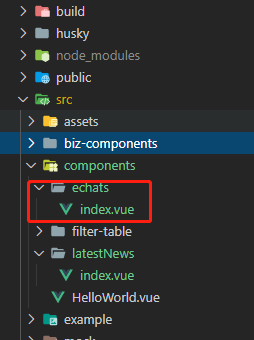
echats/index.vue 内容如下(此处为静态数据,还未使用动态数据,只是举个例子,实际使用场景随需求而定)
<template lang="pug">
.aum AUM: 23,000,000 HKD (approximate)
div(id="myEchart"
ref="myEchart")
</template>
<script>
export default {
data() {
return {
chart: ''
}
},
mounted() {
let self = this
this.$nextTick(() => {
self.initChart()
})
},
methods: {
initChart() {
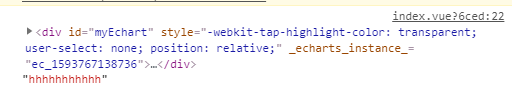
console.log(this.$refs.myEchart, 'hhhhhhhhhhh')
this.chart = this.$echarts.init(this.$refs.myEchart)
// 把配置和数据放这里
this.chart.setOption({
backgroundColor: '', //背景颜色透明
color: '#1E93F3',
tooltip: {
trigger: 'axis',
axisPointer: {
type: 'cross',
crossStyle: {
color: '#999'
}
}
},
grid: {
//统计图距离边缘的距离
top: '14%',
left: '10%',
right: '10%',
bottom: '14%'
},
xAxis: [
{
type: 'category',
axisTick: {
//y轴刻度线
show: false
},
axisLine: {
symbol: ['none', 'arrow'],
symbolOffset: [0, 4],
lineStyle: { color: '#707070' }
},
data: [
'Jan',
'Feb',
'Mar',
'Apr',
'May',
'Jun',
'Jul',
'Aug',
'Sep',
'Oct',
'Nov',
'Dec'
],
axisPointer: {
type: 'shadow'
}
}
],
yAxis: {
// show: true,
type: 'value',
splitLine: { show: false }, //去除网格线
axisTick: {
//y轴刻度线
show: false
},
axisLine: {
symbol: ['none', 'arrow'],
symbolOffset: [0, 4],
lineStyle: { color: '#707070' }
}
},
series: [
{
name: '降水量',
type: 'line',
lineStyle: {
//线条的相关设置
normal: {
color: '#1E93F3' // 线条颜色
}
},
areaStyle: {
color: new this.$echarts.graphic.LinearGradient(
0,
0,
0,
1,
[
{
offset: 0,
color: 'rgba(30,147,243,0.3)'
},
{ offset: 0.8, color: 'rgba(30,147,243,0)' }
]
)
},
data: [
2.6,
5.9,
9.0,
26.4,
28.7,
70.7,
175.6,
182.2,
48.7,
18.8,
6.0,
2.3
]
}
]
})
}
}
}
</script>
<style lang="scss">
.aum {
padding: 15px 0 0 22px;
font-size: 16px;
font-family: Futura-Bold, Futura;
font-weight: bold;
color: rgba(34, 34, 34, 1);
#myEchart {
width: 100%;
height: 320px;
}
}
</style>
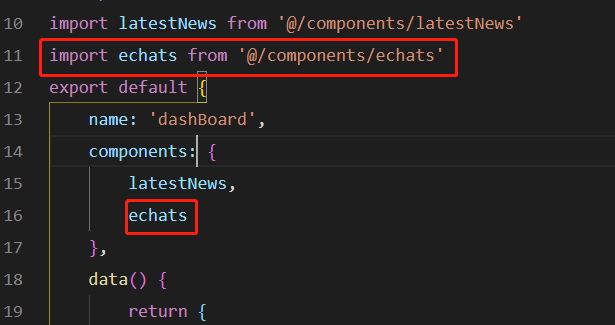
在父组件中引用
import echats from '@/components/echats'
最后问题解决,没有报错

 浙公网安备 33010602011771号