


kube-prometheus监控服务发现 - 教程
首次看到kube-prometheus的manifests可能会被吓到,太多yaml配置了,根本不知道从何处入手
alertmanager-alertmanager.yaml
nodeExporter-daemonset.yaml
alertmanager-networkPolicy.yaml
nodeExporter-networkPolicy.yaml
alertmanager-podDisruptionBudget.yaml
nodeExporter-prometheusRule.yaml
alertmanager-prometheusRule.yaml
nodeExporter-serviceAccount.yaml
alertmanager-secret.yaml
nodeExporter-serviceMonitor.yaml
alertmanager-serviceAccount.yaml
nodeExporter-service.yaml
alertmanager-serviceMonitor.yaml                                 prometheusAdapter-apiService.yaml
alertmanager-service.yaml                                        prometheusAdapter-clusterRoleAggregatedMetricsReader.yaml
blackboxExporter-clusterRoleBinding.yaml                         prometheusAdapter-clusterRoleBindingDelegator.yaml
blackboxExporter-clusterRole.yaml                                prometheusAdapter-clusterRoleBinding.yaml
blackboxExporter-configuration.yaml                              prometheusAdapter-clusterRoleServerResources.yaml
blackboxExporter-deployment.yaml                                 prometheusAdapter-clusterRole.yaml
blackboxExporter-networkPolicy.yaml                              prometheusAdapter-configMap.yaml
blackboxExporter-serviceAccount.yaml                             prometheusAdapter-deployment.yaml
blackboxExporter-serviceMonitor.yaml                             prometheusAdapter-networkPolicy.yaml
blackboxExporter-service.yaml                                    prometheusAdapter-podDisruptionBudget.yaml
grafana-config.yaml                                              prometheusAdapter-roleBindingAuthReader.yaml
grafana-dashboardDatasources.yaml                                prometheusAdapter-serviceAccount.yaml
grafana-dashboardDefinitions.yaml                                prometheusAdapter-serviceMonitor.yaml
grafana-dashboardSources.yaml                                    prometheusAdapter-service.yaml
grafana-deployment.yaml
prometheus-clusterRoleBinding.yaml
grafana-networkPolicy.yaml
prometheus-clusterRole.yaml
grafana-prometheusRule.yaml
prometheus-networkPolicy.yaml
grafana-serviceAccount.yaml                                      prometheusOperator-clusterRoleBinding.yaml
grafana-serviceMonitor.yaml                                      prometheusOperator-clusterRole.yaml
grafana-service.yaml                                             prometheusOperator-deployment.yaml
kubePrometheus-prometheusRule.yaml                               prometheusOperator-networkPolicy.yaml
kubernetesControlPlane-prometheusRule.yaml                       prometheusOperator-prometheusRule.yaml
kubernetesControlPlane-serviceMonitorApiserver.yaml              prometheusOperator-serviceAccount.yaml
kubernetesControlPlane-serviceMonitorCoreDNS.yaml                prometheusOperator-serviceMonitor.yaml
kubernetesControlPlane-serviceMonitorKubeControllerManager.yaml  prometheusOperator-service.yaml
kubernetesControlPlane-serviceMonitorKubelet.yaml
prometheus-podDisruptionBudget.yaml
kubernetesControlPlane-serviceMonitorKubeScheduler.yaml
prometheus-prometheusRule.yaml
kubeStateMetrics-clusterRoleBinding.yaml
prometheus-prometheus.yaml
kubeStateMetrics-clusterRole.yaml
prometheus-roleBindingConfig.yaml
kubeStateMetrics-deployment.yaml
prometheus-roleBindingSpecificNamespaces.yaml
kubeStateMetrics-networkPolicy.yaml
prometheus-roleConfig.yaml
kubeStateMetrics-prometheusRule.yaml
prometheus-roleSpecificNamespaces.yaml
kubeStateMetrics-serviceAccount.yaml
prometheus-serviceAccount.yaml
kubeStateMetrics-serviceMonitor.yaml
prometheus-serviceMonitor.yaml
kubeStateMetrics-service.yaml
prometheus-service.yaml
nodeExporter-clusterRoleBinding.yaml
setup
nodeExporter-clusterRole.yaml
不过经过仔细观察,你会发现这些文件都是不同类型文件的重复,有以下几种类型的资源
- service/ServiceAccount
- clusterrole
- deployment/DaemonSet
- prometheus
- prometheusRule
- ClusterRole/ClusterRoleBinding
- Role/RoleBinding
- Secret/ConfigMap
- ServiceMonitor/PodMonitor
等
而服务发现就需要用到了ServiceMonitor/PodMonitor
服务发现
kube-prometheus 本身不直接进行服务发现,而是通过其核心组件 Prometheus 和 Prometheus Operator,结合 Kubernetes 原生机制,实现自动化的、声明式的服务发现(Service Discovery)。
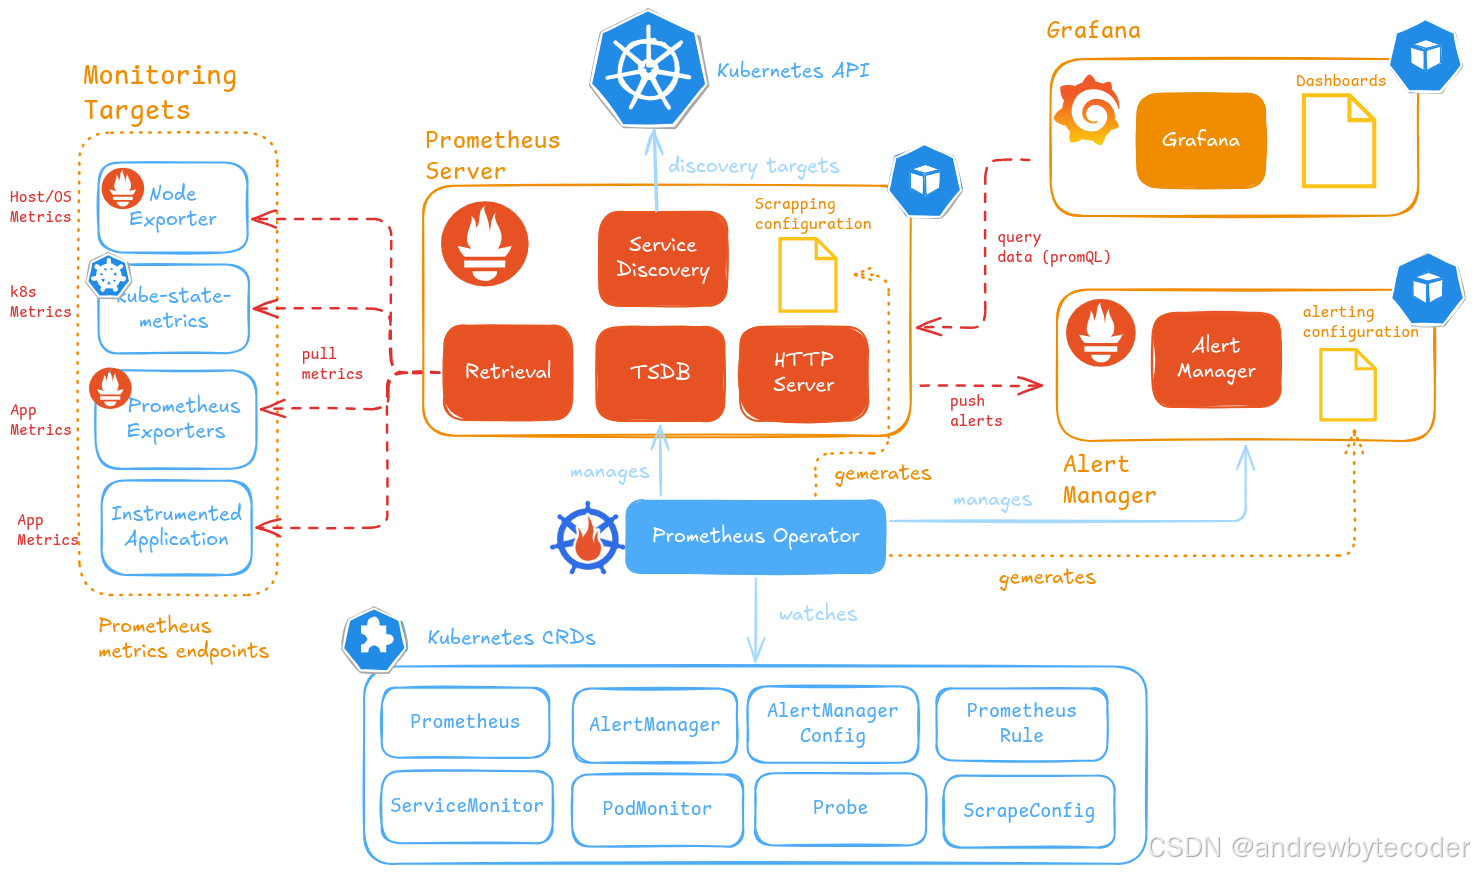
从上图可以看出,kube-prometheus 使用 Custom Resource Definitions (CRDs) 来定义“监控目标”,并通过 Prometheus Operator 将这些 CR 转换为 Prometheus 的实际抓取配置。
三大发现机制
| CRD | 作用 | 发现对象 |
|---|---|---|
ServiceMonitor | 基于 Kubernetes Service 发现目标 | Service 后端的 Pod |
PodMonitor | 直接基于 Pod 发现目标 | 特定标签的 Pod |
Probe | 基于静态列表或 Blackbox 探测 | 外部 HTTP/HTTPS/TCP 端点 |
1. ServiceMonitor:最常用的服务发现方式
原理
- 定义一个
ServiceMonitor,指定要监控的Service的标签选择器(selector) - Prometheus Operator 监听
ServiceMonitor资源 - Operator 查询 Kubernetes API,找到所有匹配标签的
Service - 对每个
Service,获取其后端Pods的 IP 和端口 - 生成 Prometheus 的
scrape_configs,自动添加这些 Pod 为监控目标
以grafana的 ServiceMonitor为例
# 指定api组 monitoring.coreos.com 以及版本 v1
apiVersion: monitoring.coreos.com/v1
kind: ServiceMonitor
metadata:
labels:
# 使用 Kubernetes 应用推荐标签,便于组织和筛选资源
app.kubernetes.io/component: grafana  # 标识资源名称
app.kubernetes.io/name: grafana # 标识组件类型
app.kubernetes.io/part-of: kube-prometheus  # 表明它是 `kube-prometheus` 项目的一部分
app.kubernetes.io/version: 11.6.0  # 指定 Grafana 版本(用于版本追踪)
name: grafana   # 该 ServiceMonitor 的名称
# 它位于 `monitoring` 命名空间中(与 Prometheus 同处)
namespace: monitoring
spec:
endpoints:
- interval: 15s  # 抓取频率:每 15 秒从目标拉取一次指标
port: http # 指定 Service 中名为 `http` 的端口作为抓取目标
selector:
matchLabels:
# 服务选择器:表示要监控所有带有此标签的 Kubernetes Service
app.kubernetes.io/name: grafana
grafana service
apiVersion: v1
kind: Service
metadata:
labels:
app.kubernetes.io/component: grafana
app.kubernetes.io/name: grafana  # 这个标签必须有,否则ServiceMonitor将绑定失败
app.kubernetes.io/part-of: kube-prometheus
app.kubernetes.io/version: 11.6.0
name: grafana
namespace: monitoring
spec:
ports:
- name: http
port: 3000
targetPort: http
selector:
app.kubernetes.io/component: grafana
app.kubernetes.io/name: grafana
app.kubernetes.io/part-of: kube-prometheus
发现流程
✅ 只要
monitoring命名空间下有Service带有app.kubernetes.io/name: grafana标签,其后端 Pod 就会被自动监控。
2. PodMonitor:直接监控 Pod
适用场景
- 没有 Service 的 Pod(如 DaemonSet)
- 需要更细粒度控制抓取配置
- 多个端口暴露不同指标
示例
apiVersion: monitoring.coreos.com/v1
kind: PodMonitor
metadata:
name: node-exporter
namespace: monitoring
spec:
selector:
matchLabels:
app: node-exporter
podMetricsEndpoints:
- port: metrics
interval: 10s
path: /metrics
namespaceSelector:
any: true
发现流程
- Operator 查找所有带有
app: node-exporter标签的 Pod - 获取其 IP 和
metrics端口 - 配置 Prometheus 抓取
/metrics
✅ 常用于
node-exporter、kube-state-metrics等系统组件。
3. Probe:外部服务探测
适用场景
- 监控集群外部的 HTTP 服务
- Blackbox 监控(连通性、延迟)
- 静态 IP 列表
示例
apiVersion: monitoring.coreos.com/v1
kind: Probe
metadata:
name: external-https
spec:
prober:
url: blackbox-exporter.example.com
targets:
staticConfig:
static:
- https://google.com
- https://github.com
module: http_2xx
自动更新机制
- 当你创建/更新
ServiceMonitor时 - Prometheus Operator 检测到变化
- Operator 调用 Prometheus 的 Reload API(或挂载 ConfigMap)
- Prometheus 重新加载配置,无需重启
⚡ 实现了动态服务发现,新增服务自动被监控。
kube-prometheus 中预置的发现配置
kube-prometheus 默认包含多个 ServiceMonitor 和 PodMonitor,用于监控:
| 组件 | 使用的 CRD |
|---|---|
| kube-apiserver | ServiceMonitor |
| kube-scheduler | PodMonitor |
| kube-controller-manager | PodMonitor |
| kubelet | PodMonitor |
| coredns | ServiceMonitor |
| node-exporter | PodMonitor |
| kube-state-metrics | ServiceMonitor |
| Prometheus 本身 | PodMonitor |
kube-prometheus 如何做服务发现?
| 机制 | 工具 | 说明 |
|---|---|---|
| 声明式配置 | ServiceMonitor / PodMonitor | 用户通过 YAML 定义“想监控谁” |
| 控制器监听 | Prometheus Operator | 监听 CRD 变化,生成 Prometheus 配置 |
| Kubernetes API 查询 | Operator + Prometheus | 查询 Service/Pod 列表 |
| 动态配置更新 | Prometheus Reload | 无需重启,自动生效 |
| 底层支持 | Prometheus 内置 kubernetes_sd_configs | 实现基于角色的服务发现 |
kube-prometheus通过 “CRD + Operator + Kubernetes API + Prometheus SD” 四层机制,实现了对 Kubernetes 环境的全自动、动态、声明式服务发现。

 浙公网安备 33010602011771号