数据的图表统计highcharts
数据统计常用的图表一般是饼状图、柱状图、线状图,HighCharts可以很好的实现。
HighCharts
highcharts是基于jquery的一个功能强大的插件,使用时先导入jquery.js
<script type="text/javascript" src="<%=basePath%>resources/js/jquery.min.js"></script>
    <script type="text/javascript" src="<%=basePath%>resources/js/highcharts.js"></script>
然后在页面中添加一个div作为装图表的容器
<div id="container" style="width:800px;height:600px"></div>
如果在该处设置min-width,可以实现图表宽度自适应。
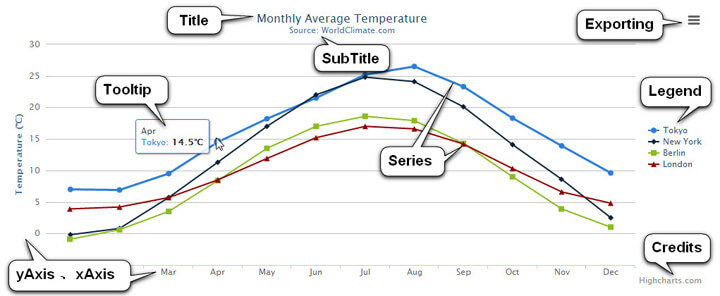
各参数的意义如下图:
一般情况下,Highcharts 包含标题(Title)、坐标轴(Axis)、数据列(Series)、数据提示框(Tooltip)、图例(Legend)、版权标签(Credits)等,另外还可以包括导出功能按钮(Exporting)、标示线(PlotLines)、标示区域(PlotBands)、数据标签(dataLabels)等。
Highcharts 基本组成部分如下图所示
柱形图:
<script language="JavaScript">
$(document).ready(function() {
   var chart = {
      type: 'column'
   };
   var title = {
      text: '每月平均降雨量'
   };
   var subtitle = {
      text: 'Source: runoob.com'
   };
   var xAxis = {
      categories: ['Jan','Feb','Mar','Apr','May','Jun','Jul','Aug','Sep','Oct','Nov','Dec'],
      crosshair: true
   };
   var yAxis = {
      min: 0,
      title: {
         text: '降雨量 (mm)'
      }
   };
   var tooltip = {
      headerFormat: '<span style="font-size:10px">{point.key}</span><table>',
      pointFormat: '<tr><td style="color:{series.color};padding:0">{series.name}: </td>' +
         '<td style="padding:0"><b>{point.y:.1f} mm</b></td></tr>',
      footerFormat: '</table>',
      shared: true,
      useHTML: true
   };
   var plotOptions = {
      column: {
         pointPadding: 0,
         borderWidth: 0
      }
   };
   var credits = {
      enabled: false
   };

   var series= [{
        name: 'Tokyo',
            data: [49.9, 71.5, 106.4, 129.2, 144.0, 176.0, 135.6, 148.5, 216.4, 194.1, 95.6, 54.4]
        }, {
            name: 'New York',
            data: [83.6, 78.8, 98.5, 93.4, 106.0, 84.5, 105.0, 104.3, 91.2, 83.5, 106.6, 92.3]
        }, {
            name: 'London',
            data: [48.9, 38.8, 39.3, 41.4, 47.0, 48.3, 59.0, 59.6, 52.4, 65.2, 59.3, 51.2]
        }, {
            name: 'Berlin',
            data: [42.4, 33.2, 34.5, 39.7, 52.6, 75.5, 57.4, 60.4, 47.6, 39.1, 46.8, 51.1]
   }];

   var json = {};
   json.chart = chart;
   json.title = title;
   json.subtitle = subtitle;
   json.tooltip = tooltip;
   json.xAxis = xAxis;
   json.yAxis = yAxis;
   json.series = series;
   json.plotOptions = plotOptions;
   json.credits = credits;
   $('#container').highcharts(json);

});
</script>
效果图:


 浙公网安备 33010602011771号