
promtheus自动监控k8s的pod
添加配置文件
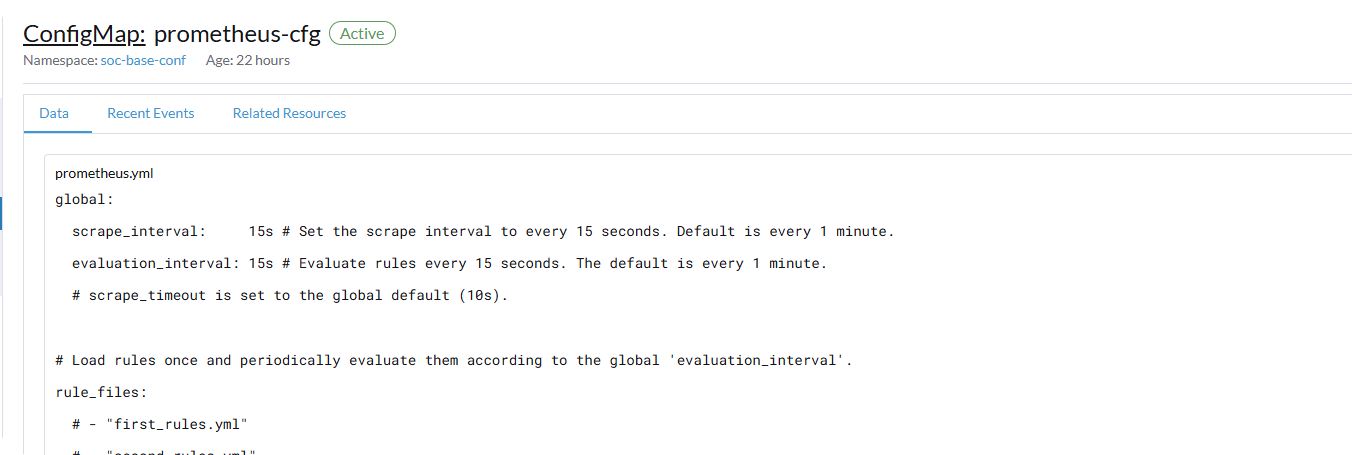


global:
  scrape_interval:     15s # Set the scrape interval to every 15 seconds. Default is every 1 minute.
  evaluation_interval: 15s # Evaluate rules every 15 seconds. The default is every 1 minute.
  # scrape_timeout is set to the global default (10s).

# Load rules once and periodically evaluate them according to the global 'evaluation_interval'.
rule_files:
  # - "first_rules.yml"
  # - "second_rules.yml"

# A scrape configuration containing exactly one endpoint to scrape:
# Here it's Prometheus itself.
scrape_configs:
  # The job name is added as a label `job=<job_name>` to any timeseries scraped from this config.
  - job_name: 'prometheus'
    static_configs:
    - targets: ['192.168.30.207:9090']
  - job_name: "kubernetes-pods"
    kubernetes_sd_configs:
      - role: pod  # 监听 Pod 资源变化
    relabel_configs:
      # 筛选含注解 prometheus.io/scrape=true 的 Pod
      - source_labels: [__meta_kubernetes_pod_annotation_prometheus_io_scrape]
        regex: "true"
        action: keep
      # 动态生成抓取地址(IP:Port)
      - source_labels: [__address__, __meta_kubernetes_pod_annotation_prometheus_io_port]
        action: replace
        regex: ([^:]+)(?::\d+)?;(\d+)
        replacement: $1:$2
        target_label: __address__
      # 自定义指标路径
      - source_labels: [__meta_kubernetes_pod_annotation_prometheus_io_path]
        target_label: __metrics_path__
        regex: (.+)
        replacement: $1
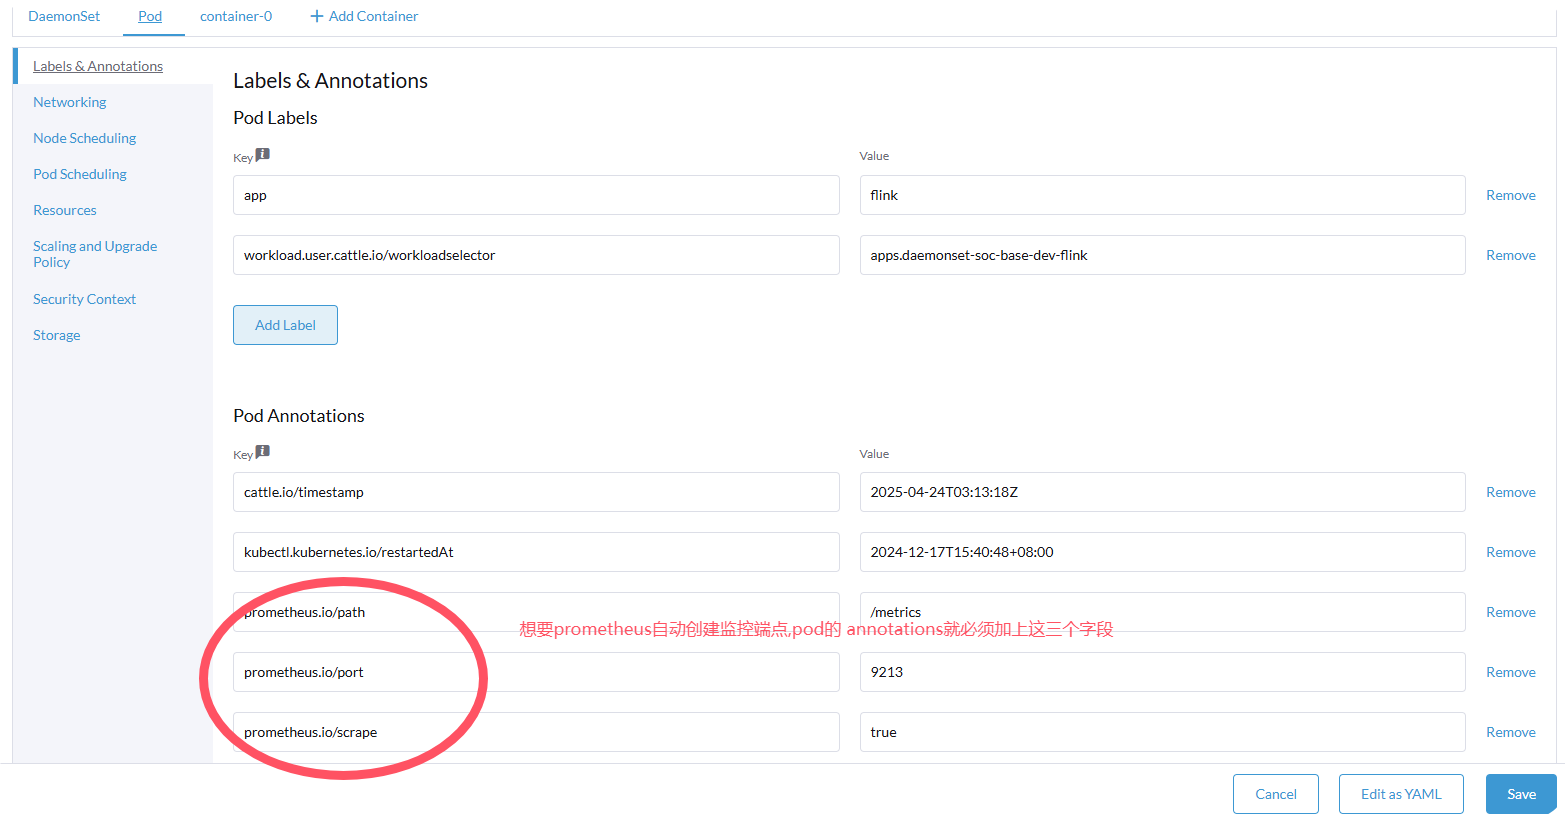
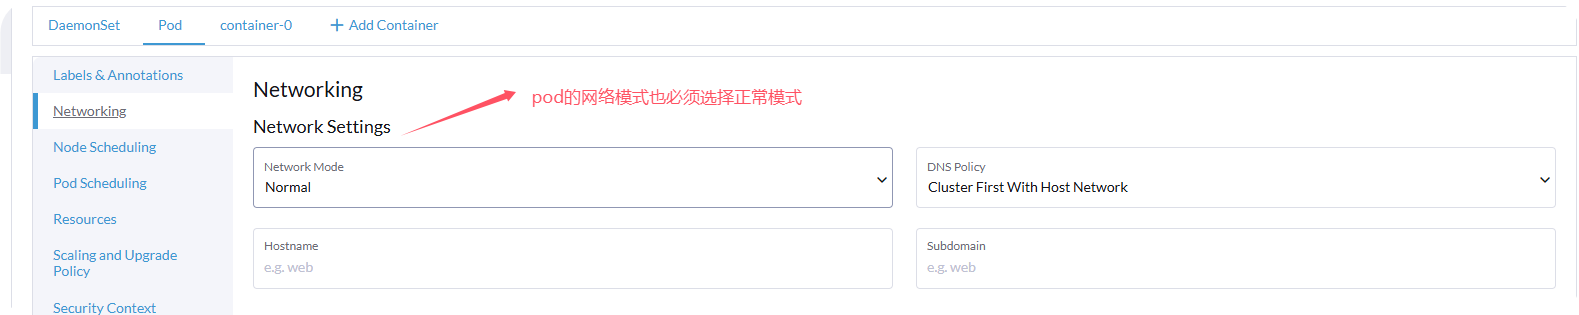
服务pod的注释配置

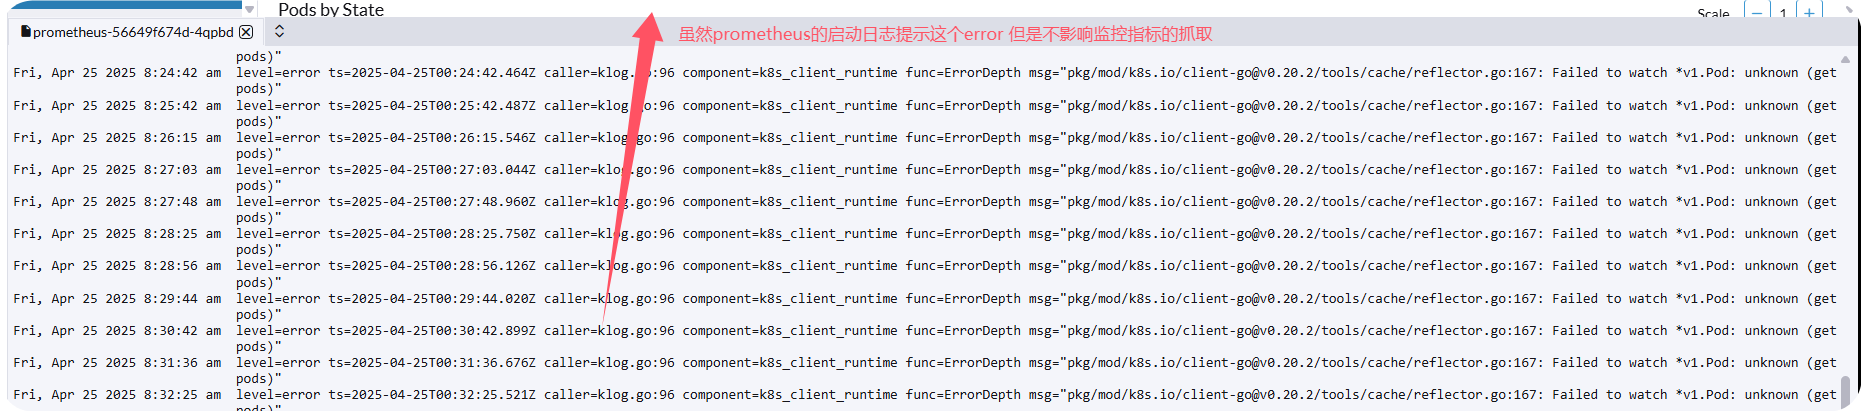
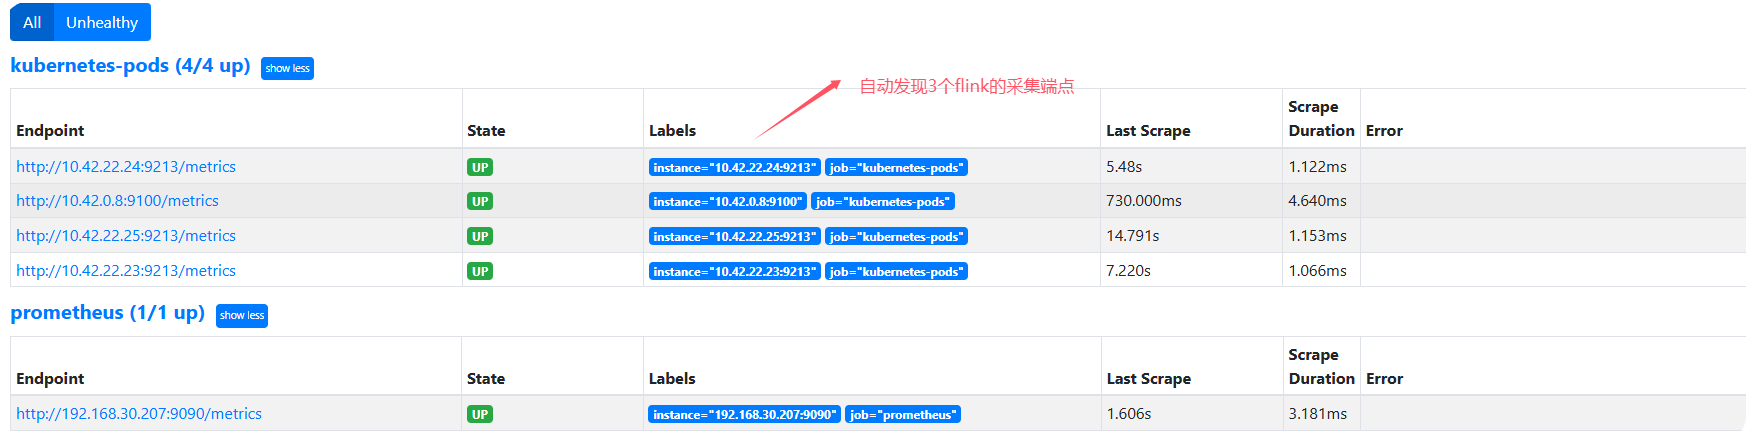
查看监控指标数据
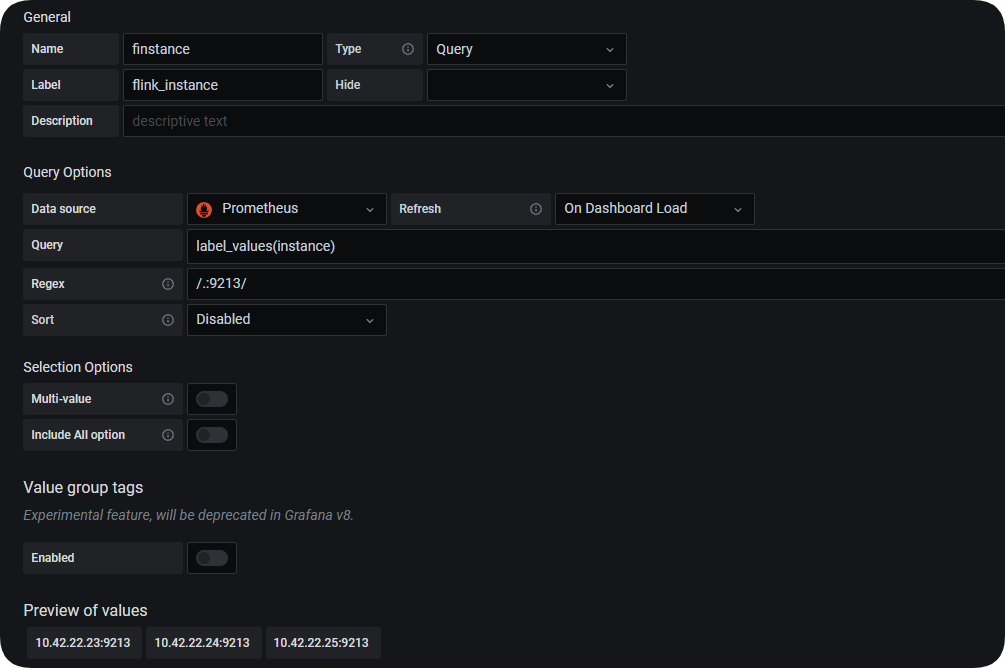
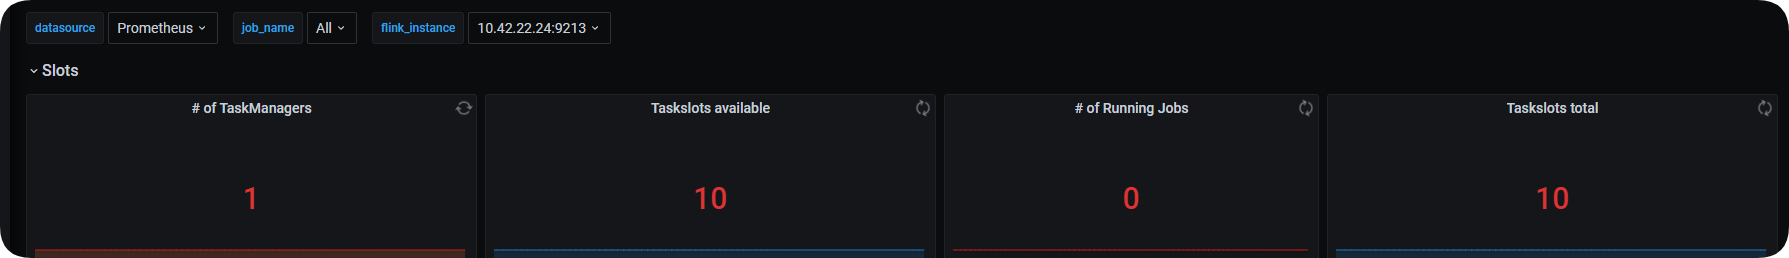
监控大屏配置
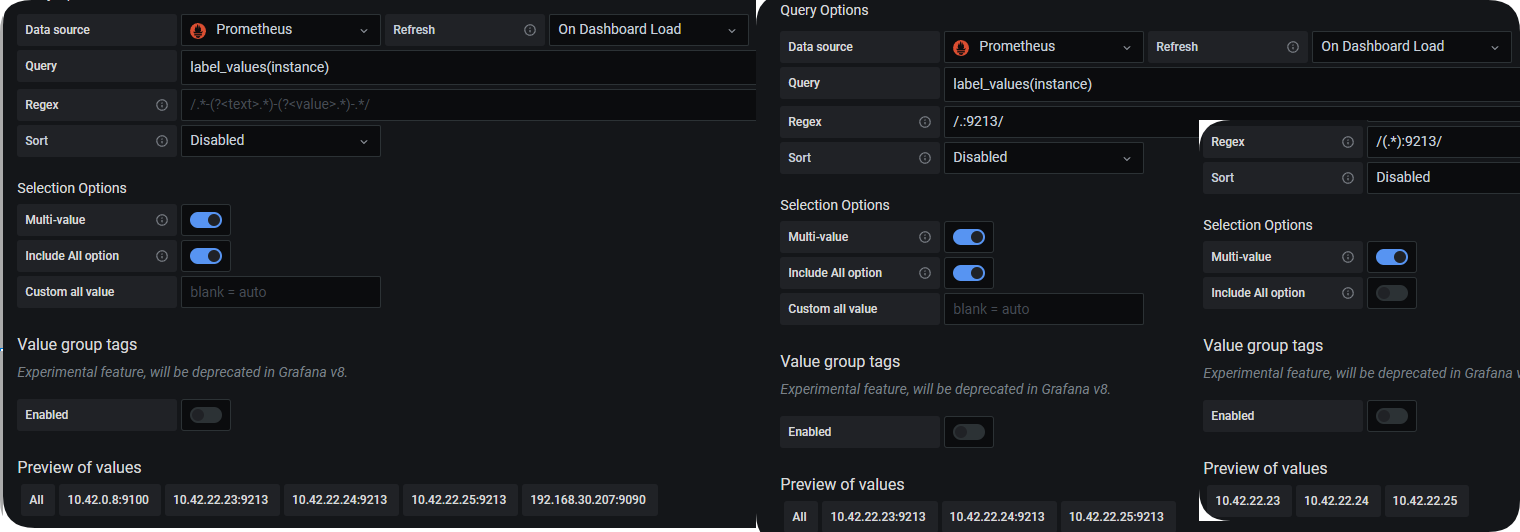
检查查询语法
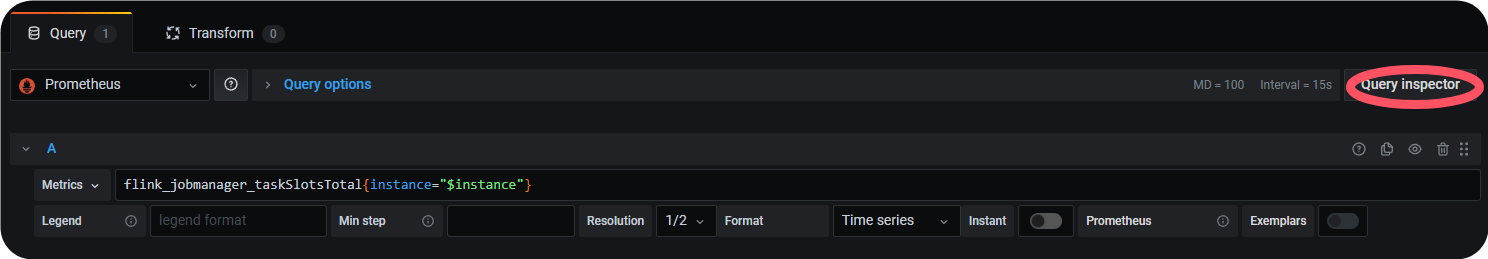
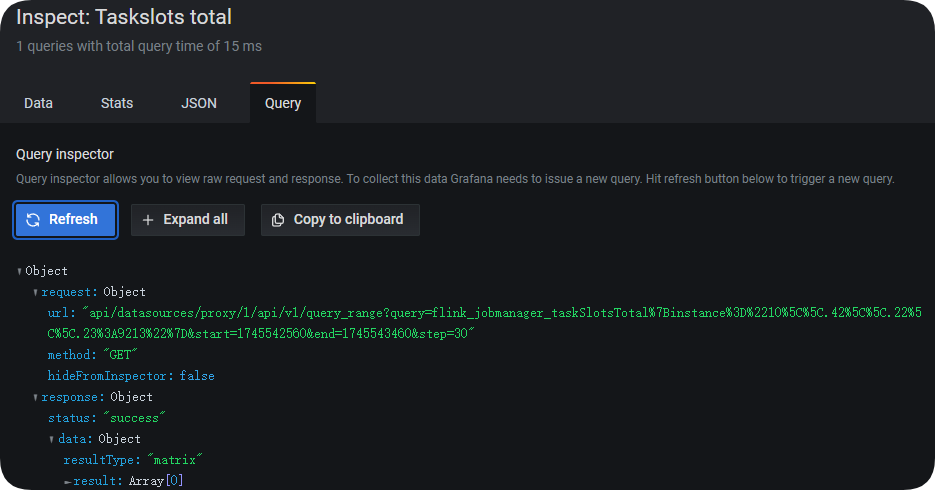
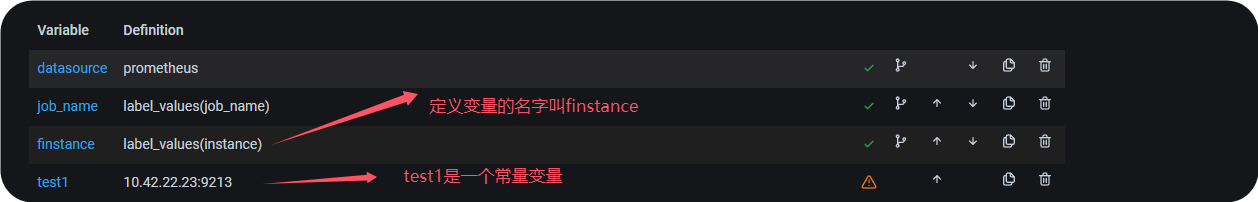
instance这个变量在grafana中定义后不生效,需要定义一个另外名称的变量名称.此处不生效是因为grafana内部已经用了这个instance做了内置变量
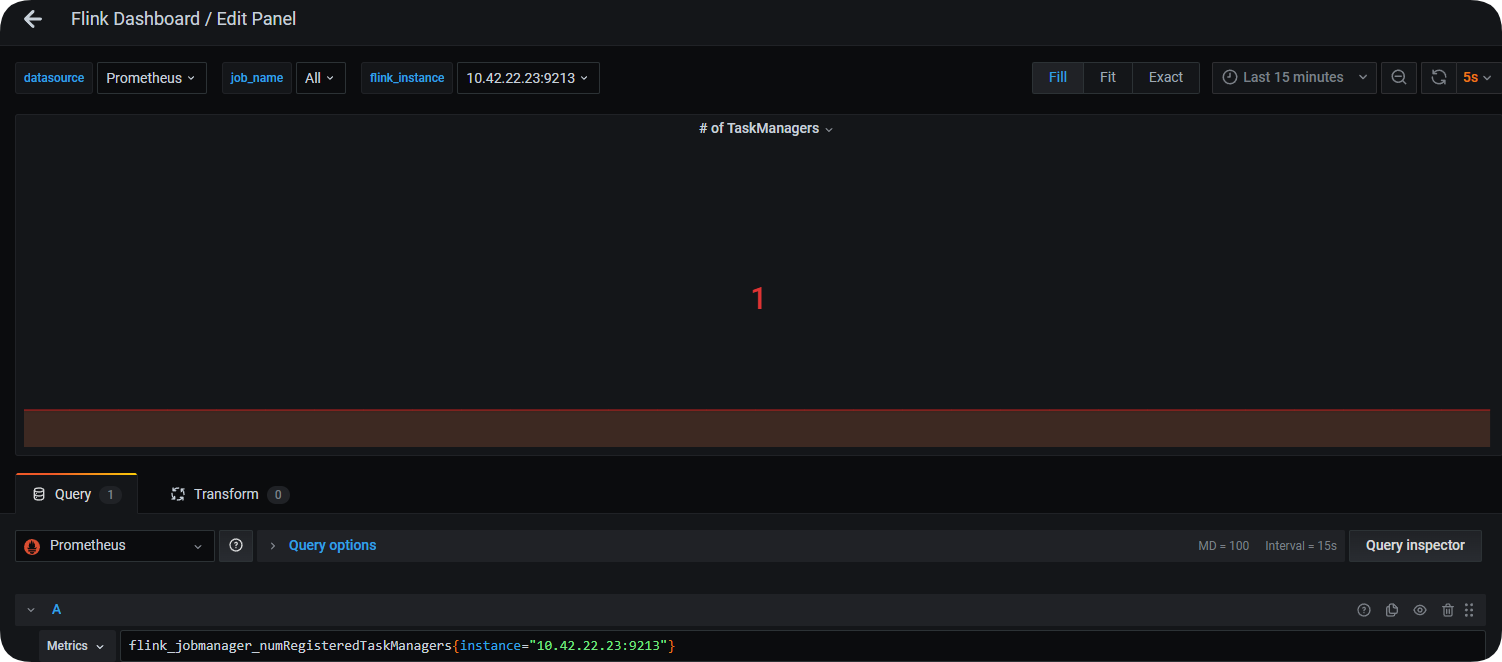
大屏中使用变量值查询
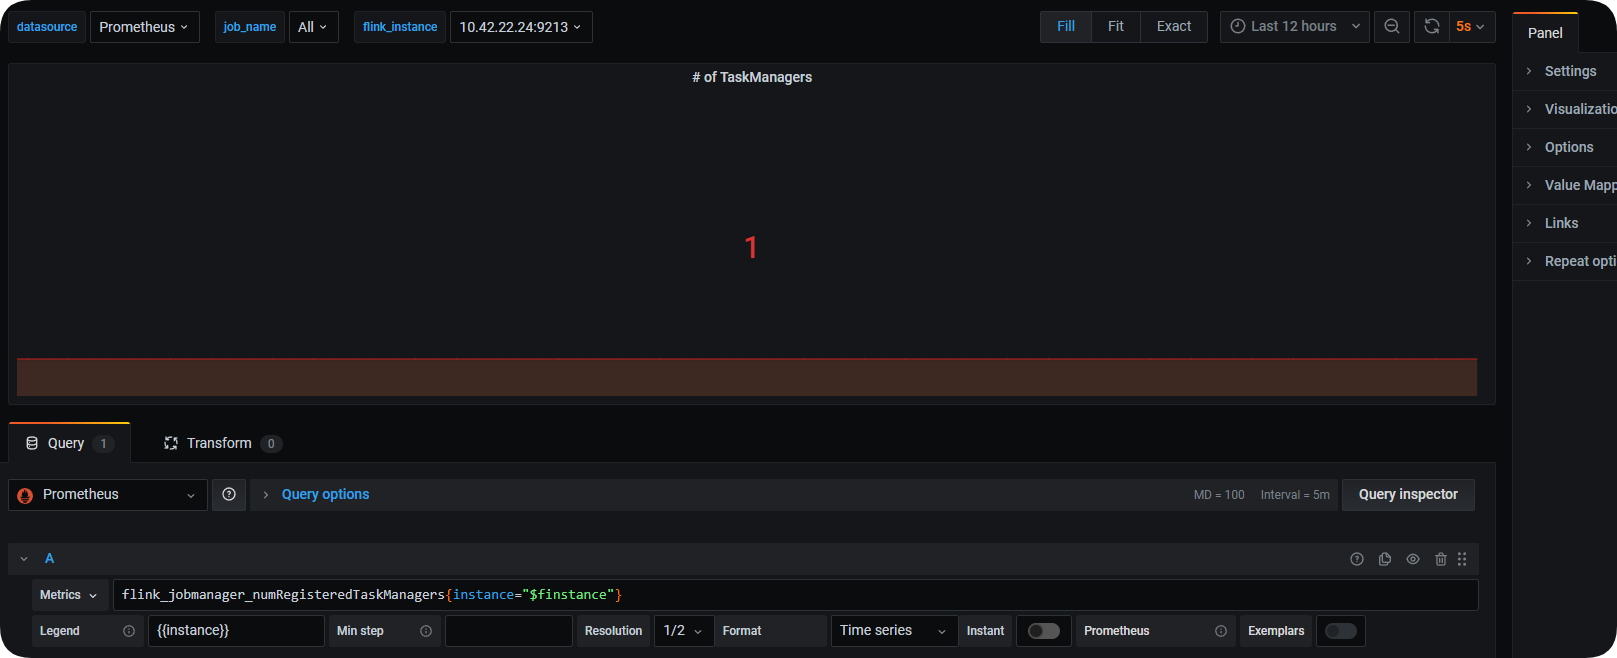
采集数据展示到大屏上
本文来自博客园,作者:不懂123,转载请注明原文链接:https://www.cnblogs.com/yxh168/p/18846011

 浙公网安备 33010602011771号