
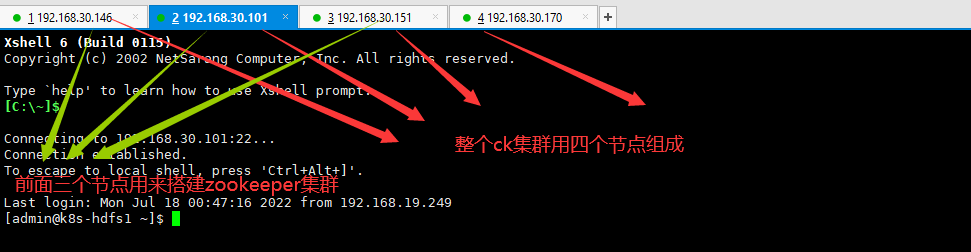
ckman安装步骤
安装zookeeper集群
zk的版本不能低于3.6
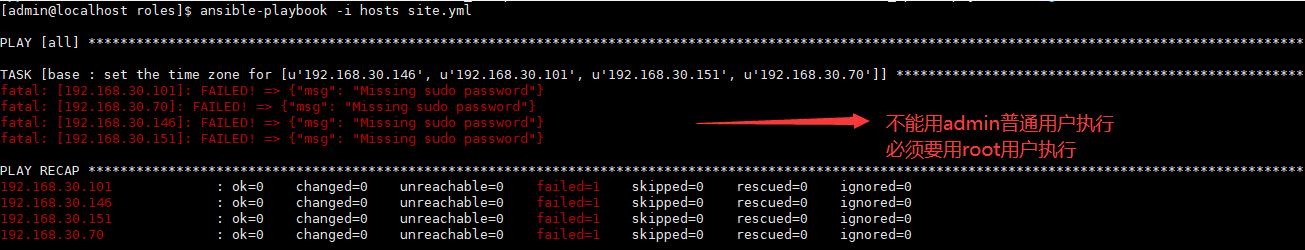
配置普通用户sudo vi /etc/sudoers

zookeeper的配置文件需要开启配置metrics上报
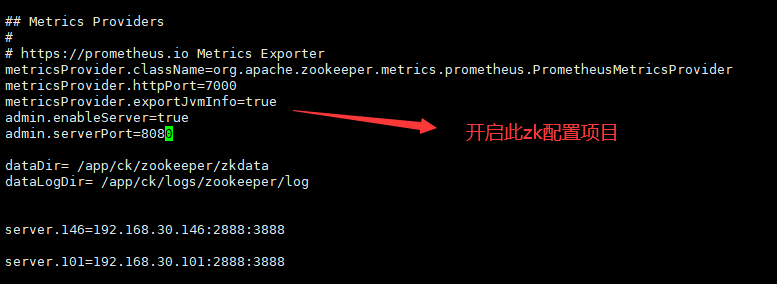


metricsProvider.className=org.apache.zookeeper.metrics.prometheus.PrometheusMetricsProvider
metricsProvider.httpPort=7000
metricsProvider.exportJvmInfo=true
admin.enableServer=true
admin.serverPort=8080
测试zookeeper安装结果
http://192.168.30.101:7000/metrics
http://192.168.30.101:8080/commands/mntr

安装prometheus
下载源码包 https://github.com/prometheus/prometheus/releases/
nohup ./prometheus --storage.tsdb.retention.time=15d &

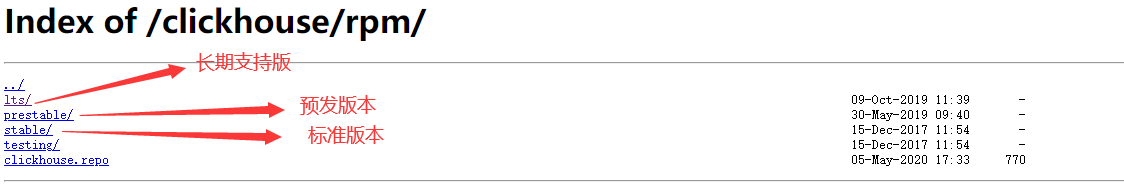
下载clikhouse server安装包
https://repo.yandex.ru/clickhouse/rpm/lts/x86_64/
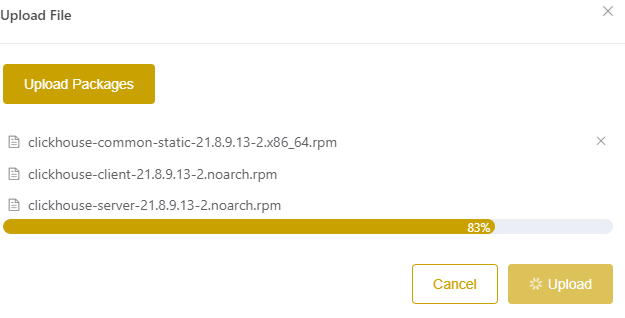
下载三个rpm包

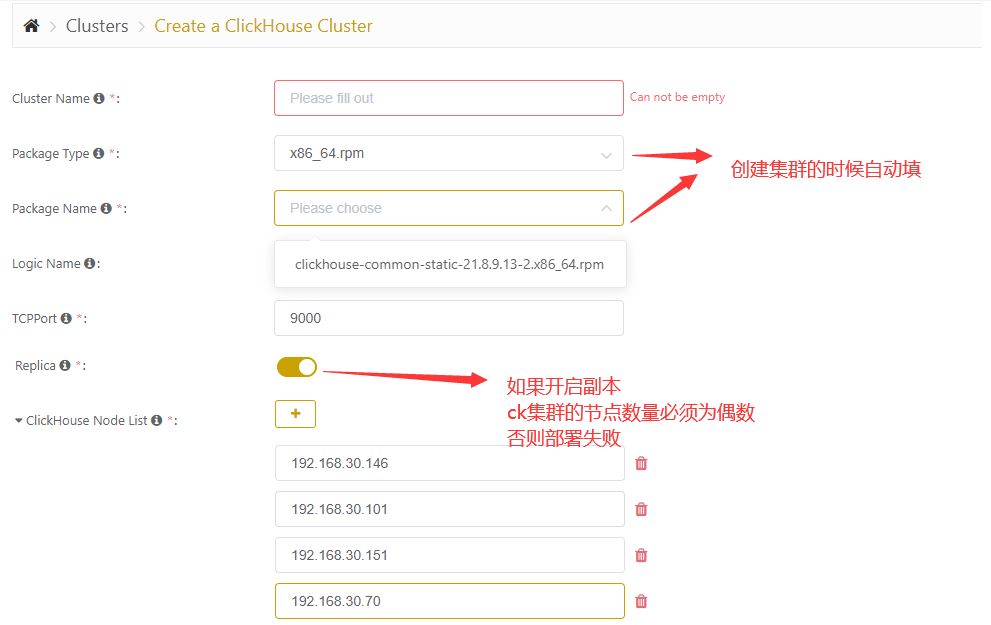
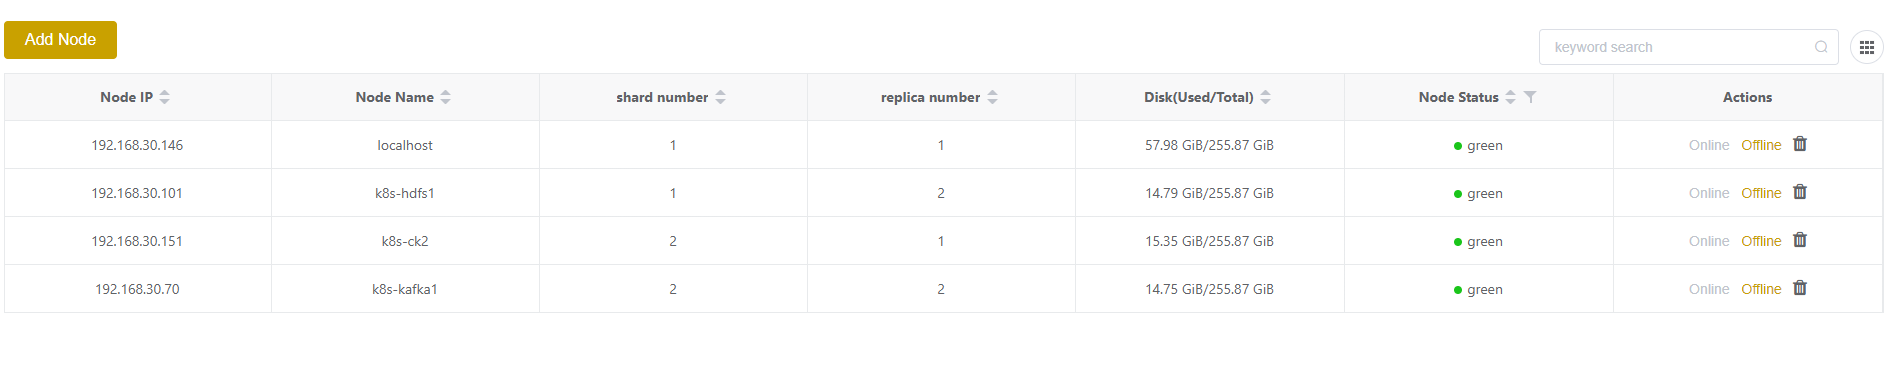
安装ck集群
上传rpm包到ckmanager
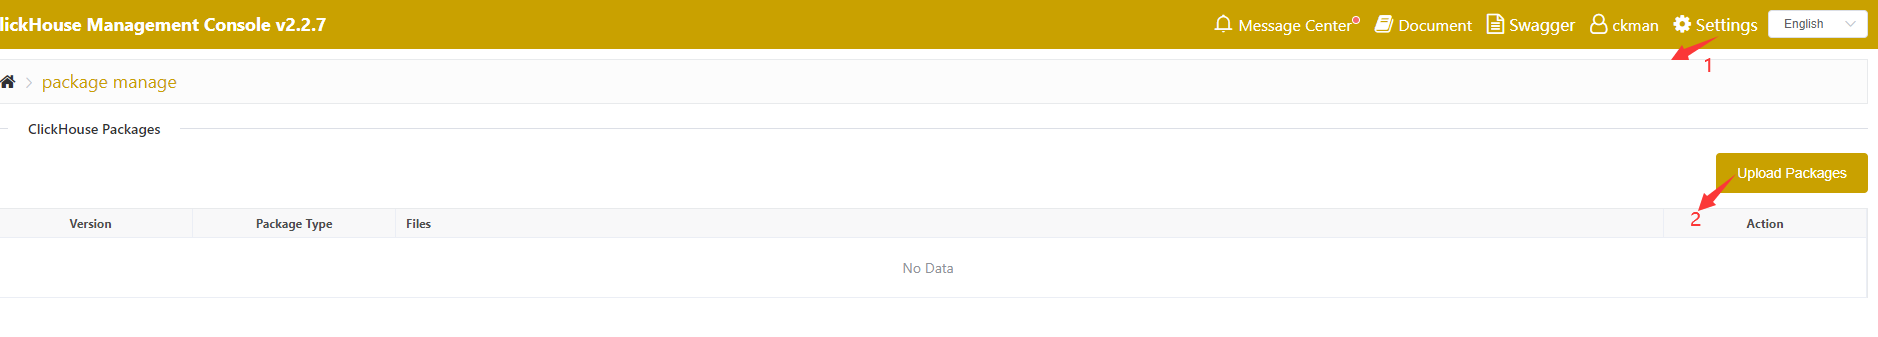

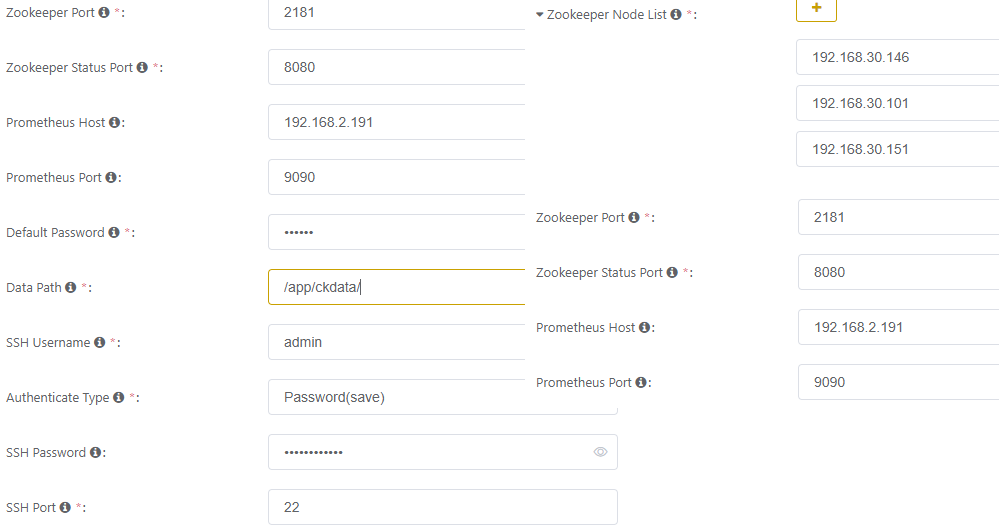
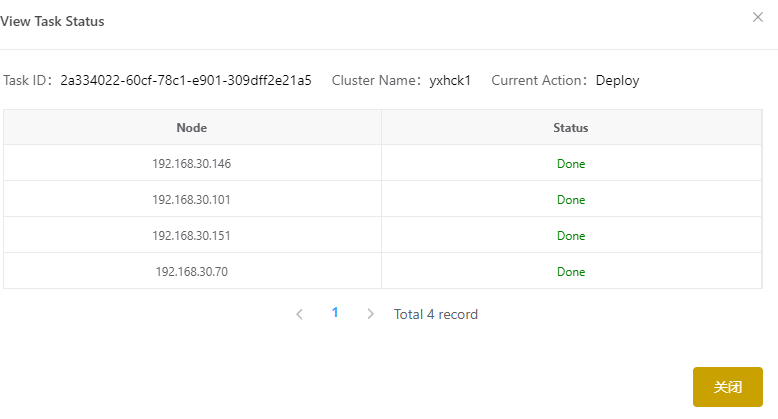
部署设置
所有节点的防火墙必须关闭,各个节点之间通过9000端口进行连通检查

部署问题排查
防火墙问题
firewall-cmd --permanent --zone=public --add-port=2182/tcp
firewall-cmd --permanent --zone=public --add-port=2889/tcp
firewall-cmd --permanent --zone=public --add-port=3889/tcp
firewall-cmd --permanent --zone=public --add-port=8888/tcp
firewall-cmd --permanent --zone=public --add-port=7000/tcp
firewall-cmd --permanent --zone=public --add-port=9363/tcp
firewall-cmd --permanent --zone=public --add-port=9100/tcp
firewall-cmd --permanent --zone=public --add-port=8888/tcp
firewall-cmd --permanent --zone=public --add-port=9000/tcp
firewall-cmd --permanent --zone=public --add-port=8123/tcp
firewall-cmd --reload
ckman日志查询
tail -f /home/admin/ckman/src/ck/ckman/logs/ckman.log
每个节点上都有这个日志文件
tail -f /var/log/clickhouse-server/clickhouse-server.log
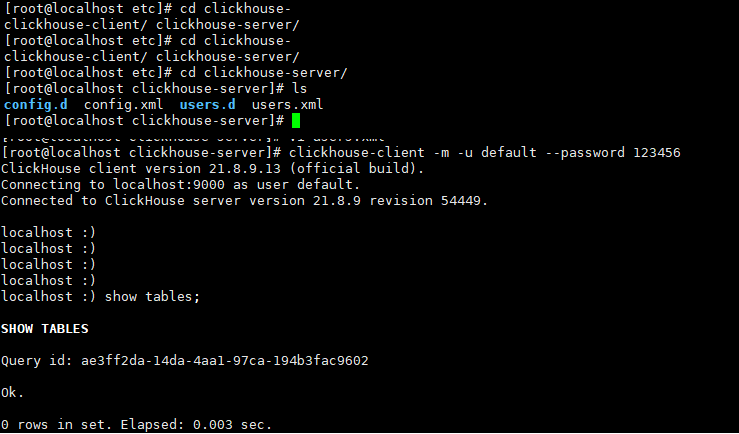
客户端连接ck集群测试
clickhouse-client -m -u default --password 123456
ckman配置promethues监控
1.下载node_exporter压缩包
https://github.com/prometheus/node_exporter/releases/
2.安装到每个节点
3.修改promethues配置文件
# my global config
global:
  scrape_interval: 15s # Set the scrape interval to every 15 seconds. Default is every 1 minute.
  evaluation_interval: 15s # Evaluate rules every 15 seconds. The default is every 1 minute.
  # scrape_timeout is set to the global default (10s).

# Alertmanager configuration
alerting:
  alertmanagers:
    - static_configs:
        - targets:
          # - alertmanager:9093

# Load rules once and periodically evaluate them according to the global 'evaluation_interval'.
rule_files:
  # - "first_rules.yml"
  # - "second_rules.yml"

# A scrape configuration containing exactly one endpoint to scrape:
# Here it's Prometheus itself.
scrape_configs:
  # The job name is added as a label `job=<job_name>` to any timeseries scraped from this config.
  - job_name: "prometheus"
    static_configs:
      - targets: ["localhost:9090"]

  - job_name: "zk"
    static_configs:
      - targets: ["192.168.30.146:7000","192.168.30.101:7000","192.168.30.151:7000"]

  - job_name: "node"
    static_configs:
      - targets: ["192.168.30.146:9100","192.168.30.101:9100","192.168.30.151:9100","192.168.30.70:9100"]

  - job_name: "ck"
    static_configs:
      - targets: ["192.168.30.146:9363","192.168.30.101:9363","192.168.30.151:9363","192.168.30.70:9363"]
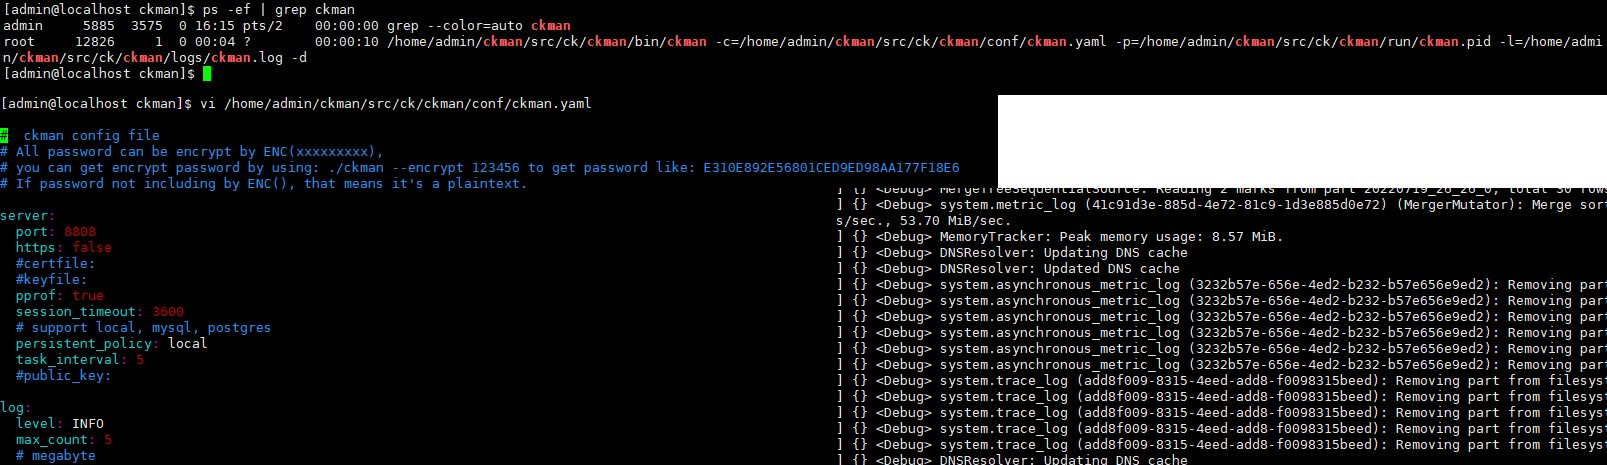
4.修改ckman配置文件
server:
  port: 8808
  https: false
  #certfile:
  #keyfile:
  pprof: true
  session_timeout: 3600
  # support local, mysql, postgres
  persistent_policy: local
  task_interval: 5
  #public_key:

log:
  level: INFO
  max_count: 5
  # megabyte
  max_size: 10
  # day
  max_age: 10


prometheus:
  hosts:
    - 192.168.30.146:9090
  timeout: 10

# cron job task
cron:
  sync_logic_schema: "0 * * * * ?"
5.重启ckman
6.需要注意prometheus和node exporter版本匹配问题
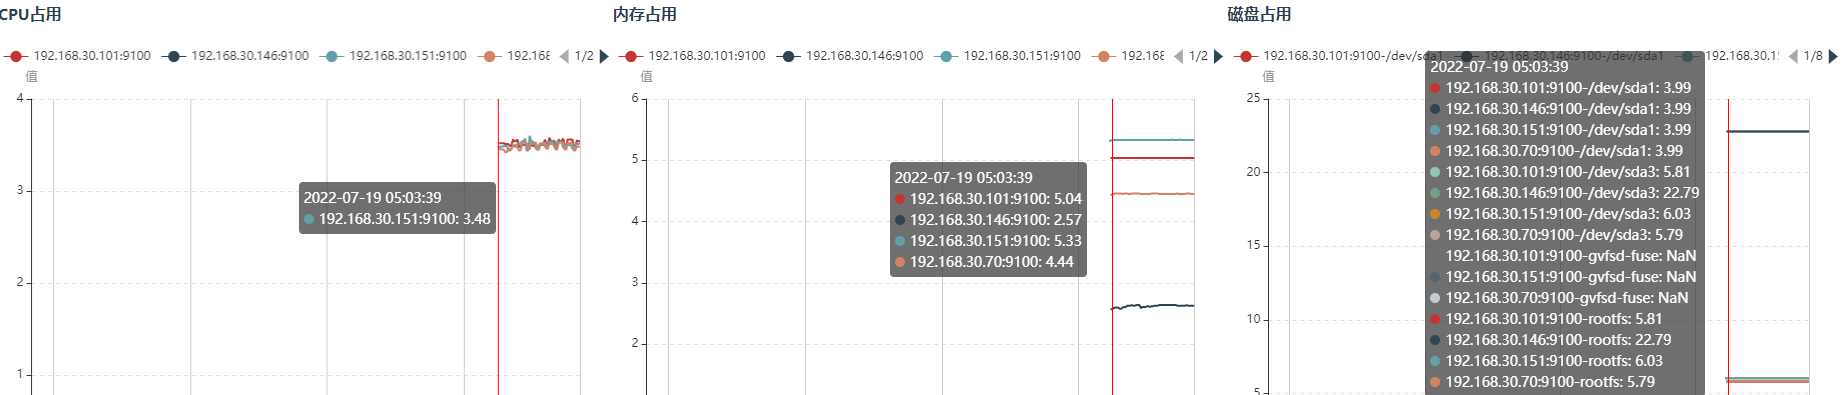
7.展示监控页面
卸载重置ckman
1.终止ckman

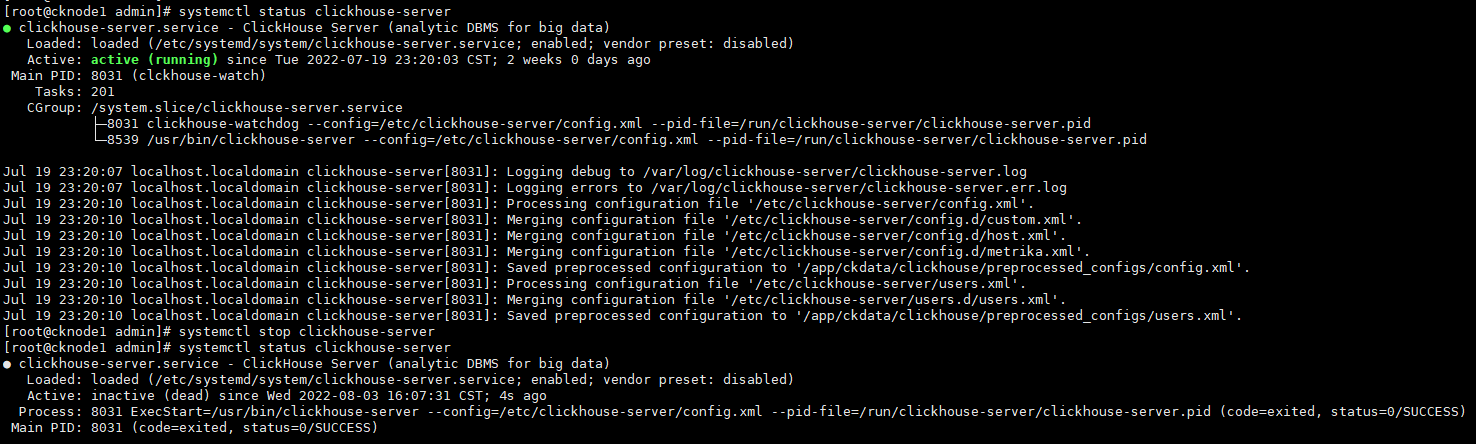
2.终止每台shard上的clickhouse-server
systemctl stop clickhouse-server
本文来自博客园,作者:不懂123,转载请注明原文链接:https://www.cnblogs.com/yxh168/p/16492704.html

 浙公网安备 33010602011771号