
grafana管理基础配置
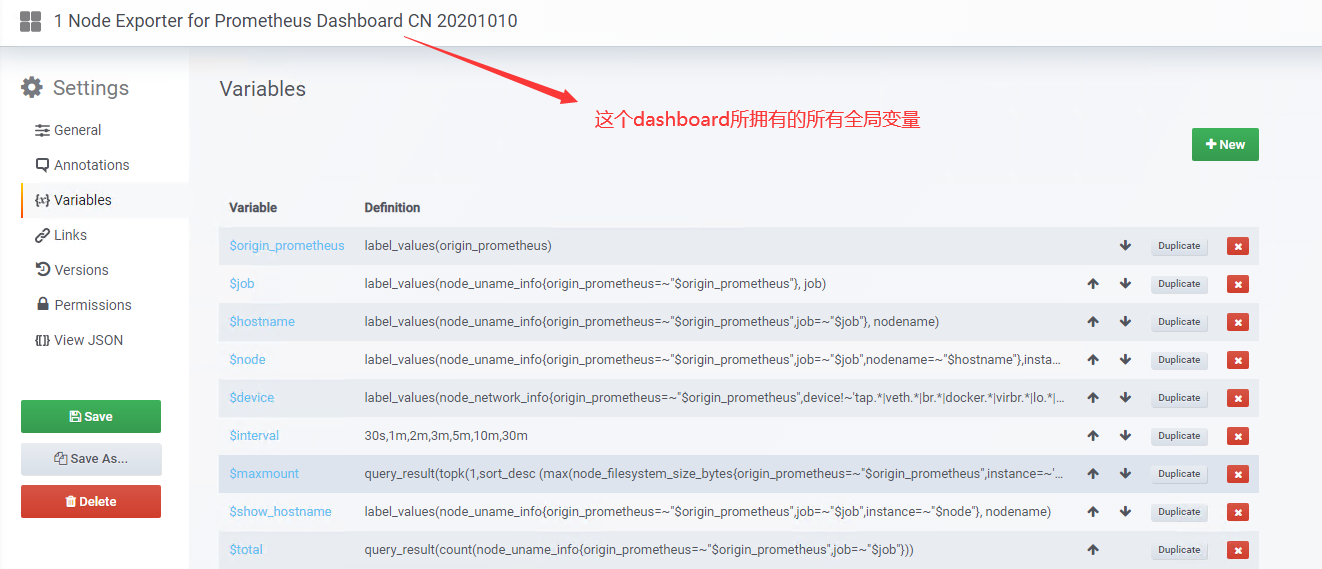
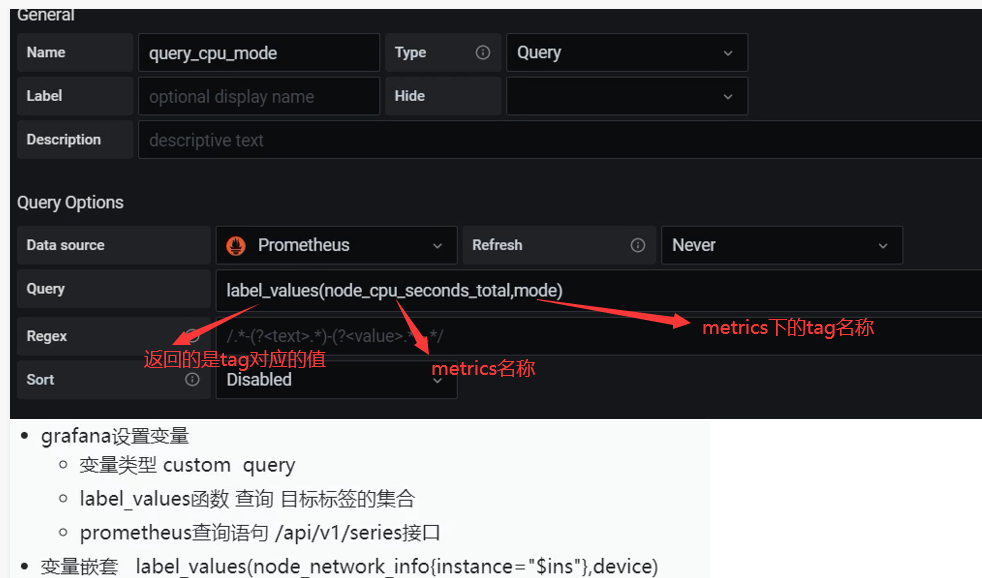
dashboard设置变量
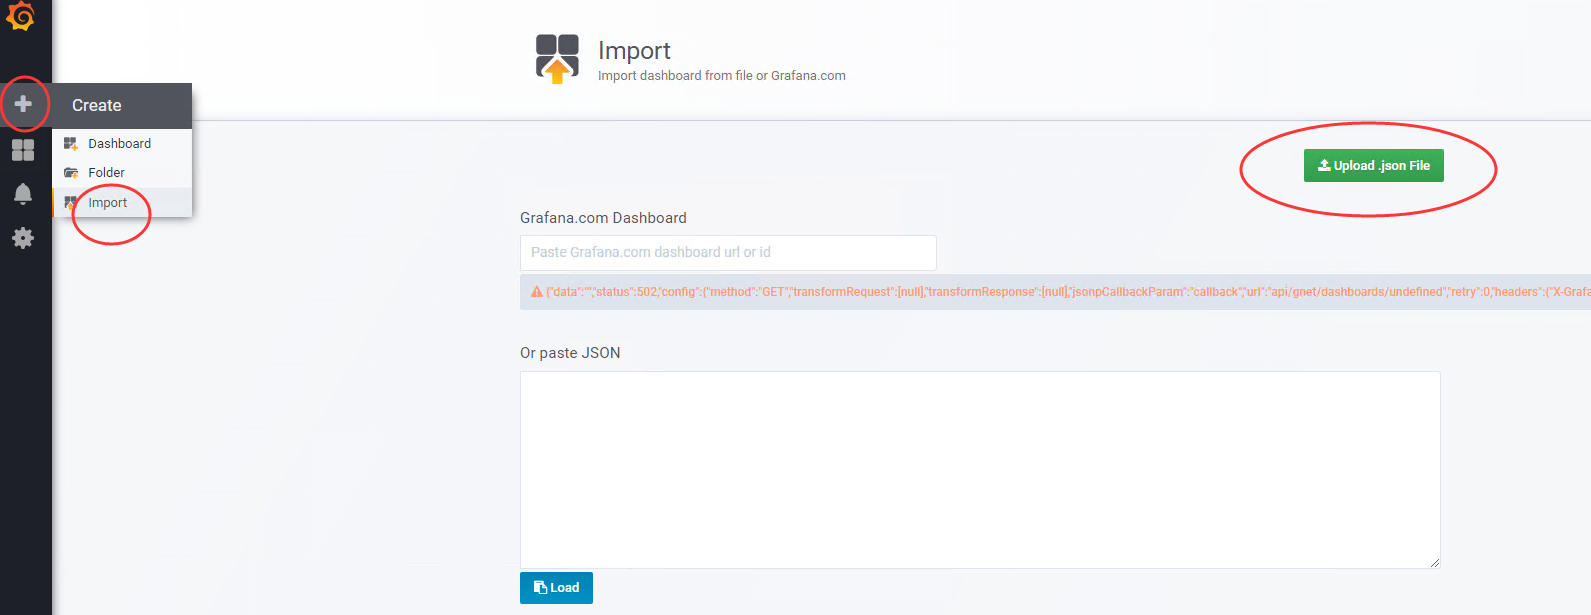
导入dashboard json方法
删除dashboard
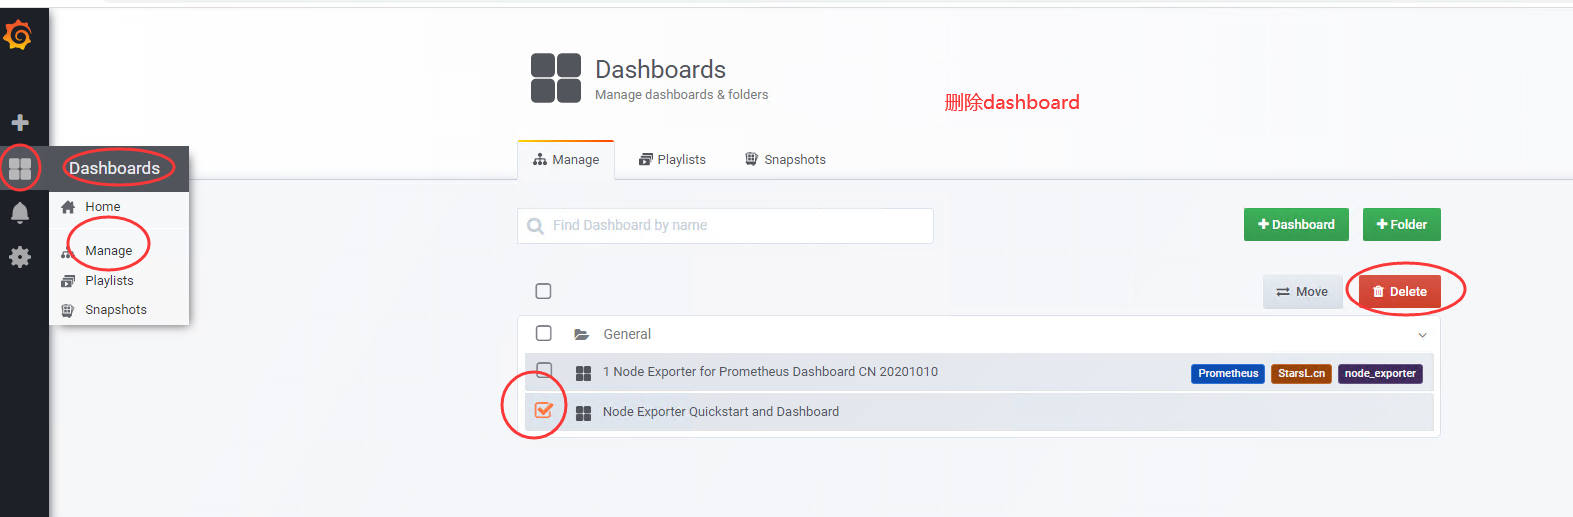
新版删除操作
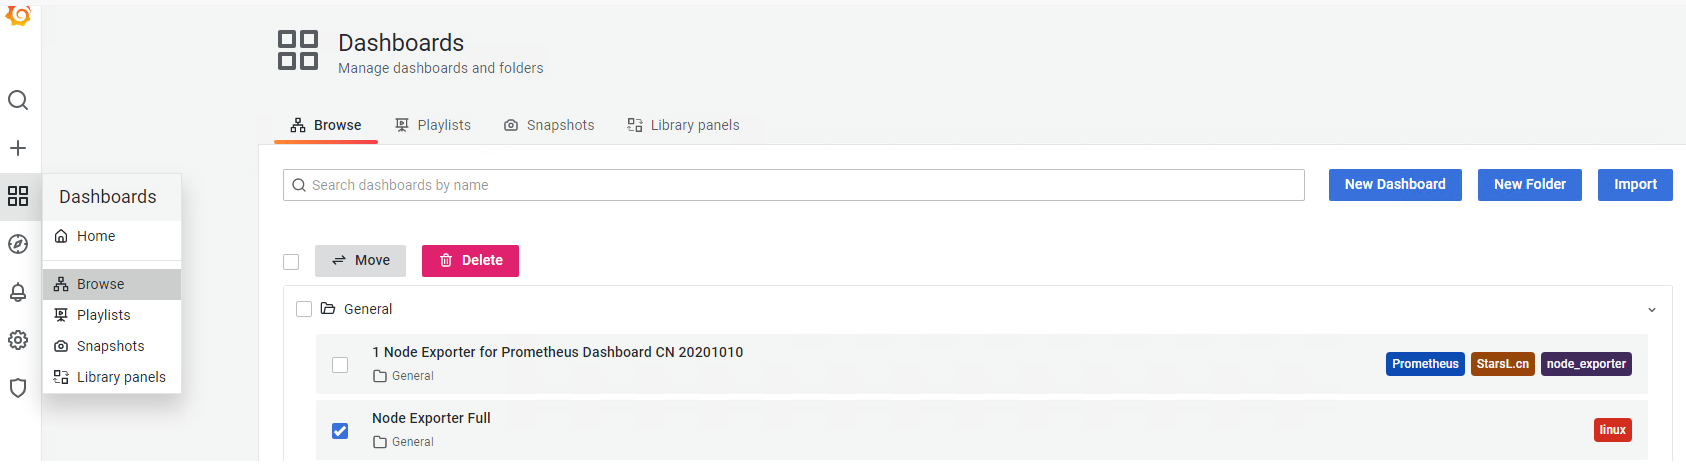
管理面板功能
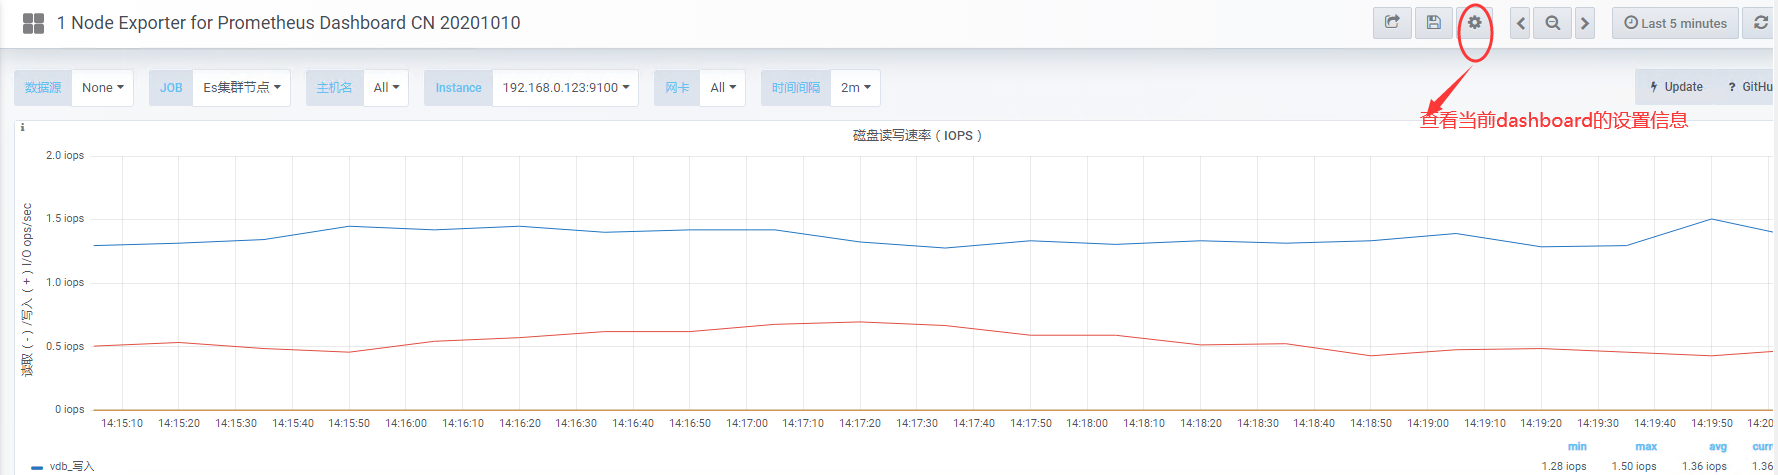
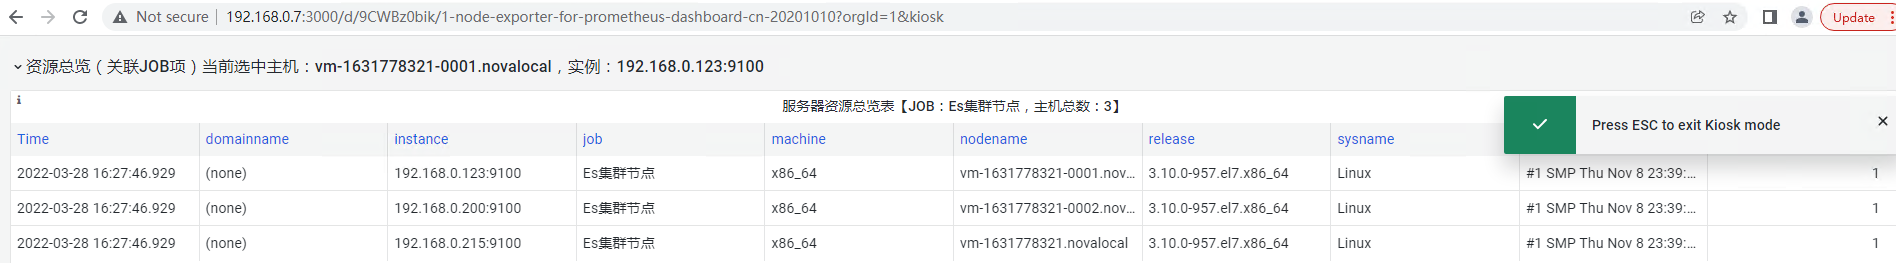
展示模式
1.展示了dashboard名称
2.隐藏左边管理菜单栏
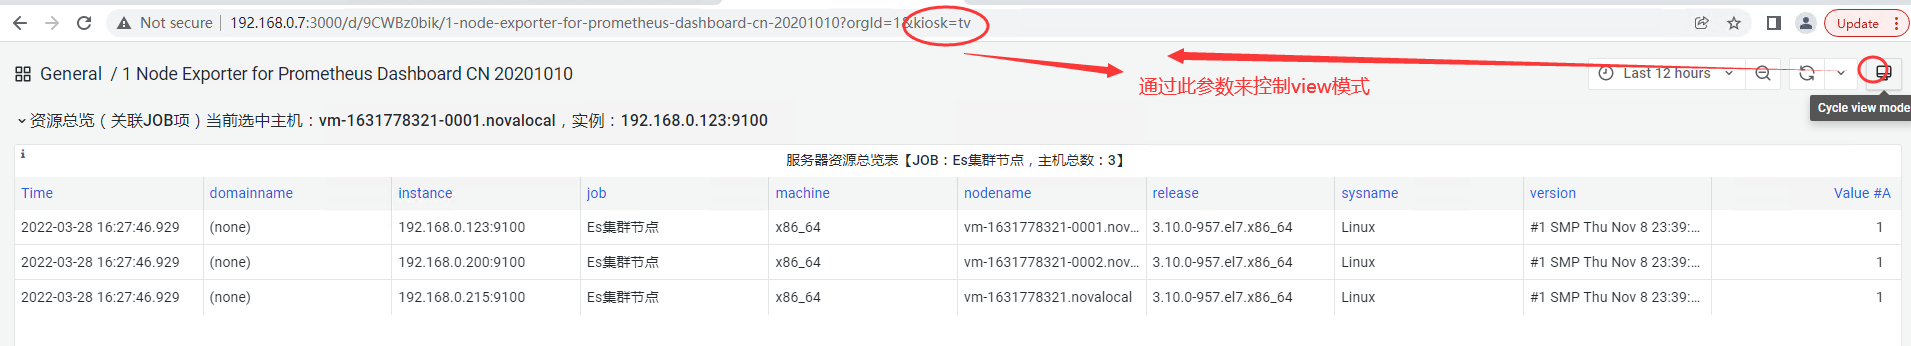
3.隐藏dashboard名称
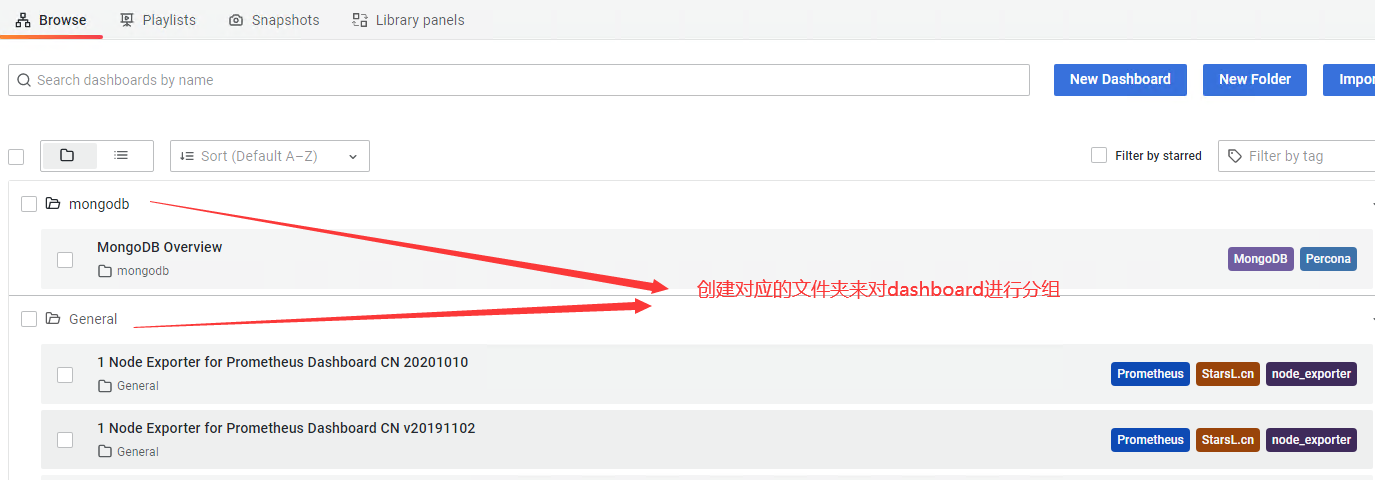
4.dashboard分组
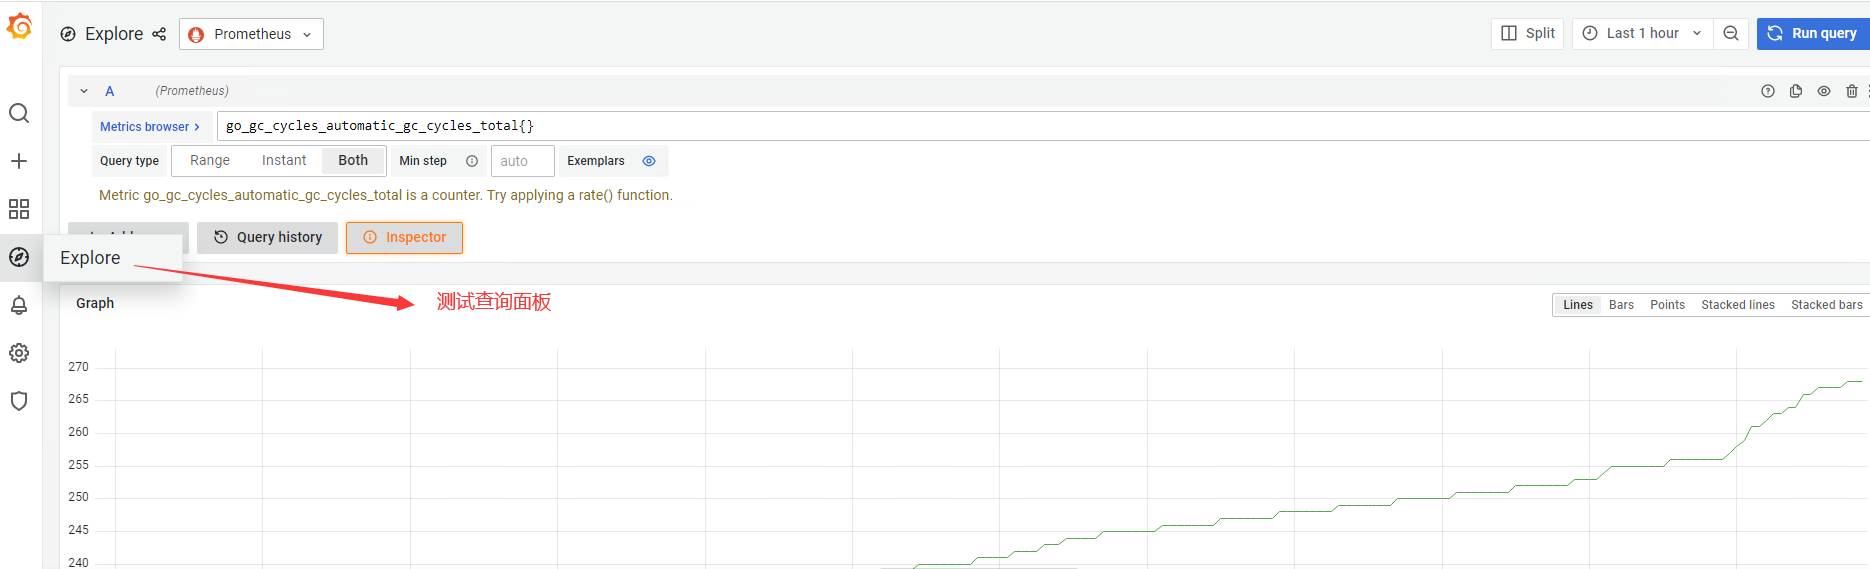
变量设置
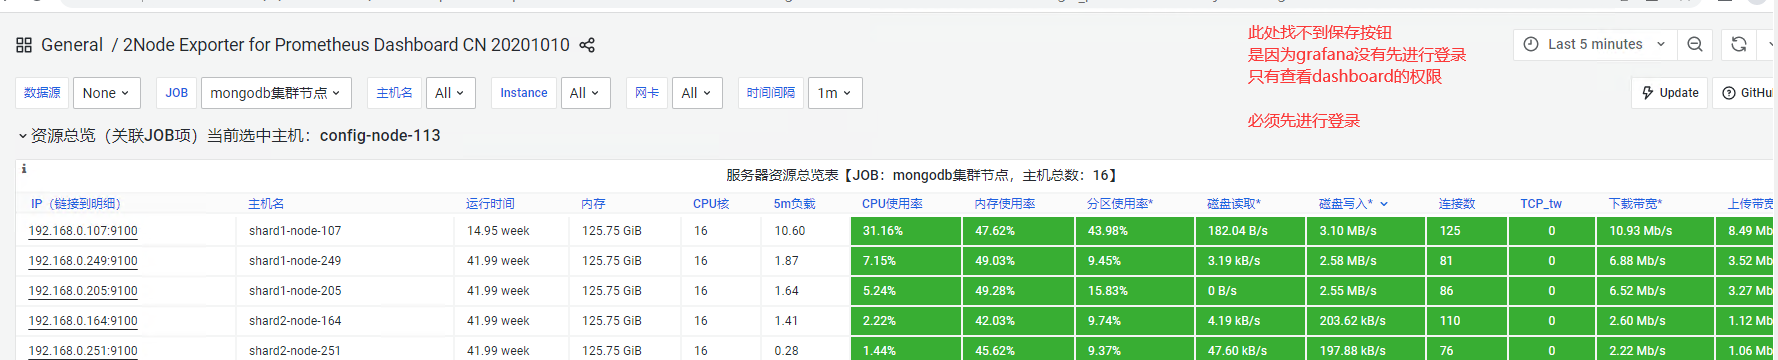
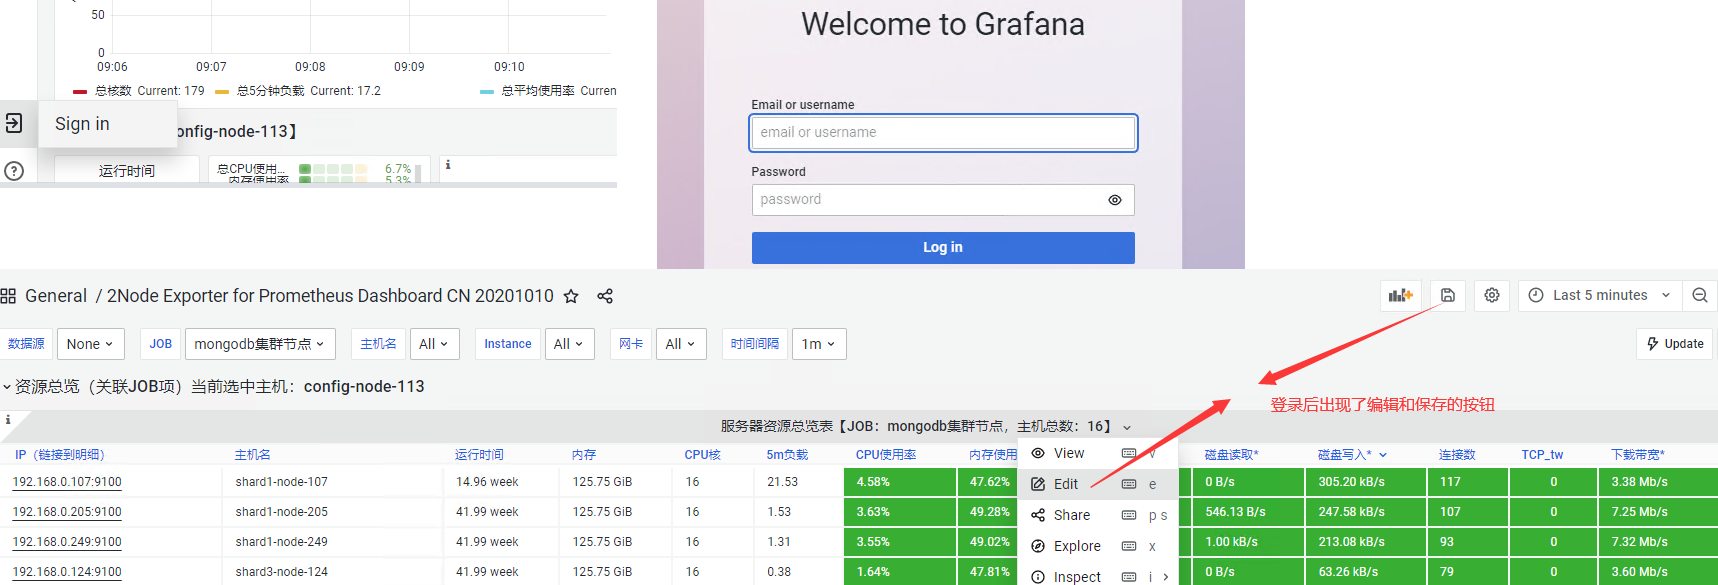
保存dashboard或者页面配置
grafana要进行保存图表配置必须先登录,否则只能查看图表
管理API Key
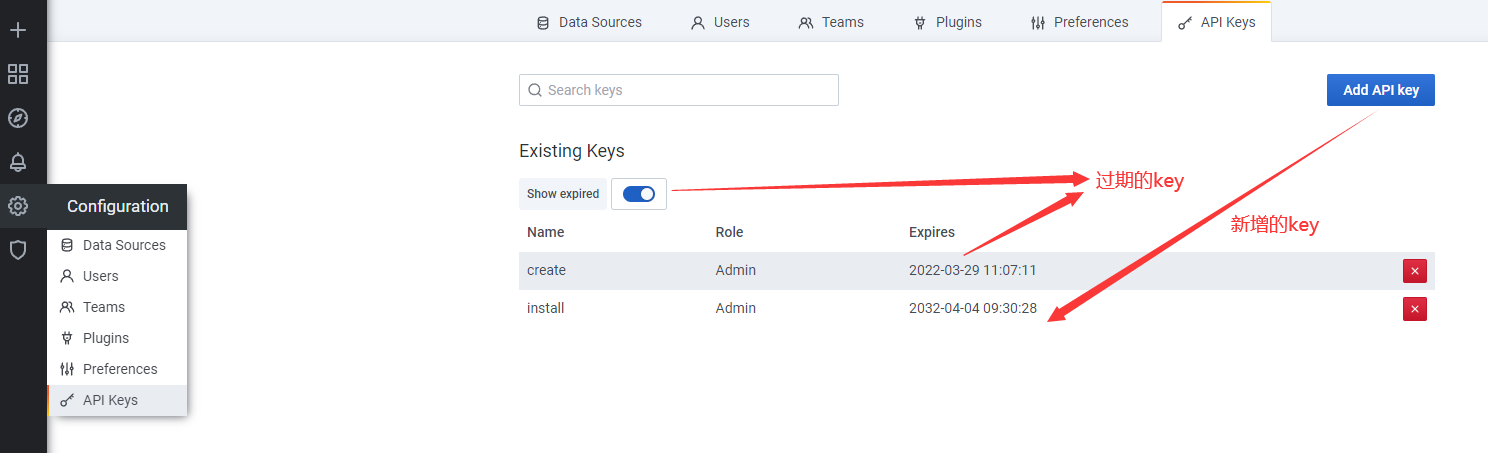
可以通过此API KEY调用grafana的API接口


update_prometheus_datasources()
{
  cat <<EOF
{
    "id": 1,
    "name": "Prometheus",
    "type": "prometheus",
    "access": "proxy",
    "url": "http://127.0.0.1:9090",
    "isDefault":true
}
EOF
}


curl -k -X PUT \
    -H "Authorization: Bearer eyJrIjoiMWNWejdKYWZKQ2dsMlpiMmNFNTRXUkxYcDEwdFVGTnkiLCJuIjoiaW5zdGFsbCIsImlkIjoxfQ==" \
    -H "Content-Type: application/json" \
    -d "$(update_prometheus_datasources)" http://127.0.0.1:3000/api/datasources/1

grep -rn "Bearer" *
* : 表示当前目录所有文件,也可以是某个文件名
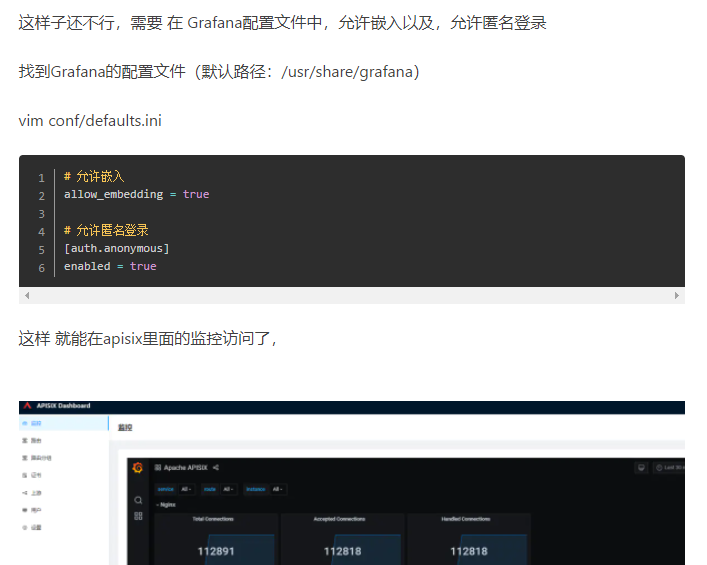
grafana允许嵌入页面
Grafana配置nginx代理嵌套显示
//这个nginx配置文件内容一点都不能变

location ^~ /devops/monitor/ {
  #请求全部转给后端的Grafana
  proxy_pass http://10.72.17.12:3000;
  proxy_set_header Host $host;
  proxy_set_header X-Real-IP $remote_addr;
  proxy_set_header X-Forwarded-For $proxy_add_x_forwarded_for;
}
//grafana的配置文件需要的配置项目
# The http port to use
http_port = 3000

# The public facing domain name used to access grafana from a browser
domain = 10.72.17.12

# Redirect to correct domain if host header does not match domain
# Prevents DNS rebinding attacks
enforce_domain = false

# The full public facing url
root_url =  %(protocol)s://%(domain)s:%(http_port)s/devops/monitor/

# Serve Grafana from subpath specified in `root_url` setting. By default it is set to `false` for compatibility reasons.
serve_from_sub_path = true

# set to true if you want to allow browsers to render Grafana in a <frame>, <iframe>, <embed> or <object>. default is false.
allow_embedding = true

[auth.anonymous]
# enable anonymous access
enabled = true
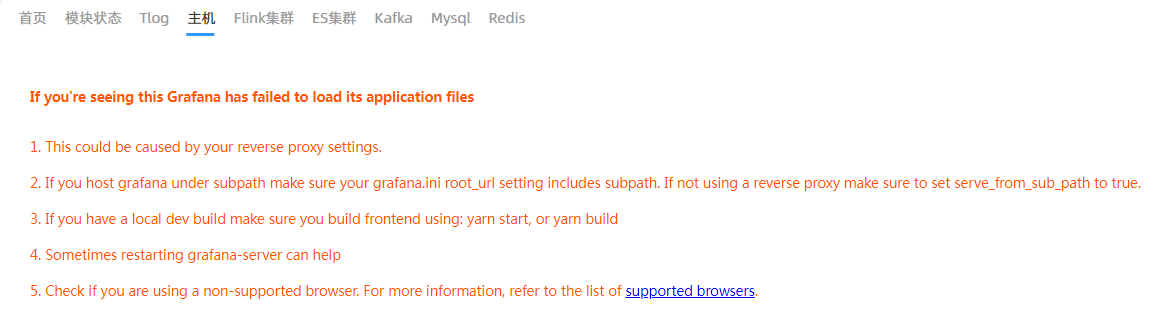
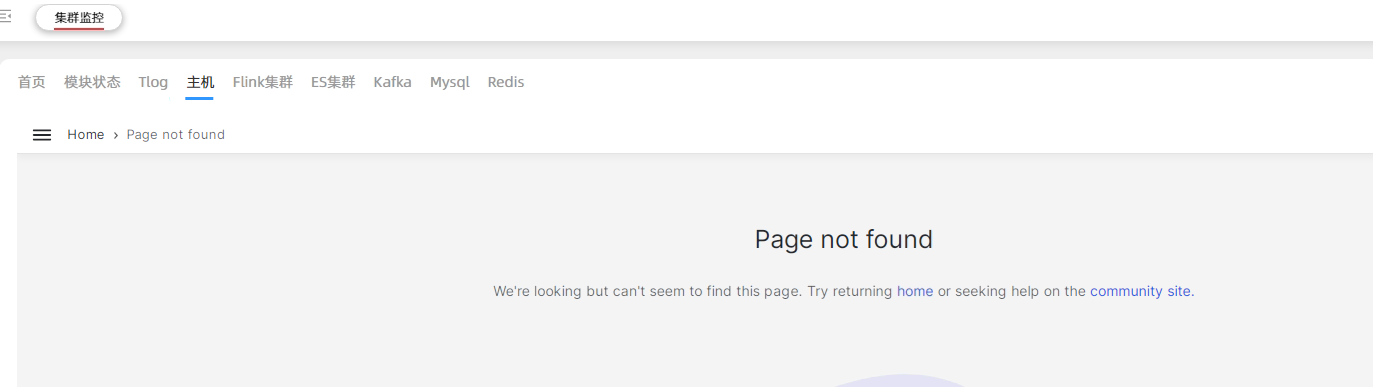
如果配置不对,嵌套的页面就会显示404或者proxy 配置错误
本文来自博客园,作者:不懂123,转载请注明原文链接:https://www.cnblogs.com/yxh168/p/16066798.html

 浙公网安备 33010602011771号