
sklearn之人工分类和分类边界线
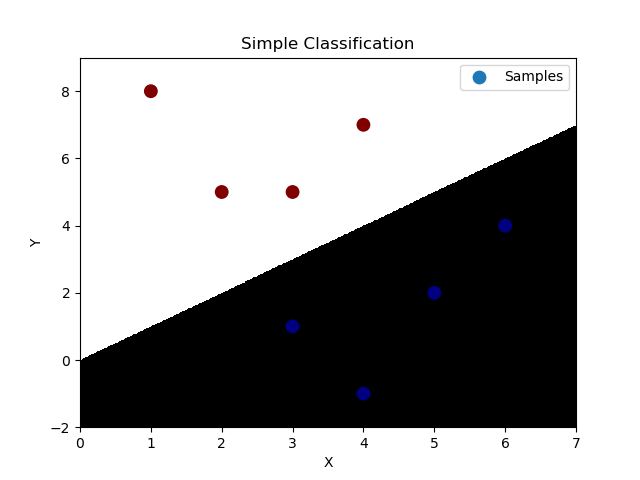
'''
    人工分类:人为的按照自定的规则对事物进行分类
        特征1    特征2    输出
        3        1        0
        2        5        1
        1        8       1
        6        4       0
        5        2        0
        3        5        1
        4        7        1
        4        -1        0
        ...        ...        ...
        6        8        1
        5        1        0

    分类边界线的绘制
'''
import numpy as np
import matplotlib.pyplot as mp

x = np.array([[3, 1],
              [2, 5],
              [1, 8],
              [6, 4],
              [5, 2],
              [3, 5],
              [4, 7],
              [4, -1]])
y = np.array([0, 1, 1, 0, 0, 1, 1, 0])

# 根据找到的某些规律,绘制分类边界线
l, r = x[:, 0].min() - 1, x[:, 0].max() + 1
b, t = x[:, 1].min() - 1, x[:, 1].max() + 1
n = 500
grid_x, grid_y = np.meshgrid(np.linspace(l, r, n), np.linspace(b, t, n))
# print(grid_x)
# 当x>y时,样本属于0类别,反之则为1类别,grid_z保存的时每个点的类别
grid_z = np.piecewise(grid_x, [grid_x > grid_y, grid_x < grid_y], [0, 1])

# 绘制样本数据
mp.figure('Simple Classification', facecolor='lightgray')
mp.title('Simple Classification')
mp.xlabel('X')
mp.ylabel('Y')
# 绘制分类边界线(填充网格化矩阵)
mp.pcolormesh(grid_x, grid_y, grid_z, cmap='gray')
mp.scatter(x[:, 0], x[:, 1], s=80, c=y, cmap='jet', label='Samples')

mp.legend()
mp.show()

 浙公网安备 33010602011771号