
短视频app源代码,echarts堆叠柱状图formatter
短视频app源代码,echarts堆叠柱状图formatter
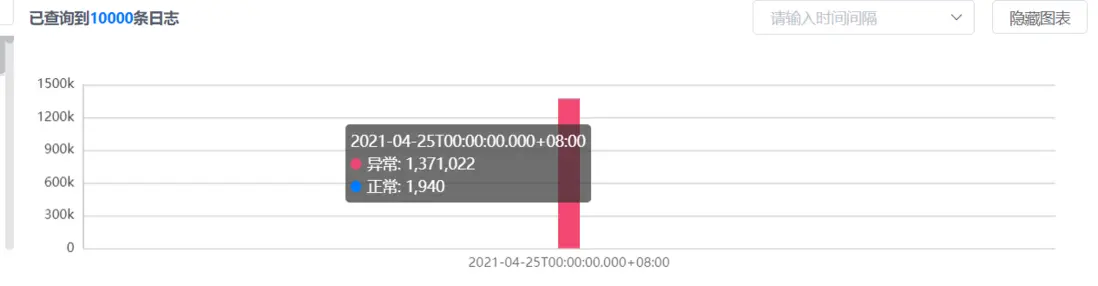
<template>
  <div class="wrap">
    <div class="tool">
      <div style="font-weight:bold">
        已查询到<span style="font-weight:bold" class="base-color">{{
          total
        }}</span
        >条日志
      </div>
      <div>
        <el-select :disabled="!showChart" v-model="time" placeholder="请输入时间间隔">
          <el-option
            v-for="item in options"
            :key="item.value"
            :label="item.label"
            :value="item.value"
          >
          </el-option>
        </el-select>
        <el-button
          @click="
            () => {
              showChart = !showChart;
            }
          "
          >{{ showChart ? "隐藏" : "展示" }}图表</el-button
        >
      </div>
    </div>
    <div v-show="showChart" id="main"></div>
  </div>
</template>

<script>
import { mapGetters } from "vuex";
export default {
  data() {
    return {
      showChart: true,
      chart: null,
      time: "1d",
      options: [
        {
          label: "5分钟",
          value: "5m"
        },
        {
          label: "30分钟",
          value: "30m"
        },
        {
          label: "一小时",
          value: "1h"
        },
        {
          label: "3小时",
          value: "3h"
        },
        {
          label: "5小时",
          value: "5h"
        },
        {
          label: "12小时",
          value: "12h"
        },
        {
          label: "一天",
          value: "1d"
        }
      ]
    };
  },
  props: {
    total: {
      type: Number,
      default: 0
    },
    reportSeries: {
      type: Object,
      default() {
        return {
          date: [],
          abnormal: [],
          normal: []
        };
      }
    }
  },
  computed: {
    ...mapGetters(["isOpenedSidebar"])
  },
  mounted() {
    window.onresize = () => {
      this.chart.resize();
    };
  },
  watch: {
    isOpenedSidebar() {
      if (!this.chart) return;
      setTimeout(() => {
        this.chart.resize();
      }, 300);
    },
    reportSeries: {
      handler() {
        this.renderEcharts();
      },
      deep: true
    },
    time(nv) {
      this.$emit("change", nv);
    }
  },
  destroyed() {
    window.onresize = null;
  },
  methods: {
    renderEcharts() {
      this.chart = this.$echarts.init(document.getElementById("main"));
      const option = {
        tooltip: {
          trigger: "axis",
          axisPointer: {
            // 坐标轴指示器,坐标轴触发有效
            type: "shadow" // 默认为直线,可选为:'line' | 'shadow'
          }
        },
        // calculable: true,
        xAxis: [
          {
            type: "category",
            data: this.reportSeries.date,
            // 是否显示分隔线
            splitLine: {
              show: true
            },
            // 是否显示坐标轴轴线
            axisLine: {
              show: false
            },
            // 是否显示坐标轴刻度
            axisTick: {
              show: false
            },
            // 刻度标签样式
            axisLabel: {
              show: true,
              color: "rgba(0, 0, 0, 0.65)"
              // rotate: 40
            }
          }
        ],
        yAxis: [
          {
            type: "value",
            // 刻度标签样式
            axisLabel: {
              show: true,
              color: "rgba(0, 0, 0, 0.65)",
              formatter(value) {
                if (value > 1000) {
                  value = parseInt(value) / 1000 + "k";
                }
                return value;
              }
            },
            // 是否显示分隔线
            splitLine: {
              show: true
            },
            // 是否显示坐标轴刻度
            axisTick: {
              show: false
            },
            // 是否显示坐标轴轴线
            axisLine: {
              show: false
            },
            splitNumber: 4
          }
        ],
        series: [
          {
            name: "异常",
            type: "bar",
            stack: "广告",
            data: this.reportSeries.abnormal,
            itemStyle: {
              color: "#F34871"
            }
          },
          {
            name: "正常",
            type: "bar",
            barWidth: 20,
            stack: "广告",
            data: this.reportSeries.normal,
            itemStyle: {
              color: "#007AFF"
            }
          }
        ],
        grid: {
          x: 50,
          y: 25,
          x2: 30,
          y2: 35
        }
      };

      this.chart.setOption(option);
    }
  }
};
</script>

<style scoped lang="scss">
.base-color {
  color: $theme-a-base;
}
.wrap {
  width: 100%;
  margin-bottom: 12px;
  #main {
    width: 100%;
    height: 210px;
  }
  .tool {
    height: 32px;
    width: 100%;
    display: flex;
    justify-content: space-between;
    align-items: center;
    .el-select {
      margin-right: 12px;
    }
  }
}
</style>
以上就是短视频app源代码,echarts堆叠柱状图formatter, 更多内容欢迎关注之后的文章

 浙公网安备 33010602011771号