k-均值聚类Python代码实现
k-均值聚类Python代码实现
这里给出两种方式的k-均值实现,code主要来自于网络:
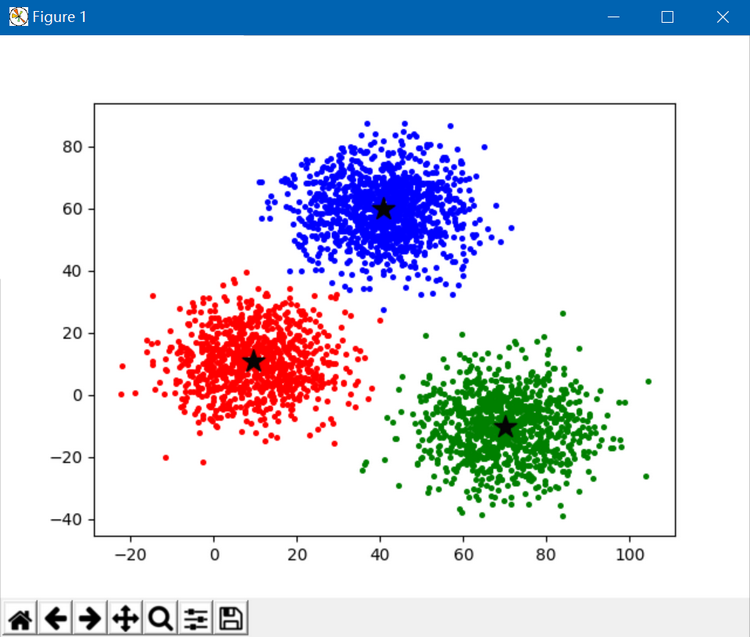
1. 以下code来自于:https://mubaris.com/2017/10/01/kmeans-clustering-in-python/
# reference: https://mubaris.com/2017/10/01/kmeans-clustering-in-python/

from copy import deepcopy
import numpy as np
import pandas as pd
from matplotlib import pyplot as plt

#plt.rcParams['figure.figsize'] = (16, 9)
#plt.style.use('ggplot')

# Importing the dataset
data = pd.read_csv('E:/GitCode/NN_Test/data/database/xclara.csv')
#print(data.shape)
data.head()

# Getting the values and plotting it
f1 = data['V1'].values
f2 = data['V2'].values
X = np.array(list(zip(f1, f2)))
#plt.scatter(f1, f2, c='black', s=7)

# Euclidean Distance Caculator
def dist(a, b, ax=1):
    return np.linalg.norm(a - b, axis=ax)

# Number of clusters
k = 3
# X coordinates of random centroids
C_x = np.random.randint(0, np.max(X)-20, size=k)
# Y coordinates of random centroids
C_y = np.random.randint(0, np.max(X)-20, size=k)
C = np.array(list(zip(C_x, C_y)), dtype=np.float32)
#print(C)

# Plotting along with the Centroids
#plt.scatter(f1, f2, c='#050505', s=7)
#plt.scatter(C_x, C_y, marker='*', s=200, c='g')

# To store the value of centroids when it updates
C_old = np.zeros(C.shape)
# Cluster Lables(0, 1, 2)
clusters = np.zeros(len(X))
# Error func. - Distance between new centroids and old centroids
error = dist(C, C_old, None)
# Loop will run till the error becomes zero
while error != 0:
    # Assigning each value to its closest cluster
    for i in range(len(X)):
        distances = dist(X[i], C)
        cluster = np.argmin(distances)
        clusters[i] = cluster
    # Storing the old centroid values
    C_old = deepcopy(C)
    # Finding the new centroids by taking the average value
    for i in range(k):
        points = [X[j] for j in range(len(X)) if clusters[j] == i]
        C[i] = np.mean(points, axis=0)
    error = dist(C, C_old, None)

colors = ['r', 'g', 'b', 'y', 'c', 'm']
fig, ax = plt.subplots()
for i in range(k):
        points = np.array([X[j] for j in range(len(X)) if clusters[j] == i])
        ax.scatter(points[:, 0], points[:, 1], s=7, c=colors[i])
ax.scatter(C[:, 0], C[:, 1], marker='*', s=200, c='#050505')

plt.show()
执行结果如下:
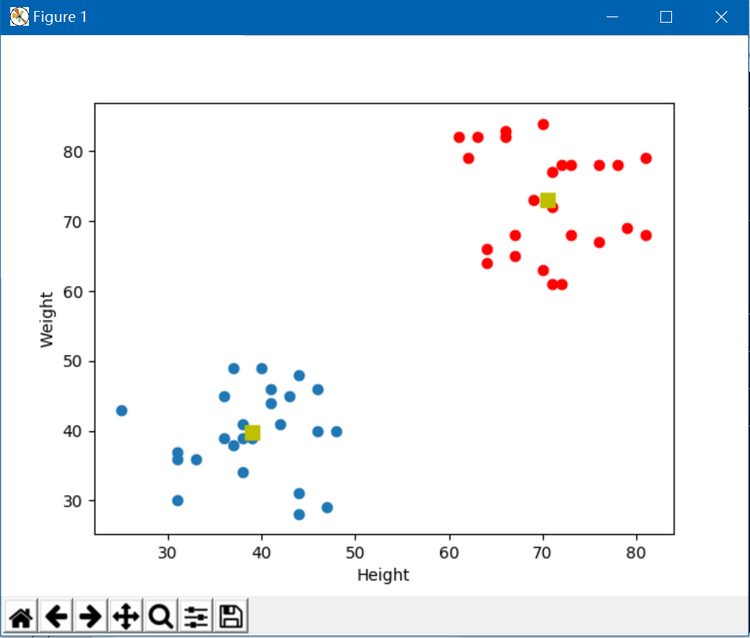
2. 以下code调用OpenCV中的接口,code来自于:https://docs.opencv.org/3.0-beta/doc/py_tutorials/py_ml/py_kmeans/py_kmeans_opencv/py_kmeans_opencv.html
# reference: https://docs.opencv.org/3.0-beta/doc/py_tutorials/py_ml/py_kmeans/py_kmeans_opencv/py_kmeans_opencv.html

import numpy as np
import cv2
from matplotlib import pyplot as plt

X = np.random.randint(25,50,(25,2))
Y = np.random.randint(60,85,(25,2))
Z = np.vstack((X,Y))

# convert to np.float32
Z = np.float32(Z)

# define criteria and apply kmeans()
criteria = (cv2.TERM_CRITERIA_EPS + cv2.TERM_CRITERIA_MAX_ITER, 10, 1.0)
ret,label,center=cv2.kmeans(Z,2,None,criteria,10,cv2.KMEANS_RANDOM_CENTERS)

# Now separate the data, Note the flatten()
A = Z[label.ravel()==0]
B = Z[label.ravel()==1]

# Plot the data
plt.scatter(A[:,0],A[:,1])
plt.scatter(B[:,0],B[:,1],c = 'r')
plt.scatter(center[:,0],center[:,1],s = 80,c = 'y', marker = 's')
plt.xlabel('Height'),plt.ylabel('Weight')
plt.show()
执行结果如下:
https://blog.csdn.net/fengbingchun/article/details/79305768

 浙公网安备 33010602011771号