
matplotlib
如果标签等要显示中文设置如下
import matplotlib.pyplot as plt

plt.rcParams['font.sans-serif']=['SimHei'] #用来正常显示中文标签

plt.rcParams['axes.unicode_minus']=False #用来正常显示负号
线图
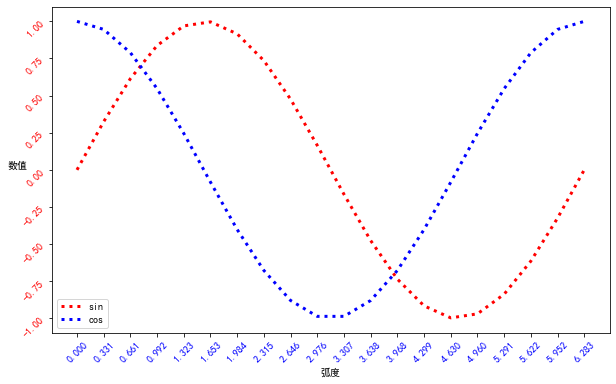
一个主图
import numpy as np
import matplotlib.pyplot as plt

#设定画布大小
fig = plt.figure(figsize=(10,6))
colors = ['red', 'blue']
x = np.linspace(0,2*np.pi,20)
y = [np.sin(x),np.cos(x)]
labels = ['sin','cos']
for i in range(2):
    plt.plot(x, y[i], c=colors[i], label=labels[i],linewidth=3.0,linestyle=':')
#设置坐标属性,显示的刻度、颜色、坐标显示倾斜角度
plt.xticks(x,color='blue',rotation=45)
plt.yticks(color='red',rotation=45)
#设置坐标轴名称
plt.xlabel('弧度')
plt.ylabel('数值',rotation=0)
#显示标签位置,print help(plt.legend)可以查看有哪些位置可以放
plt.legend(loc='best')
plt.show()
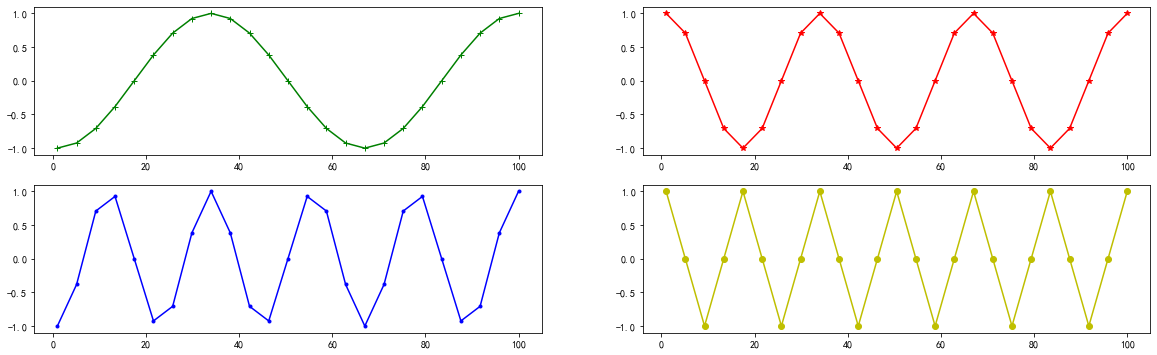
多图组合
x = np.linspace(1, 100, num= 25, endpoint = True)

def y_subplot(x,i):
    return np.cos(i * np.pi *x)

#使用subplots 画图,2*2四个子图
fig,ax = plt.subplots(2,2,figsize=(20,6))
#type(f) #matplotlib.figure.Figure

style_list = ["g+-", "r*-", "b.-", "yo-"]
#顺序和二维矩阵取法一样
ax[0][0].plot(x, y_subplot(x, 1), style_list[0])
ax[0][1].plot(x, y_subplot(x, 2), style_list[1])
ax[1][0].plot(x, y_subplot(x, 3), style_list[2])
ax[1][1].plot(x, y_subplot(x, 4), style_list[3])
subplots中的用法
#1.matplotlib中如果只画一张图的话,可以直接用pyplot,一般的做法是:

import matplotlib.pyplot as plt
plt.figure(figsize=(20,8),dpi=90) # 设置画布大小及像素
plt.xticks()  # 设置x坐标刻度
plt.yticks() # 设置y坐标刻度
plt.xlabel() # 设置x坐标名
plt.ylabel() # 设置y坐标名
plt.title() # 设置主题
plt.plot() # 画图
plt.legend(loc='') # 显示图例

#2.当需要在一张图中画两个坐标系,需要用到subplots,具体用法如下:
import matplotlib.pyplot as plt
fig,ax = plt.subplots(nrows=n,ncols=m,figsize=(20,8)) # fig为返回的图像,ax为##返回的坐标系(为一个数组)
ax[0],set_xticks() #设置各个坐标系的刻度
ax[0].set_yticks() # 需要注意,这里每个坐标系都需要单独设置刻度,坐标轴名称,主题,图例等
ax[0].set_xlabel()
ax[0].set_ylabel()
ax[0].set_title()
ax[0].legend(loc='')
ax[0].plot()

 浙公网安备 33010602011771号