Prometheus 钉钉告警实例
本文是按照实际的环境来进行部署,具体请按各自的操作环境进行修改即可;
环境配置
# 关闭防火墙
systemctl stop firewalld
systemctl disable firewalld

# 开放端口
firewall-cmd --permanent --zone=public --add-port=端口/tcp //永久

# 关闭selinux
sed -i 's/enforcing/disabled/' /etc/selinux/config  //永久
setenforce 0                                        //临时
Docker/Docker-compose安装
监控端部署
Prometheus 是当前一套非常流行的开源监控和报警系统,于 2016 年加入了 Clound Native Computing Foundation,是继 kubernates 之后的第二个托管项目。
本文讲述如何使用 docker 快速搭建 prometheus 监控系统。
概览
Prometheus负责收集数据,Grafana负责展示数据。其中采用Prometheus 中的 Exporter含:
- prometheus:负责收集和存储时间序列数据
- grafana:负责展示数据
- node-exporter:负责暴露主机 metrics 数据给 prometheus,收集 host 硬件和操作系统数据。它将以容器方式运行在所有 host 上
- cAdvisor,负责收集容器数据。它将以容器方式运行在所有 host 上
- Alertmanager,负责告警。它将以容器方式运行在所有 host 上
配置文件
$ mkdir -p /home/prometheus/{config,grafana}

# 配置报警规则文件,Prometheus配置文件,告警信息配置文件
$ touch /home/prometheus/config/alertmanager-rule.yml
$ touch /home/prometheus/config/prometheus.yml
$ touch /home/prometheus/config/alertmanager.yml

# 赋予权限访问
$ chmod 777 -R /home/prometheus
prometheus.yml
# my global config
global:
  scrape_interval:     15s # Set the scrape interval to every 15 seconds. Default is every 1 minute.
  evaluation_interval: 15s # Evaluate rules every 15 seconds. The default is every 1 minute.

# Alertmanager configuration
alerting:
  alertmanagers:
  - static_configs:
    - targets: ["188.188.4.5:9093"]
# Load rules once and periodically evaluate them according to the global 'evaluation_interval'.
rule_files:
  - "alertmanager-rule.yml"

scrape_configs:
# The job name is added as a label `job=<job_name>` to any timeseries scraped from this config.
  - job_name: 'prometheus'
    static_configs:
    - targets: ['188.188.4.5:9090']
  - job_name: 'cadvisor'
    static_configs:
    - targets: ['188.188.4.5:8080']
  - job_name: 'node-exporter'
    scrape_interval: 8s
    static_configs:
    - targets: ['188.188.4.5:9100']
alertmanager.yml
global:
  resolve_timeout: 5m
route:
  group_by: ['service', 'alertname', 'cluster']
  group_interval: 5m
  group_wait: 10s
  repeat_interval: 5m
  receiver: webhook
  routes:
  - match:
      severity: 'Critical'
    receiver: 'webhook'
  - match_re:
      severity: ^(Warning|Disaster)$
    receiver: 'webhook'
receivers:
- name: 'webhook'
  webhook_configs:
  - url: http://188.188.4.5:8060/dingtalk/webhook1/send
    send_resolved: true
alertmanager-rule.yml
groups:
- name: Warning
rules:
- alert: NodeMemoryUsage
expr: 100 - (node_memory_MemFree_bytes + node_memory_Cached_bytes + node_memory_Buffers_bytes) / node_memory_MemTotal_bytes*100 > 80
for: 1m
labels:
status: Warning
annotations:
summary: "{{$labels.instance}}: 内存使用率过高"
description: "{{$labels.instance}}: 内存使用率大于 80% (当前值: {{ $value }}"
- alert: NodeCpuUsage
expr: (1-((sum(increase(node_cpu_seconds_total{mode="idle"}[1m])) by (instance)) / (sum(increase(node_cpu_seconds_total[1m])) by (instance)))) * 100 > 70
for: 1m
labels:
status: Warning
annotations:
summary: "{{$labels.instance}}: CPU使用率过高"
description: "{{$labels.instance}}: CPU使用率大于 70% (当前值: {{ $value }}"
- alert: NodeDiskUsage
expr: 100 - node_filesystem_free_bytes{fstype=~"xfs|ext4"} / node_filesystem_size_bytes{fstype=~"xfs|ext4"} * 100 > 80
for: 1m
labels:
status: Warning
annotations:
summary: "{{$labels.instance}}: 分区使用率过高"
description: "{{$labels.instance}}: 分区使用大于 80% (当前值: {{ $value }}"
- alert: Node-UP
expr: up{job='node-exporter'} == 0
for: 1m
labels:
status: Warning
annotations:
summary: "{{$labels.instance}}: 服务宕机"
description: "{{$labels.instance}}: 服务中断超过1分钟"
- alert: TCP
expr: node_netstat_Tcp_CurrEstab > 1000
for: 1m
labels:
status: Warning
annotations:
summary: "{{$labels.instance}}: TCP连接过高"
description: "{{$labels.instance}}: 连接大于1000 (当前值: {{$value}})"
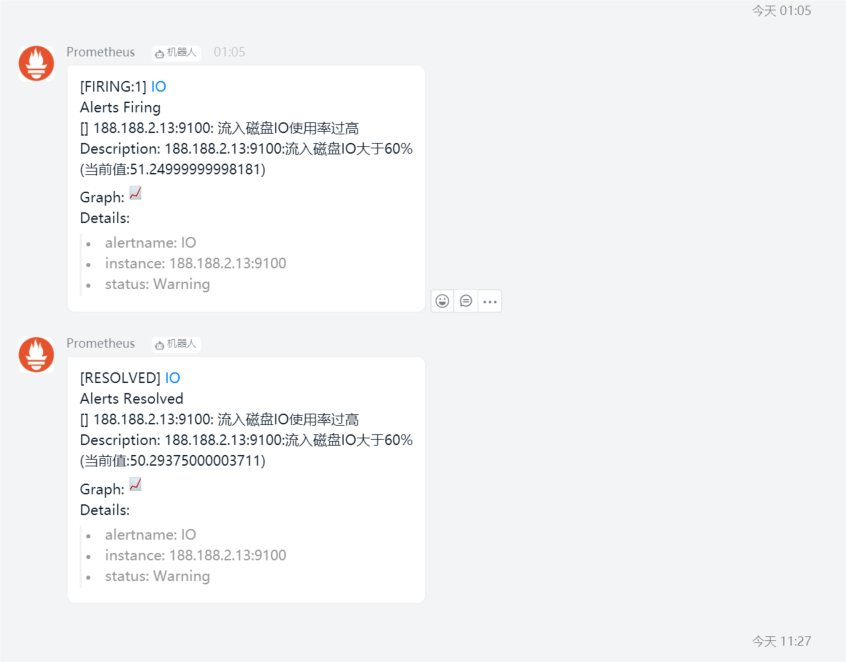
- alert: IO
expr: 100 - (avg(irate(node_disk_io_time_seconds_total[1m])) by(instance)* 100) < 60
for: 1m
labels:
status: Warning
annotations:
summary: "{{$labels.instance}}: 流入磁盘IO使用率过高"
description: "{{$labels.instance}}:流入磁盘IO大于60% (当前值:{{$value}})"
Docker-compose.yml
version: "2"
networks:
    monitor:
        driver: bridge
services:
  prometheus:
    image: prom/prometheus
    container_name: prometheus
    hostname: prometheus
    restart: always
    volumes:
    - /home/prometheus/config/prometheus.yml:/etc/prometheus/prometheus.yml
    - ./config/alertmanager-rule.yml:/etc/prometheus/alertmanager-rule.yml
    - /etc/localtime:/etc/localtime
    command:
    - '--config.file=/etc/prometheus/prometheus.yml'
    - '--storage.tsdb.path=/prometheus'
    ports:
    - "9090:9090"
    networks:
    - monitor
  prometheus-webhook-alert:
    image: timonwong/prometheus-webhook-dingtalk
    container_name: prometheus-webhook-alertmanagers
    hostname: webhook-alertmanagers
    restart: always
    volumes:
    - /etc/localtime:/etc/localtime
    ports:
    - "8060:8060"
    entrypoint: /bin/prometheus-webhook-dingtalk --ding.profile="webhook1=https://oapi.dingtalk.com/robot/send?access_token=5ee7d33bd5d9da495bc5b33dccf803cb9c14f04c9f800c2c9e89b89b8a5b07fb"
    networks:
    - monitor
  alertmanager:
    image: prom/alertmanager
    container_name: alertmanager
    hostname: alertmanager
    restart: always
    volumes:
      - ./config/alertmanager.yml:/etc/alertmanager/alertmanager.yml
      - /etc/localtime:/etc/localtime
    ports:
      - "9093:9093"
    networks:
      - monitor
  grafana:
    image: grafana/grafana
    container_name: grafana
    hostname: grafana
    restart: always
    volumes:
    - /etc/localtime:/etc/localtime
    - ./grafana:/var/lib/grafana
    ports:
    - "3000:3000"
    networks:
    - monitor
  node-exporter:
    image: quay.io/prometheus/node-exporter
    container_name: node-exporter
    hostname: node-exporter
    restart: always
    ports:
    - "9100:9100"
    networks:
    - monitor
  cadvisor:
    image: google/cadvisor:latest
    container_name: cadvisor
    hostname: cadvisor
    restart: always
    volumes:
    - /:/rootfs:ro
    - /var/run:/var/run:rw
    - /sys:/sys:ro
    - /var/lib/docker/:/var/lib/docker:ro
    - /etc/localtime:/etc/localtime
    ports:
    - "8080:8080"
    networks:
    - monitor
启动docker-compose
# 启动容器:
docker-compose -f /home/prometheus/docker-compose-monitor.yml up -d
# 删除容器:
docker-compose -f /home/prometheus/docker-compose-monitor.yml down
# 重启容器:
docker-compose -f /home/prometheus/docker-compose-monitor.yml restart
客户端部署
发布程序 node-exporter 和 cadvisor
配置文件
version: "2"
networks:
    monitor:
        driver: bridge
services:
  node-exporter:
    image: prom/node-exporter
    container_name: node-exporter
    hostname: node-exporter
    restart: always
    ports:
    - "9100:9100"
    networks:
    - monitor
  cadvisor:
    image: google/cadvisor:latest
    container_name: cadvisor
    hostname: cadvisor
    restart: always
    volumes:
    - /:/rootfs:ro
    - /var/run:/var/run:rw
    - /sys:/sys:ro
    - /var/lib/docker/:/var/lib/docker:ro
    - /etc/localtime:/etc/localtime
    ports:
    - "8080:8080"
    networks:
    - monitor
服务端修改 prometheus.yml
scrape_configs:
  - job_name: 'prometheus'
    static_configs:
    - targets: ['188.188.2.30:9090']
  - job_name: 'cadvisor'
    static_configs:
    - targets: ['188.188.2.30:8083']
    - targets: ['188.188.4.5:8080']    # 增加容器客户端采集
  - job_name: 'node-exporter'
    scrape_interval: 8s
    static_configs:
    - targets: ['188.188.2.30:9100']
    - targets: ['188.188.4.5:9100']    # 增加客户端物理采集
...                                    # 具体根据情况添加主机

 浙公网安备 33010602011771号