

介绍 (Introduction)
目标听众 (Intended audience)
This document is intended for application developers and database administrators who plan to evaluate performance for any computer hosting a SQL Server instance.
本文档适用于计划评估托管SQL Server实例的任何计算机的性能的应用程序开发人员和数据库管理员。
语境 (Context)
Let’s say a new physical server has been delivered and we have to test its performance in regards to its future destination, which is a database server. For newbies, there are a lot of questions that emerge:
假设已经交付了一个新的物理服务器,并且我们必须针对其未来的目的地(即数据库服务器)测试其性能。 对于新手,会出现很多问题:
- What has to be tested?
必须测试什么? - What solutions can be used?
可以使用什么解决方案? - What information do they provide?
他们提供什么信息? - How to use them?
如何使用它们? - Is there a tool that does all the tests I need to get a good insight into server performance or is it better to use two or more tools in conjunction?
是否有工具可以完成我所需的所有测试,以便深入了解服务器性能,还是结合使用两个或多个工具更好? - …
Most questions out there should lead us to following steps:
那里的大多数问题应引导我们执行以下步骤:
- Definition of the scope of the test
定义测试范围 - Analysis and selection of the tools available to achieve test purposes
分析和选择可用于实现测试目的的工具 - If not already done, creation of a performance report template
如果尚未完成,请创建效果报告模板 - Usage of this report template to build actual performance tests report for the server
使用此报告模板为服务器构建实际性能测试报告 - Actual performance test with results documentation in report
实际性能测试,报告中包含结果文档 - Analysis of performance test results (compared to a baseline)
性能测试结果分析(与基准相比) - Feedback on report template for continuous improvement
对报告模板的反馈,以进行持续改进
There is a bunch of tools that we can use to do a performance test:
我们可以使用许多工具来进行性能测试:
- PassMark PerformanceTest
- CPU-z
- CrystalDisk Mark
- Phoronix Test Suite (linux下使用)
- …
- PassMark PerformanceTest
- Sqlio.exe (已经废了,可改用diskspd.exe)
- HammerDb
- OStress
- …
In conjunction with these tools, it’s worth using a database monitoring tool so that we can collect and historize performance statistics. Here are some of the tools that can be used:
结合使用这些工具,值得使用数据库监视工具,以便我们可以收集和历史化性能统计数据。 以下是一些可以使用的工具:
Here are the choices made for the purpose of this article:
以下是为本文目的所做的选择:
- PassMark PerformanceTest to get a first overview of overall server performance
PassMark PerformanceTest获得服务器总体性能的初步概览 - Benchmarking with HammerDb and collecting performance statistics with sp_BlitzFirst®.
使用HammerDb进行基准测试,并使用sp_BlitzFirst®收集性能统计信息。
使用PassMark PerformanceTest获取服务器性能概述 (Getting server performance overview with PassMark PerformanceTest)
The latest version for this tool is the 9th and can be downloaded for testing (and purchase) on its dedicated web page.
该工具的最新版本是9 号 ,可以在其专用网页上下载以进行测试(和购买)。
The installation is pretty straightforward, so it won’t be reviewed here.
安装非常简单,因此这里不再进行审查。
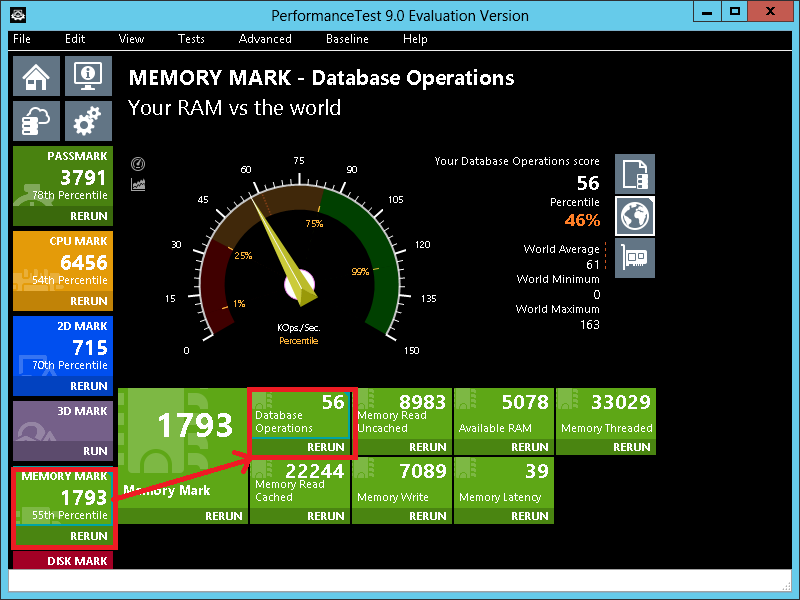
Once PerformanceTest is installed, we can launch it. We will get following window.
一旦安装PerformanceTest,我们就可以启动它。 我们将得到以下窗口。
As we can see, there are multiple options available. We will just click on “Run Benchmark” to run all the tests. We are prompted following message to which we can answer “Yes”.
我们可以看到,有多个可用选项。 我们只需单击“运行基准”即可运行所有测试。 在提示您可以回答“是”的消息后,我们会被提示。
And the benchmark begins…
基准开始……
Once the tests are done, you will get a score that you can compare to others or between computers in order to evaluate performance.
测试完成后,您将获得一个分数,可以与他人进行比较或在计算机之间进行比较,以评估性能。
Note
注意
In this example, the 3D Graphics Mark is grayed because I did the test on a virtual machine without 3D acceleration.
在此示例中,“ 3D图形标记”显示为灰色,因为我在没有3D加速的虚拟机上进行了测试。
If we get to detailed test data, we can see that there is a preamble testing for database operations:
如果获得详细的测试数据,我们可以看到对数据库操作进行了前导测试:
HammerDb的性能测试 (Performance testing with HammerDb)
HammerDb安装过程 (HammerDb Installation Process)
Go to https://www.hammerdb.com/download.html to get back the latest version of HammerDB.
请访问https://www.hammerdb.com/download.html以获取HammerDB的最新版本。
The installation process is straightforward and won’t be discussed.
安装过程非常简单,不再讨论。
SQL Server性能统计信息收集 (SQL Server Performance statistics collection)
集合存储过程 (Collection stored procedure)
While HammerDb is running, we will collect performance statistics using the sp_BlitzFirst® stored procedure from the open source project called SQL Server First Responder Kit.
在HammerDb运行时,我们将使用sp_BlitzFirst®存储过程从名为SQL Server First Responder Kit的开源项目中收集性能统计信息。
So, the first step is to get back latest version of this stored procedure and set this up to the target SQL Server instance we will be testing.
因此,第一步是获取此存储过程的最新版本,并将其设置为我们将要测试的目标SQL Server实例。
Preferably, this procedure should be installed in a database reserved to DBA usage, let’s call it [DBAMGMT].
最好将此过程安装在为DBA使用保留的数据库中,我们将其称为[DBAMGMT]。
We can check the stored procedure actually works with following statement:
我们可以使用以下语句检查存储过程是否真正起作用:
-
EXEC dbo.sp_BlitzFirst
-
@Seconds = 5,
-
@OutputDatabaseName = 'DBAMGMT',
-
@OutputSchemaName = 'Monitoring',
-
@OutputTableName = 'BlitzFirstResults',
-
@OutputTableNameFileStats = 'BlitzFirstResults_FileStats',
-
@OutputTableNamePerfmonStats = 'BlitzFirstResults_PerfmonStats',
-
@OutputTableNameWaitStats = 'BlitzFirstResults_WaitStats'
-
;
使用SQL Agent Job自动执行收集 (Automating collection with a SQL Agent Job)
This statement will be used to define a SQL Server Agent Job that will run every 10 seconds during the whole performance test.
该语句将用于定义一个SQL Server代理作业,该作业在整个性能测试期间每10秒运行一次。
Here is the code to create such a job:
这是创建此类工作的代码:
-
USE [msdb]
-
GO
-
-
/****** Object: Job [BlitzFirst - Collection] Script Date: 17-04-18 14:37:26 ******/
-
IF EXISTS (SELECT job_id FROM msdb.dbo.sysjobs_view WHERE name = N'BlitzFirst - Collection')
-
EXEC msdb.dbo.sp_delete_job @job_name = 'BlitzFirst - Collection', @delete_unused_schedule=1
-
GO
-
-
/****** Object: Job [BlitzFirst - Collection] Script Date: 17-04-18 14:37:26 ******/
-
BEGIN TRANSACTION
-
DECLARE @ReturnCode INT
-
SELECT @ReturnCode = 0
-
/****** Object: JobCategory [[Uncategorized (Local)]] Script Date: 17-04-18 14:37:26 ******/
-
IF NOT EXISTS (SELECT name FROM msdb.dbo.syscategories WHERE name=N'[Uncategorized (Local)]' AND category_class=1)
-
BEGIN
-
EXEC @ReturnCode = msdb.dbo.sp_add_category @class=N'JOB', @type=N'LOCAL', @name=N'[Uncategorized (Local)]'
-
IF (@@ERROR <> 0 OR @ReturnCode <> 0) GOTO QuitWithRollback
-
-
END
-
-
DECLARE @jobId BINARY(16)
-
select @jobId = job_id from msdb.dbo.sysjobs where (name = N'BlitzFirst - Collection')
-
if (@jobId is NULL)
-
BEGIN
-
EXEC @ReturnCode = msdb.dbo.sp_add_job @job_name=N'BlitzFirst - Collection',
-
@enabled=0,
-
@notify_level_eventlog=2,
-
@notify_level_email=2,
-
@notify_level_netsend=0,
-
@notify_level_page=0,
-
@delete_level=0,
-
@description=N'No description available.',
-
@category_name=N'[Uncategorized (Local)]',
-
@owner_login_name=N'sa',
-
@notify_email_operator_name=N'The DBA Team', @job_id = @jobId OUTPUT
-
IF (@@ERROR <> 0 OR @ReturnCode <> 0) GOTO QuitWithRollback
-
-
END
-
/****** Object: Step [Run Sp_BlitzFirst with statistics collection] Script Date: 17-04-18 14:37:26 ******/
-
IF NOT EXISTS (SELECT * FROM msdb.dbo.sysjobsteps WHERE job_id = @jobId and step_id = 1)
-
EXEC @ReturnCode = msdb.dbo.sp_add_jobstep @job_id=@jobId, @step_name=N'Run Sp_BlitzFirst with statistics collection',
-
@step_id=1,
-
@cmdexec_success_code=0,
-
@on_success_action=1,
-
@on_success_step_id=0,
-
@on_fail_action=2,
-
@on_fail_step_id=0,
-
@retry_attempts=0,
-
@retry_interval=0,
-
@os_run_priority=0, @subsystem=N'TSQL',
-
@command=N'EXEC Monitoring.sp_BlitzFirst
-
@Seconds = 5,
-
@OutputDatabaseName = ''DBAMGMT'',
-
@OutputSchemaName = ''dbo'',
-
@OutputTableName = ''BlitzFirstResults'',
-
@OutputTableNameFileStats = ''BlitzFirstResults_FileStats'',
-
@OutputTableNamePerfmonStats = ''BlitzFirstResults_PerfmonStats'',
-
@OutputTableNameWaitStats = ''BlitzFirstResults_WaitStats''
-
;
-
',
-
@database_name=N'DBAMGMT',
-
@flags=4
-
IF (@@ERROR <> 0 OR @ReturnCode <> 0) GOTO QuitWithRollback
-
EXEC @ReturnCode = msdb.dbo.sp_update_job @job_id = @jobId, @start_step_id = 1
-
IF (@@ERROR <> 0 OR @ReturnCode <> 0) GOTO QuitWithRollback
-
EXEC @ReturnCode = msdb.dbo.sp_add_jobschedule @job_id=@jobId, @name=N'sc',
-
@enabled=1,
-
@freq_type=4,
-
@freq_interval=1,
-
@freq_subday_type=2,
-
@freq_subday_interval=10,
-
@freq_relative_interval=0,
-
@freq_recurrence_factor=0,
-
@active_start_date=20180416,
-
@active_end_date=99991231,
-
@active_start_time=0,
-
@active_end_time=235959,
-
@schedule_uid=N'624dd28c-8faf-4979-88a4-947977e9a834'
-
IF (@@ERROR <> 0 OR @ReturnCode <> 0) GOTO QuitWithRollback
-
EXEC @ReturnCode = msdb.dbo.sp_add_jobserver @job_id = @jobId, @server_name = N'(local)'
-
IF (@@ERROR <> 0 OR @ReturnCode <> 0) GOTO QuitWithRollback
-
COMMIT TRANSACTION
-
GOTO EndSave
-
QuitWithRollback:
-
IF (@@TRANCOUNT > 0) ROLLBACK TRANSACTION
-
EndSave:
-
GO
Note
注意
Previous script will drop an existing SQL Agent Job. It will also create the job disabled. It will be up to the tester to enable and disable the job for his tests.
先前的脚本将删除现有SQL Agent Job。 它还将创建禁用的作业。 测试人员应根据自己的测试来启用和禁用该作业。
One needs to set the database names in red according to its desire.
需要根据需要将数据库名称设置为红色。
一些有用的查询 (Some useful queries)
You will find below some useful queries against collection tables that will allow the generation of report charts. Parts in red have to be changed before execution.
您将在下面找到一些有关收集表的有用查询,这些查询将允许生成报告图表。 红色部分必须在执行前更改。
An excel worksheet model is available to generate charts for some statistics collected during benchmark test. Its name is “MDL-0020 – sp_BlitzFirst graphs”.
Excel工作表模型可用于为基准测试期间收集的一些统计信息生成图表。 它的名称是“ MDL-0020 – sp_BlitzFirst图”。
网页预期寿命 (Page Life Expectancy)
-
select CheckDate,cntr_value as PageLifeExpectancy
-
from dbo.BlitzFirstResults_PerfmonStats
-
where counter_name ='Page life expectancy'
-
AND CheckDate BETWEEN '2018-04-16 13:10:00' AND '2018-04-16 13:33:00'
-
order by ID desc
批处理请求/秒 (Batch requests / sec)
-
select
-
CheckDate,
-
REPLACE(
-
CONVERT(VARCHAR(100),value_per_second),'.',','
-
) as BatchRequestsPerSec
-
from dbo.BlitzFirstResults_PerfmonStats
-
where counter_name ='Batch Requests/sec'
-
AND CheckDate BETWEEN '2018-04-16 13:10:00' AND '2018-04-16 13:33:00'
-
order by ID desc
服务器等待总计 (Server wait total)
-
select
-
CheckDate,value_delta as AverageWaitTimeMs
-
from dbo.BlitzFirstResults_PerfmonStats
-
where counter_name ='Average Wait Time (ms)'
-
and instance_name = '_Total'
-
AND CheckDate BETWEEN '2018-04-16 13:10:00' AND '2018-04-16 13:33:00'
服务器按类别等待 (Server wait by category)
-
select
-
CheckDate,instance_name,value_delta as AverageWaitTimeMs
-
from dbo.BlitzFirstResults_PerfmonStats
-
where counter_name ='Average Wait Time (ms)'
-
and instance_name <> '_Total'
-
AND CheckDate BETWEEN '2018-04-16 13:10:00' AND '2018-04-16 13:33:00'
测试准备 (Test preparation)
The HammerDb tools will create a database which will contain the schema and database objects used for benchmarking. This schema represents the activity of a firm with one or more warehouses.
HammerDb工具将创建一个数据库,其中将包含用于基准测试的架构和数据库对象。 该模式表示具有一个或多个仓库的公司的活动。
If it’s the first time we run this tool against SQL Server, we ought to create some test databases with different numbers of warehouses.
如果这是我们首次针对SQL Server运行此工具,则应该创建一些具有不同仓库数量的测试数据库。
创建测试数据库的步骤 (Steps to create a test database)
Let’s first review how to create a test database to use as a target for HammerDb.
让我们首先回顾一下如何创建测试数据库以用作HammerDb的目标。
To do so, we will first step create an empty database (with HammerDb) called [TPCC_x_WH] where x represents the number of warehouses we will create. The approximate (but unconfirmed) database size computation formula is 100Mb per warehouse.
为此,我们将第一步创建一个名为[TPCC_x_WH]的空数据库(使用HammerDb),其中x表示我们将创建的仓库数量。 每个仓库的近似(但不确定)数据库大小计算公式为100Mb。
Let’s start HammerDb.
让我们启动HammerDb。
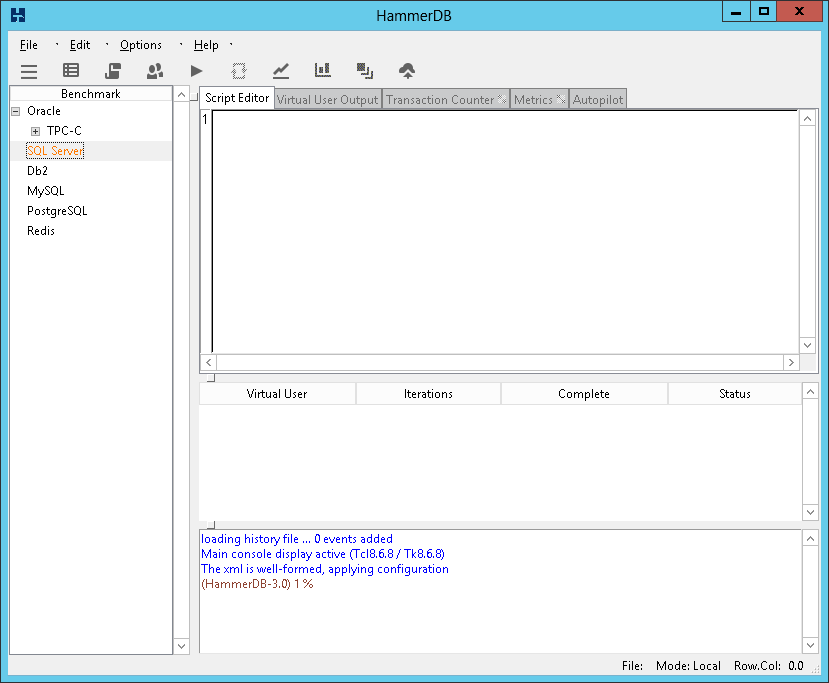
We will double-click on SQL Server and select TPCC benchmarking option (for an OLTP simulation) then click on the “OK” button.
我们将双击SQL Server并选择TPCC基准测试选项(用于OLTP模拟),然后单击“确定”按钮。
We will get a confirmation message:
我们将收到确认消息:
And the display is now for SQL Server. We can expand the “SQL Server > TPC-C “ tree node, go down to “Schema Build” and double click on Options
现在该显示适用于SQL Server。 我们可以展开“ SQL Server> TPC-C”树节点,转到“ Schema Build”,然后双击“ Options”。

We will be prompted a dialog in which we can set the actual target computer and databases so as the credentials to be used for testing.
系统将提示您一个对话框,在其中可以设置实际的目标计算机和数据库,以作为用于测试的凭据。
Here is an example of one warehouse:
这是一个仓库的示例:
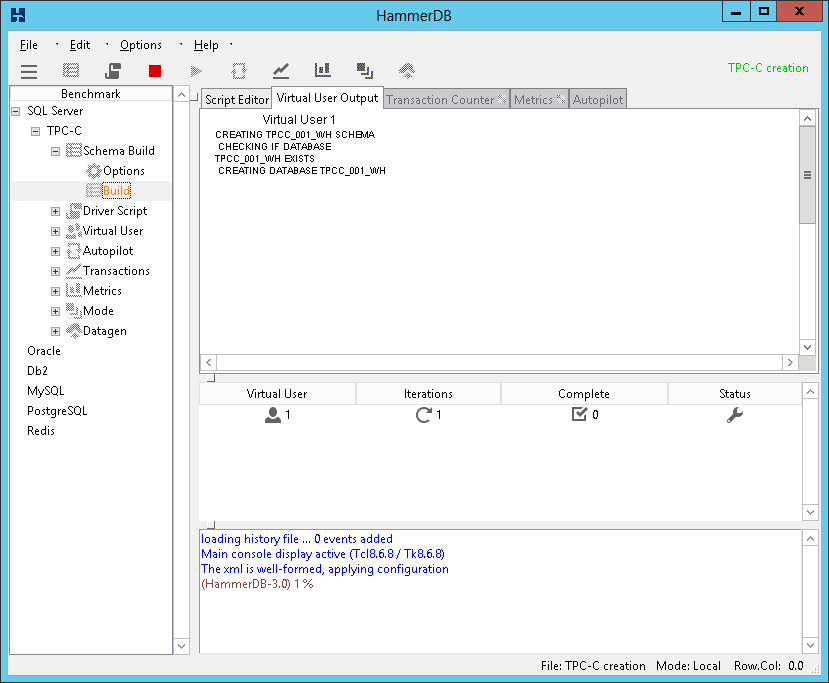
Once you hit “OK”, double-click on the “Build” leaf. A confirmation will be asked.
单击“确定”后,双击“构建”叶子。 将要求确认。
Once, we clicked on the “Yes” button, we will have to wait for HammerDb to complete the creation of its testing schema:
一次,我们单击“是”按钮,我们将不得不等待HammerDb完成其测试架构的创建:
Once the creation is complete, you will see following message (green box).
创建完成后,您将看到以下消息(绿色框)。
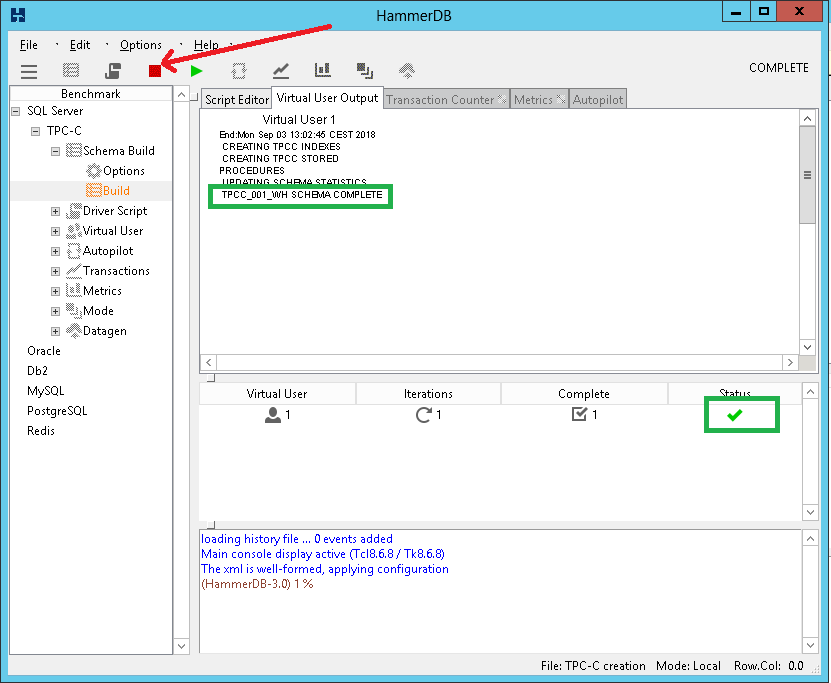
Hit the red stop button to stop the thread used to create the database.
点击红色的停止按钮以停止用于创建数据库的线程。
Now the database is ready and as we won’t stop at this point for performance testing, it’s worth taking a backup of this database.
现在数据库已经准备就绪,并且由于我们现在不会停止进行性能测试,因此值得备份该数据库。
为基准创建的数据库 (Databases to create for benchmark)
Four databases should be created and backed up on the lowest version of SQL Server with following a number of warehouses.
应该创建四个数据库,并在具有多个仓库的最低版本SQL Server上进行备份。
|
Number of warehouses |
Experienced size on disk |
Experienced backup size (compressed) |
|
1 |
150 Mb |
53 Mb |
|
5 |
416 Mb |
238 Mb |
|
100 |
8100 Mb |
4.5 Gb |
|
500 |
39.75 Gb |
22.6 Gb |
|
仓库数量 |
磁盘上的经验大小 |
经验丰富的备份大小(压缩) |
|
1个 |
150 Mb |
53兆位 |
|
5 |
416 Mb |
238 Mb |
|
100 |
8100 Mb |
4.5 Gb |
|
500 |
39.75 Gb |
22.6 Gb |
Note
注意
It’s strongly recommended to take backups of these databases as the creation process is really time-consuming.
强烈建议对这些数据库进行备份,因为创建过程确实很耗时。
测试定义 (Test Definition)
Here are the steps to follow to fire a test against a given [TPCC_x_DW] database. We will assume you let HammerDb open.
以下是针对给定的[TPCC_x_DW]数据库进行测试的步骤。 我们假设您让HammerDb打开。
测试用例脚本生成 (Test case script generation)
Expand “Driver Script” node and double-click on the “Options” leaf.
展开“驱动程序脚本”节点,然后双击“选项”叶。
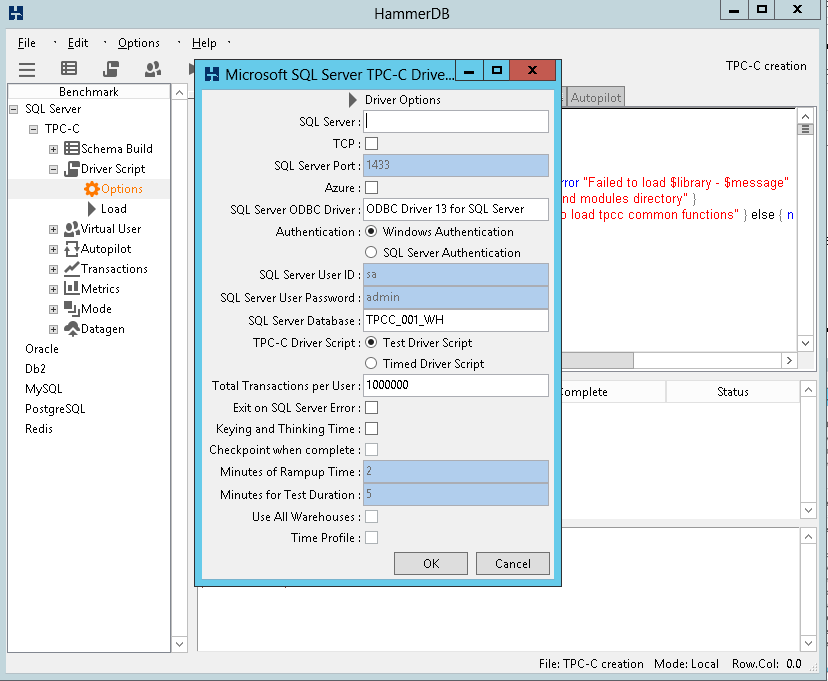
Actions to be done:
要做的动作:
- Edit server, database and credential settings
编辑服务器,数据库和凭据设置 - Select “Timed Test Driver Script”
选择“定时测试驱动程序脚本” - Keep the default ramp-up settings.
保留默认的加速设置。 - Adjust the test duration to 10 minutes
将测试时间调整为10分钟 - Keep “Use All warehouses” box unchecked
取消选中“使用所有仓库”框 - documentation page for further details) 文档页面 )
- Click on the “OK” button
点击“确定”按钮
The settings dialog should look as follows after step 6:
步骤6之后,设置对话框应如下所示:
Note:
注意事项 :
We could also check the “Checkpoint when complete” option if we use the AutoPilot mode that we will discuss in following subsection.
如果我们使用将在以下小节中讨论的AutoPilot模式,也可以选中“完成时检查点”选项。
Now the options are set, we can generate the script that will be used by HammerDb. This is done by clicking on the “Load” leaf of tree hierarchy in the left panel:
现在设置了选项,我们可以生成将由HammerDb使用的脚本。 通过单击左侧面板中树状层次结构的“加载”叶子来完成此操作:
虚拟用户创建 (Virtual users creation)
Now it’s time to tell HammerDb how many users will be using the database defined in “Driver Script” options.
现在是时候告诉HammerDb,将有多少用户使用“驱动程序脚本”选项中定义的数据库。
Virtual users refer to threads that will be created by HammerDb during the test. Their number can be configured in the “Virtual Users” node.
虚拟用户引用测试期间HammerDb将创建的线程。 可以在“虚拟用户”节点中配置其编号。
Most of the time, we will fire more than one test where only the number of virtual users vary. There are two ways to make it. The first one is to perform as many tests as virtual users count variations. The other one is to use the “Autopilot” mode of HammerDb.
在大多数情况下,我们将触发不止一个测试,其中仅虚拟用户数量有所不同。 有两种方法可以实现。 第一个是执行与虚拟用户计算变化数量一样多的测试。 另一种是使用HammerDb的“自动驾驶”模式。
To enable the Autopilot mode, we will expand the “Autopilot” node and double-click on “Options”. This opens up a dialog in which we will select the “Autopilot enabled”:
要启用自动驾驶模式,我们将展开“自动驾驶”节点,然后双击“选项”。 这将打开一个对话框,我们将在其中选择“启用自动驾驶”:
As we have a ramp-up of 2 minutes and test duration set to 10 minutes, we will set minutes per test value to 15 to be sure everything is ok.
因为我们有2分钟的加速时间,并且测试持续时间设置为10分钟,所以我们将每个测试值的分钟设置为15,以确保一切正常。
We will also replace the default virtual user sequence by following:
我们还将通过以下方式替换默认的虚拟用户序列:
3 5 9 17 25 37 49 65 97 129 197 257
3 5 9 17 25 37 49 65 97 129 197 257
Note
注意
Feel free to create your own virtual user’s number sequence based on the requirements for the application that will be using SQL Server.
根据将要使用SQL Server的应用程序的要求,随意创建自己的虚拟用户的号码序列。
For instance, an alternative could be:
例如,一种替代方法可能是:
3 11 101 201 501 1001 1501 2001
3 11 101 201 501 1001 1501 2001
Anyway, with the first sequence, the dialog will look like this:
无论如何,对于第一个序列,对话框将如下所示:
We can click on the “OK” button to close the dialog.
我们可以单击“确定”按钮关闭对话框。
Before digging into the execution of AutoPilot mode, there is a step not to forget: the activation of the performance statistics collection job.
在深入了解执行AutoPilot模式之前,有一个不可忘记的步骤:激活性能统计信息收集作业。
This can be done with following T-SQL statement:
可以使用以下T-SQL语句完成此操作:
-
EXEC msdb.dbo.sp_update_job
-
@job_name = N'BlitzFirst - Collection',
-
@enabled = 1 ;
-
GO
测试执行 (Test execution)
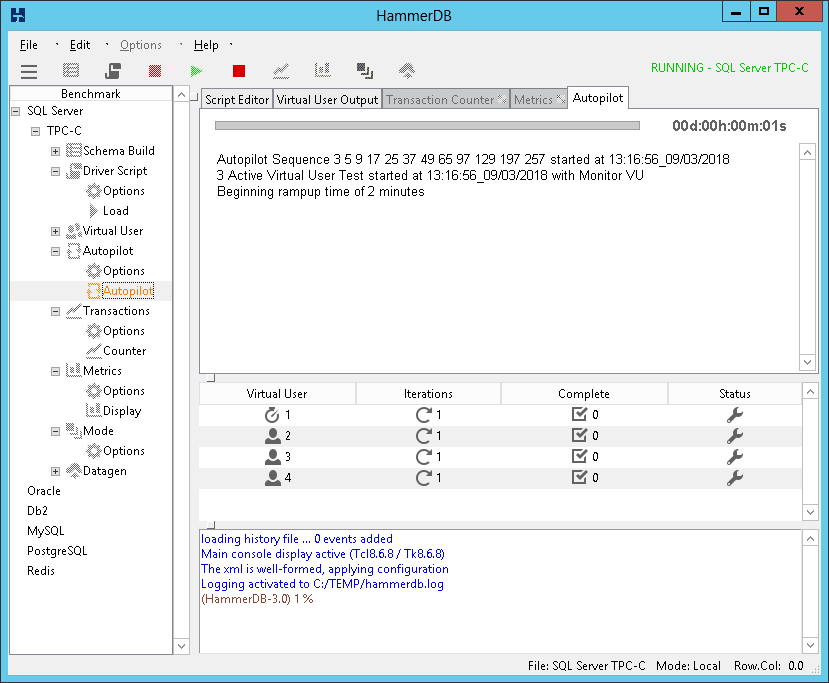
Now, everything is ready and we can double-click on the Autopilot button:
现在,一切就绪,我们可以双击“自动驾驶”按钮:
It will open an “Autopilot” tab in the central pane:
它将在中央窗格中打开“自动驾驶”选项卡:
As soon as a test is finished, there will be a “TEST RESULT” line showing the observed number of transactions per minute and the observed number of order created per minute.
测试完成后,将出现“ TEST RESULT”(测试结果)行,显示观察到的每分钟交易数和观察到的每分钟创建的订单数。
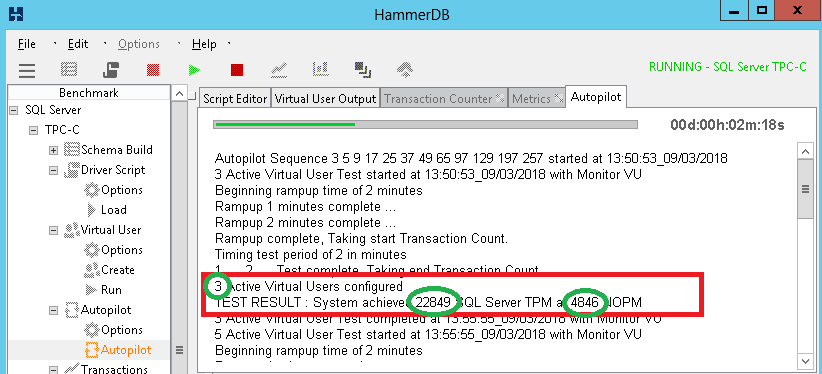
We could keep track of these two numbers associated with the number of configured virtual users in order to create charts like this one:
我们可以跟踪与已配置的虚拟用户数量相关的这两个数字,以创建类似这样的图表:
You could also create charts with SQL Server statistics like “Page Life Expectancy” or “Average Wait Time (ms)”. As we can find the time window during which a test occurred, it’s pretty easy to restrict data sets to just this time window.
您还可以使用SQL Server统计信息(例如“页面预期寿命”或“平均等待时间(ms)”)创建图表。 由于我们可以找到进行测试的时间范围,因此很容易将数据集限制为该时间范围。
翻译自: https://www.sqlshack.com/how-to-perform-a-performance-test-against-a-sql-server-instance/
附加信息:
2. About TPCC

 浙公网安备 33010602011771号