

以下内容主要来源于网络,同时结合了一部分自己的测试数据
介绍 (Introduction )
As DBAs, we all get to the point where we are asked to setup a new server for a specific environment. Setting up a new server is not a big thing but giving the answer to the question that “how well it will work” might be tricky.
作为DBA,我们所有人都被要求为特定环境设置新服务器。 设置新服务器不是一件大事,但是要回答“它将如何运行”这个问题可能会很棘手。
There are tons of items which we can setup to measure how well the newly installed server will response but here I will discuss one of the most important resource of the server “Disk”. Most often the disk is not measured correctly or I have seen environments where the disk response time has never been measured. I will discuss here a tool from Microsoft which is very handy and can solve your problem very quickly. The diskspd.exe!
我们可以设置很多项目来衡量新安装的服务器将如何响应,但是在这里,我将讨论服务器“磁盘”的最重要资源之一。 大多数情况下,磁盘测量不正确,或者我见过从未测量过磁盘响应时间的环境。 我将在这里讨论Microsoft提供的一种非常方便的工具,它可以很快解决您的问题。 diskspd.exe!
It’s the superseding version of SQLIO which was previously used to measure IO response time for disk. The source code of diskspd.exe is hosted on GitHub. You can download this free utility from Microsoft’s website using this link.
它是SQLIO的替代版本,以前用于衡量磁盘的IO响应时间。 diskspd.exe的源代码托管在GitHub上 。 您可以使用此链接从Microsoft网站下载此免费实用程序。
After you will download the utility you will get a zip file. Just unzip the file and it will give you the folders and files as shown in the below screenshot. You will be needing the exe of diskspd inside the folder “amd64fre” if you have a SQL Server 64-bit version (most of us will be having this).
下载该实用程序后,您将获得一个zip文件。 只需解压缩文件,它将为您提供文件夹和文件,如以下屏幕截图所示。 如果您使用的是SQL Server 64位版本,则需要在“ amd64fre”文件夹中使用diskspd的exe文件(我们大多数人都拥有该版本)。
让我们开始吧 (Let’s get started)
Now we can start the actual tests using the utility. To simplify things for the test we can copy appropriate executable file to a folder in C Drive like “C:\diskspd_test” and create a folder in the drive which you want to test like for this instance H Drive and I created a folder TestLoad in H Drive.
现在,我们可以使用该实用程序开始实际测试。 为了简化测试,我们可以将适当的可执行文件复制到C驱动器中的文件夹,例如“ C:\ diskspd_test”,并在要测试的驱动器中创建一个文件夹,例如本实例H Drive,并在其中创建一个文件夹TestLoad。 H盘。
The utility is capable enough to create a good load file for you and test it for read and write. Though there are many ways to customize your testing but I will suggest you to start with a simple yet with solid results.
该实用程序足以为您创建一个良好的加载文件,并对其进行读写测试。 尽管有很多方法可以自定义您的测试,但是我建议您从一个简单而可靠的结果开始。
Mentioned below is the test arguments I used. I will explain each argument I used.
下面提到的是我使用的测试参数。 我将解释我使用的每个参数。
Sample Command Line Argument:
示例命令行参数:
diskspd -b64k –d120 –o32 –t4 –h –r –w25 –L –c2G D:\TestLoad\TestLoad.dat > diskspd_resultdetails.txt
diskspd -b64k –d120 –o32 –t4 –h –r –w25 –L –c2G D:\ TestLoad \ TestLoad.dat> diskspd_resultdetails.txt
- -b64k: This indicates that a 64KB block size will be used for the load. This is good because ideally speaking your drives should be formatted by 64K block size. Though you can increase or decrease it based on your custom built environment.
-b64k:这表明将使用64KB的块大小进行加载。 这很好,因为理想情况下,您的驱动器应采用64K块大小进行格式化。 尽管您可以根据自定义构建的环境来增加或减少它。 - -d120: This means that the duration of the test will be 120 seconds. You can span it to more time if you want to test the disk with larger and longer loads. Which is a good idea.
-d120:这意味着测试的持续时间将为120秒。 如果要使用更大和更长的负载测试磁盘,则可以将其花费更多时间。 这是个好主意。 - -o32: This is the number of outstanding I/O operations which is like your queue length.
-o32:这是未完成的I / O操作的数量,类似于您的队列长度。 - -t4: This means that each file will have 4 threads attached to it. I have 4 core processor so I added 4 and you can customize it to match your server specifications.
-t4:这意味着每个文件将具有4个附加线程。 我有4个核心处理器,因此我添加了4个,您可以对其进行自定义以匹配您的服务器规格。 - -h: This will disable the software and hardware buffering to mimic SQL Server.
-h:这将禁用软件和硬件缓冲来模仿SQL Server。 - -r: The utility can perform sequential reads (default) or random read. I would prefer to use random reads. The r argument is to specifically ask utility to do only random reads.
-r:该实用程序可以执行顺序读取(默认)或随机读取。 我宁愿使用随机读取。 r参数是专门要求实用程序仅进行随机读取。 - -w25: The utility can do reads and writes test and by default it only does the read. But we want read and writes both. It’s a good idea to split a SQL Server load to 25% Writing and 75% reading. Though you can test your disk as per your requirements like for log files you should only specify –w100 to only test writing.-w25:该实用程序可以读取和写入测试,并且默认情况下它仅读取。 但是我们要同时读写。 将SQL Server的负载分成25%写入和75%读取是一个好主意。 尽管您可以按照日志文件等要求来测试磁盘,但仅应指定–w100以仅测试写入。
- -L : 记录IO延时的统计数据(Avglat )
- -c2G: This will create a test load file of 2 GB on the specified location.
-c2G:这将在指定位置创建2 GB的测试加载文件。 - > “diskspd_resultdetails.txt”: This is the filename of the results. The file will be created in the C Drive where you will place the diskspd.exe file, in this case, “C:\diskspd_test”.
>“ diskspd_resultdetails.txt”:这是结果的文件名。 该文件将在C驱动器中创建,您将在其中放置diskspd.exe文件,在本例中为“ C:\ diskspd_test”。
Well the test will run for 2 minutes in this case and it will do the specified work you mentioned in the arguments. After the test has been run completely it will generate the results file and then you will read and analyze the file.
那么在这种情况下,测试将运行2分钟,它将完成您在参数中提到的指定工作。 完全运行测试后,它将生成结果文件,然后您将读取并分析该文件。
让我们继续阅读我的结果 (Let’s go ahead and read what my results are)
The first part of the results which is shown below tells us what arguments and settings the utility will use to test the load. So, all the arguments explained earlier are mentioned in further details by the utility itself.
结果的第一部分如下所示,它告诉我们实用程序将用来测试负载的参数和设置。 因此,实用程序本身会进一步详细介绍前面解释的所有参数。
中央处理器 (The CPU)
The second part of the results shows how the CPU behaved while the load was executed. All the results will have two parts, first will be detailed for each resource and the last will be average or total. So we can quickly go to the last part just to see how was the average CPU while the load was executed to see if we have CPU bottleneck or its perfectly suits our load.
结果的第二部分显示了执行加载时CPU的行为。 所有结果将分为两部分,第一部分将详细说明每种资源,最后一部分是平均值或总计。 因此,我们可以快速转到最后一部分,只是看看执行负载时的平均CPU状况如何,看看我们是否有CPU瓶颈或它完全适合我们的负载。
磁盘 (The Disk)
The third part is the core of all the utility, the disk! This again has different parts in the results.
第三部分是磁盘的所有实用程序的核心! 这在结果中又有不同的部分。
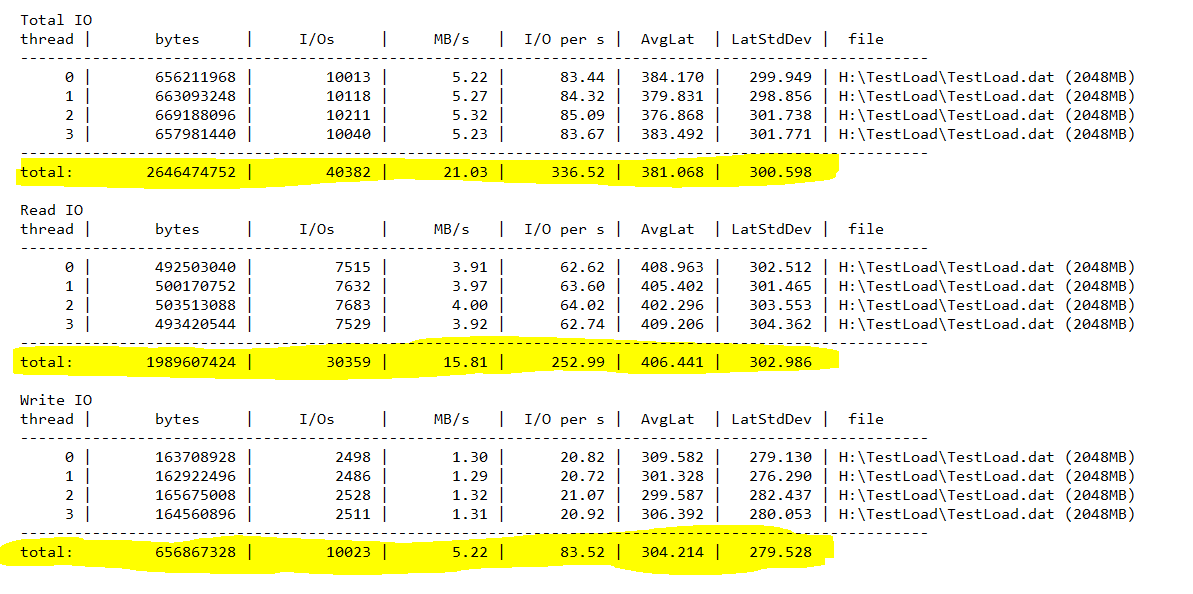
First part shows the Total IO as a Summary to see how well the disk responded. You can see the “AvgLat” column to see the Average Latency of the disk for total IO. Not to go into the details of the latency but generally speaking it should remain under 20ms. If it goes beyond then you have serious issues with your server. (I know my system sucks but the drive is an OLD SATA III).
第一部分以汇总形式显示总IO,以查看磁盘的响应情况。 您可以查看“ AvgLat”列,以查看磁盘的平均IO延迟。 不赘述延迟的细节,但是通常来说,它应该保持在20ms以下。 如果超出此范围,则说明您的服务器存在严重问题。 (我知道我的系统很烂,但是驱动器是OLD SATA III)。
The I/Os can on the lower side as the load is divided on worker threads so you can directly go to the TOTAL column highlighted in the below screenshot which will show you the total load (in 64k block size in our case).
由于负载是在工作线程上分配的,因此I / O可以位于下方,因此您可以直接转到下面的屏幕快照中突出显示的TOTAL列,该列将向您显示总负载(本例中为64k块大小)。
The Second part shows Reads and third part shows Writes. This is most important part of the results. You can go into the details of every column but the Latency should be kept in mind as this is the main reason for slowness when the actual load will be executed by the users. This clearly shows how well your disk is performing under your load for reads and writes.
第二部分显示读取,第三部分显示写入。 这是结果中最重要的部分。 您可以进入每一列的详细信息,但应牢记等待时间,因为这是用户执行实际加载时速度缓慢的主要原因。 这清楚地显示了磁盘在负载下的读写性能。
The last part of the results is dedicated to the latency and shows how well the disk performed while the load was executed. This numbers are in milliseconds and you can focus on minimum and maximum. So keep in mind that the best case scenario will be minimum and the worst case scenario will be max and that will be the time when your server will be in peak hours.
结果的最后一部分专用于等待时间,并显示磁盘在执行加载时的性能。 此数字以毫秒为单位,您可以专注于最小值和最大值。 因此请记住,最好的情况是最小,最坏的情况是最大,这就是服务器处于高峰时段的时间。下图表示 99%的写操作等待在726ms以内
Now, after having the knowledge of this awesome utility, you can design multiple test load for different environment and run them so see how storage system and CPU is performing. The detailed tests can give your insight and you can modify the load of upgrade your resources accordingly to your needs.
现在,在了解了该实用工具之后,您可以针对不同的环境设计多个测试负载并运行它们,从而了解存储系统和CPU的性能。 详细的测试可以提供您的见解,并且您可以根据需要修改资源升级的负担。
重点:
1.测试结果解读
- thread:生成IO的线程的编号
- bytes:为测试传输的总字节数
- I/Os:为测试执行的IO操作总数
- MB/s:吞吐量,以MB /秒为单位
- I/O per s:每秒的IO操作数
- AvgLat:测试的所有IO操作的平均延迟
- IopsStdDev:每秒IO操作的标准偏差
- LatStdDev:测试遇到的延迟的标准偏差
- file:IO测试中使用的文件的路径
2. Microsoft建议日志延迟应该在1-5ms到数据延迟应该在4-20ms之间(看99th那一行)。
3. 对于IO 汇总 AvgLat ,一般建议保证在20ms以下。
3. 我的测试指令:
a) diskspd -c2G -b4k -t6 -d120 -o32 -w25 -h -r -L D:\DISKTEST\DiskTest.dat>DiskTestResult.txt
解读:测试文件大小为2G,Block4K,CPU6核,测试时间120秒,排队队列32,25%的写操作,disable缓存,使用随机读写模式,记录IO延时统计数据
结果:(普通硬盘)
Total IO
thread |       bytes     |     I/Os     |    MiB/s   |  I/O per s |  AvgLat  | LatStdDev |  file
-----------------------------------------------------------------------------------------------------
     0 |        38486016 |         9396 |       0.31 |      78.29 |  408.565 |   118.066 | D:\DISKTEST\DiskTest.dat (2048MiB)
     1 |        38592512 |         9422 |       0.31 |      78.51 |  407.136 |   118.476 | D:\DISKTEST\DiskTest.dat (2048MiB)
     2 |        38592512 |         9422 |       0.31 |      78.51 |  407.246 |   117.989 | D:\DISKTEST\DiskTest.dat (2048MiB)
     3 |        38256640 |         9340 |       0.30 |      77.82 |  410.640 |   119.603 | D:\DISKTEST\DiskTest.dat (2048MiB)
     4 |        38367232 |         9367 |       0.30 |      78.05 |  409.907 |   119.284 | D:\DISKTEST\DiskTest.dat (2048MiB)
     5 |        38563840 |         9415 |       0.31 |      78.45 |  407.491 |   118.897 | D:\DISKTEST\DiskTest.dat (2048MiB)
-----------------------------------------------------------------------------------------------------
total:         230858752 |        56362 |       1.83 |     469.63 |  408.493 |   118.727

Read IO
thread |       bytes     |     I/Os     |    MiB/s   |  I/O per s |  AvgLat  | LatStdDev |  file
-----------------------------------------------------------------------------------------------------
     0 |        28897280 |         7055 |       0.23 |      58.78 |  427.586 |   120.882 | D:\DISKTEST\DiskTest.dat (2048MiB)
     1 |        28798976 |         7031 |       0.23 |      58.58 |  426.931 |   121.353 | D:\DISKTEST\DiskTest.dat (2048MiB)
     2 |        28774400 |         7025 |       0.23 |      58.53 |  426.371 |   121.530 | D:\DISKTEST\DiskTest.dat (2048MiB)
     3 |        28983296 |         7076 |       0.23 |      58.96 |  429.600 |   122.549 | D:\DISKTEST\DiskTest.dat (2048MiB)
     4 |        28844032 |         7042 |       0.23 |      58.68 |  428.898 |   122.391 | D:\DISKTEST\DiskTest.dat (2048MiB)
     5 |        29061120 |         7095 |       0.23 |      59.12 |  425.737 |   122.086 | D:\DISKTEST\DiskTest.dat (2048MiB)
-----------------------------------------------------------------------------------------------------
total:         173359104 |        42324 |       1.38 |     352.66 |  427.521 |   121.809

Write IO
thread |       bytes     |     I/Os     |    MiB/s   |  I/O per s |  AvgLat  | LatStdDev |  file
-----------------------------------------------------------------------------------------------------
     0 |         9588736 |         2341 |       0.08 |      19.51 |  351.242 |    86.808 | D:\DISKTEST\DiskTest.dat (2048MiB)
     1 |         9793536 |         2391 |       0.08 |      19.92 |  348.926 |    86.413 | D:\DISKTEST\DiskTest.dat (2048MiB)
     2 |         9818112 |         2397 |       0.08 |      19.97 |  351.195 |    84.981 | D:\DISKTEST\DiskTest.dat (2048MiB)
     3 |         9273344 |         2264 |       0.07 |      18.86 |  351.381 |    86.255 | D:\DISKTEST\DiskTest.dat (2048MiB)
     4 |         9523200 |         2325 |       0.08 |      19.37 |  352.387 |    86.911 | D:\DISKTEST\DiskTest.dat (2048MiB)
     5 |         9502720 |         2320 |       0.08 |      19.33 |  351.693 |    87.491 | D:\DISKTEST\DiskTest.dat (2048MiB)
-----------------------------------------------------------------------------------------------------
total:          57499648 |        14038 |       0.46 |     116.97 |  351.126 |    86.480


total:
  %-ile |  Read (ms) | Write (ms) | Total (ms)
----------------------------------------------
    min |     62.458 |     53.469 |     53.469
   25th |    349.814 |    306.970 |    333.438
   50th |    406.073 |    336.431 |    385.444
   75th |    491.828 |    383.219 |    469.898
   90th |    584.877 |    471.069 |    562.338
   95th |    649.373 |    514.116 |    625.250
   99th |    801.007 |    601.934 |    775.135
b) diskspd -c2G -b4k -t6 -d120 -o32 -w25 -h -r -L C:\DISKTEST\DiskTest.dat>DiskTestResult.txt
解读:测试文件大小为2G,Block4K,CPU6核,测试时间120秒,排队队列32,25%的写操作,disable缓存,使用随机读写模式,记录IO延时统计数据
结果:(SSD硬盘)
Total IO
thread |       bytes     |     I/Os     |    MiB/s   |  I/O per s |  AvgLat  | LatStdDev |  file
-----------------------------------------------------------------------------------------------------
     0 |      1500712960 |       366385 |      11.93 |    3052.90 |   10.483 |     7.325 | C:\DISKTEST\DiskTest.dat (2048MiB)
     1 |      1482653696 |       361976 |      11.78 |    3016.16 |   10.611 |     7.504 | C:\DISKTEST\DiskTest.dat (2048MiB)
     2 |      1499291648 |       366038 |      11.91 |    3050.01 |   10.493 |     7.315 | C:\DISKTEST\DiskTest.dat (2048MiB)
     3 |      1504612352 |       367337 |      11.96 |    3060.83 |   10.456 |     7.276 | C:\DISKTEST\DiskTest.dat (2048MiB)
     4 |      1507360768 |       368008 |      11.98 |    3066.42 |   10.437 |     7.257 | C:\DISKTEST\DiskTest.dat (2048MiB)
     5 |      1508380672 |       368257 |      11.99 |    3068.50 |   10.430 |     7.260 | C:\DISKTEST\DiskTest.dat (2048MiB)
-----------------------------------------------------------------------------------------------------
total:        9003012096 |      2198001 |      71.54 |   18314.83 |   10.485 |     7.323

Read IO
thread |       bytes     |     I/Os     |    MiB/s   |  I/O per s |  AvgLat  | LatStdDev |  file
-----------------------------------------------------------------------------------------------------
     0 |      1124831232 |       274617 |       8.94 |    2288.24 |    9.188 |     6.477 | C:\DISKTEST\DiskTest.dat (2048MiB)
     1 |      1111691264 |       271409 |       8.83 |    2261.51 |    9.319 |     6.683 | C:\DISKTEST\DiskTest.dat (2048MiB)
     2 |      1125097472 |       274682 |       8.94 |    2288.79 |    9.210 |     6.502 | C:\DISKTEST\DiskTest.dat (2048MiB)
     3 |      1128062976 |       275406 |       8.96 |    2294.82 |    9.186 |     6.499 | C:\DISKTEST\DiskTest.dat (2048MiB)
     4 |      1129492480 |       275755 |       8.98 |    2297.73 |    9.147 |     6.421 | C:\DISKTEST\DiskTest.dat (2048MiB)
     5 |      1130487808 |       275998 |       8.98 |    2299.75 |    9.159 |     6.474 | C:\DISKTEST\DiskTest.dat (2048MiB)
-----------------------------------------------------------------------------------------------------
total:        6749663232 |      1647867 |      53.64 |   13730.84 |    9.201 |     6.509

Write IO
thread |       bytes     |     I/Os     |    MiB/s   |  I/O per s |  AvgLat  | LatStdDev |  file
-----------------------------------------------------------------------------------------------------
     0 |       375881728 |        91768 |       2.99 |     764.66 |   14.360 |     8.287 | C:\DISKTEST\DiskTest.dat (2048MiB)
     1 |       370962432 |        90567 |       2.95 |     754.65 |   14.484 |     8.441 | C:\DISKTEST\DiskTest.dat (2048MiB)
     2 |       374194176 |        91356 |       2.97 |     761.22 |   14.353 |     8.213 | C:\DISKTEST\DiskTest.dat (2048MiB)
     3 |       376549376 |        91931 |       2.99 |     766.01 |   14.260 |     8.107 | C:\DISKTEST\DiskTest.dat (2048MiB)
     4 |       377868288 |        92253 |       3.00 |     768.70 |   14.294 |     8.186 | C:\DISKTEST\DiskTest.dat (2048MiB)
     5 |       377892864 |        92259 |       3.00 |     768.75 |   14.232 |     8.106 | C:\DISKTEST\DiskTest.dat (2048MiB)
-----------------------------------------------------------------------------------------------------
total:        2253348864 |       550134 |      17.91 |    4583.99 |   14.330 |     8.224


total:
  %-ile |  Read (ms) | Write (ms) | Total (ms)
----------------------------------------------
    min |      1.192 |      5.102 |      1.192
   25th |      7.417 |     11.318 |      7.665
   50th |      8.113 |     12.598 |      8.534
   75th |      8.795 |     13.934 |     10.418
   90th |      9.455 |     15.456 |     13.655
   95th |     10.064 |     37.290 |     15.524
   99th |     47.431 |     52.469 |     48.958
结论:对比以上红色hightlight的数值,我们不难发现ssd硬盘与普通硬盘差异是很大的。
5.写了一个批处理:diskiotest.bat
diskspd.exe -c2G -b4k -t4 -d120 -o20 -w50 -h -r -L  C:\DiskIOTest\DiskTest.dat>DiskTestResult-C.txt
diskspd.exe -c2G -b4k -t4 -d120 -o20 -w50 -h -r -L  D:\DiskIOTest\DiskTest.dat>DiskTestResult-D.txt
diskspd.exe -c2G -b4k -t4 -d120 -o20 -w50 -h -r -L  E:\DiskIOTest\DiskTest.dat>DiskTestResult-E.txt
rd /S /Q C:\DiskIOTest
rd /S /Q D:\DiskIOTest
rd /S /Q E:\DiskIOTest

 浙公网安备 33010602011771号