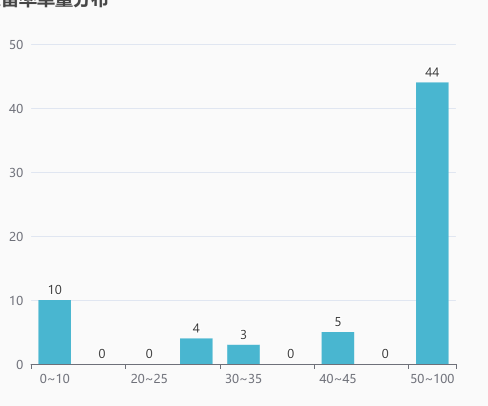
echarts 简单使用
1.下载安装echars图表
npm install echarts --save
2.局部引入import * as echarts from 'echarts'
3.使用echars
<div id="userCount" style="height:450px" />
 data(){
       return{
     chart: null, // 图表名
  }
}
  initCharts() {
      this.chart = echarts.init(document.getElementById('userCount'))
      this.setOptions()
    },
    // 图标绘制
    setOptions() {
      this.chart.setOption({
        title: {
          text: '次留率的人员分布' // title 名称
        },
        tooltip: {},
        xAxis: {
          type: 'category',
          data: this.remainDistri.remainRate
        },
        yAxis: {
          type: 'value'
        },
        color: '#52b18e', // 图表颜色
        series: [{
          data: this.remainDistri.userCount,
          type: 'bar', // bar柱状图  line 折线图
          itemStyle: {
            normal: {
              label: {
                show: true, // 开启显示数值
                position: 'top' // 在上方
              },
              textStyle: { // 数值样式
                color: 'black',
                fontSize: 16
              }
            }
          }

        }]
      })
    }

echart -tooltip 更多关于鼠标悬浮显示提示框内容 https://www.cnblogs.com/carriezhao/p/11934170.html


 浙公网安备 33010602011771号