

python+matplotlib制作雷达图3例分析和pandas读取csv操作
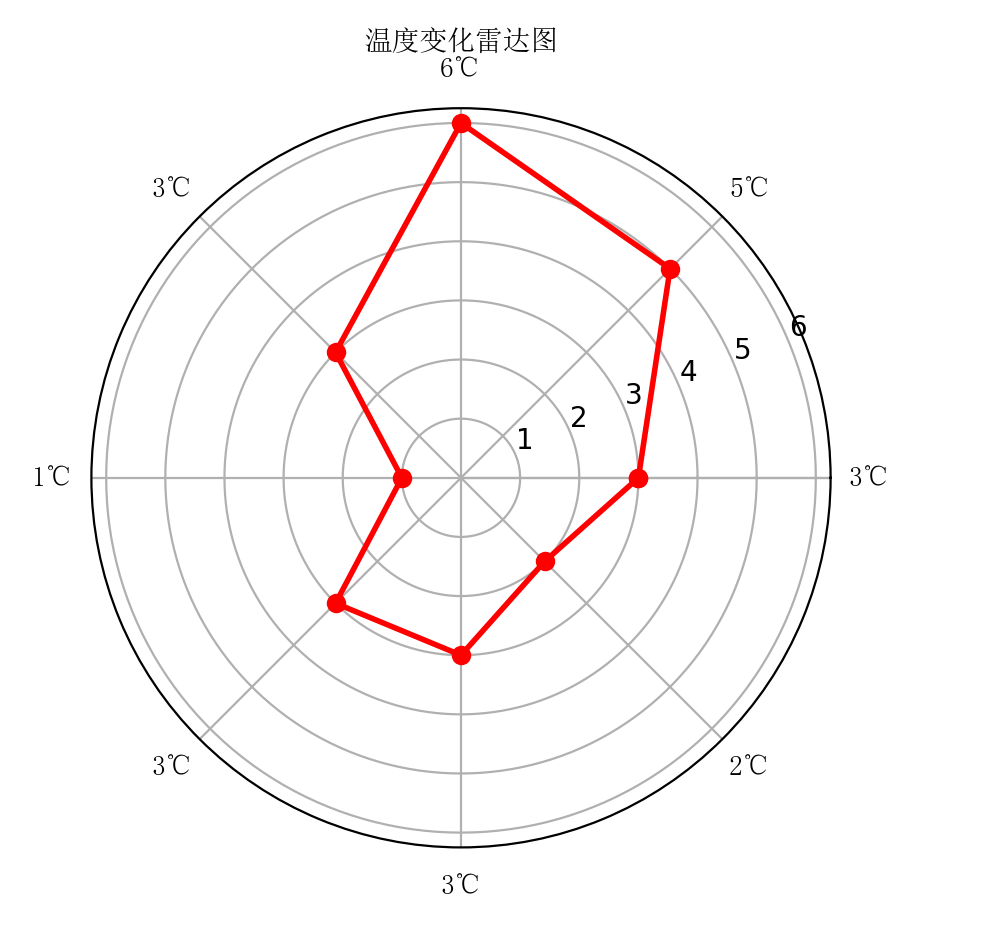
1.例一
图1
代码1


#第1步:导出模块
import numpy as np
import matplotlib.pyplot as plt
from matplotlib import font_manager # 中文字体设置第1步,导出模块

#中文字体设置第2步:引出字体模块和位置
my_font = font_manager.FontProperties(fname="/usr/share/fonts/truetype/noto/simsun.ttf")

#数据来源,单独设定,非文件来源
#dataLenth = 8  #数据个数,8组数据
#标签
labels = np.array(['3℃','5℃','6℃','3℃','1℃','3℃','3℃','2℃'])
data = np.array([3,5,6,3,1,3,3,2])  #数据值,与上面labels有对应关系

#雷达图的数据格式,基本固定
#angles = np.linspace(0, 2*np.pi, dataLenth, endpoint=False)
#如果没有dataLenth = 8==len(labels),也可以这样
angles = np.linspace(0, 2*np.pi, len(labels), endpoint=False)

data = np.concatenate((data, [data[0]]))
angles = np.concatenate((angles, [angles[0]]))

#导出fig图片设置,雷达图这种格式基本固定
fig = plt.figure()
#polar=true,就是ax.set_thetagrids可以显示
ax = fig.add_subplot(111, polar=True)
#数据线的宽度2,ro-代表red-;bo-代表blue-;yo-代表yellow-;o-代表深蓝deepblue-
ax.plot(angles, data, 'ro-', linewidth=2)

#ax.set_thetagrids(angles * 180/np.pi, labels, fontproperties="SimHei") #bug,本机报错
ax.set_thetagrids(angles * 180/np.pi, labels, fontproperties=my_font)

#fig标题设置,中文字体设置
#中文字体设置第3步,在显示中文的地方,增加u和fontproperties=my_font
#ax.set_title("温度变化雷达图", va='bottom', fontproperties="SimHei")
ax.set_title(u"温度变化雷达图", va='bottom', fontproperties=my_font)
ax.grid(True)  #显示雷达图的一圈一圈的线,8个圈线

#显示图片
plt.show()
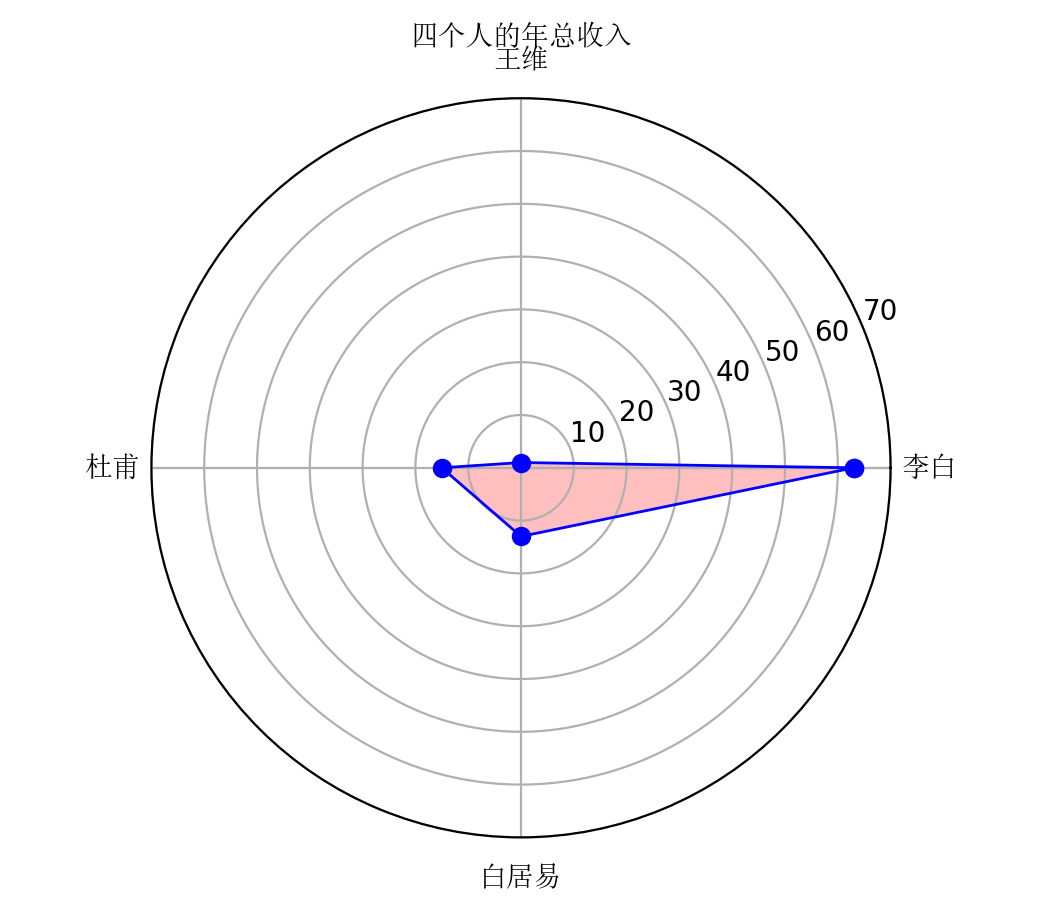
2.例二
图2
代码二
#导出模块
import pandas as pd
import numpy as np
import matplotlib.pyplot as plt
from matplotlib import font_manager # 中文字体设置第1步,导出模块

#中文字体设置
#plt.rcParams['font.sans-serif'] = ['KaiTi']  # 显示中文,本机不行
#中文字体设置第2步:引出字体模块和位置
my_font = font_manager.FontProperties(fname="/usr/share/fonts/truetype/noto/simsun.ttf")

#中文字体设置第3步,在显示中文的地方,在这里增加u
labels = np.array([u'李白', u'王维', u'杜甫',u'白居易']) # 这种中文字体设置很难,分2个地方
#dataLenth = 4  # 数据长度
data_radar = np.array([63, 1, 15, 13]) # 数据

#angles = np.linspace(0, 2*np.pi, dataLenth, endpoint=False)  # 分割圆周长
#如果不设置dataLenth = 4,也可以len(labels)=4,代表4组数据
angles = np.linspace(0, 2*np.pi, len(labels), endpoint=False)  # 分割圆周长

data_radar = np.concatenate((data_radar, [data_radar[0]]))  # 闭合
angles = np.concatenate((angles, [angles[0]]))  # 闭合

plt.polar(angles, data_radar, 'bo-', linewidth=1)  # 做极坐标系
# 中文设置的labels,在这里加fontproperties=my_font
plt.thetagrids(angles * 180/np.pi, labels,fontproperties=my_font)
plt.fill(angles, data_radar, facecolor='r', alpha=0.25)# 填充

plt.ylim(0, 70)
#中文字体设置第3步,在显示中文的地方,增加u和fontproperties=my_font
#va='bottom',默认这个;top可能与王维重叠
plt.title(u'四个人的年总收入', fontproperties=my_font) #标题设置

plt.show()
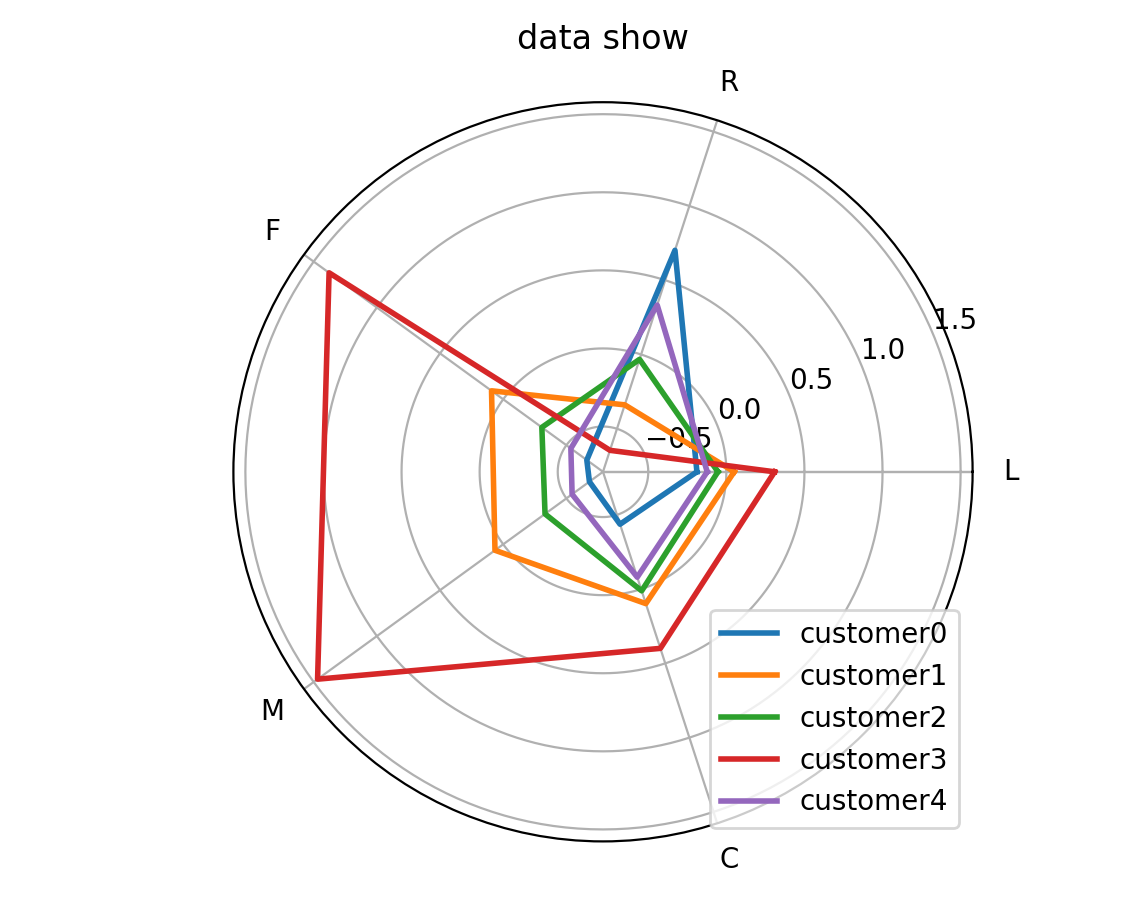
3.例三
3.1 读取csv数据
L R F M C
customer0 -0.18851 0.701298 -0.66178 -0.68228 -0.43681
customer1 0.050142 -0.33906 0.092392 0.065064 0.09756
customer2 -0.05403 -0.03271 -0.30585 -0.33106 0.011589
customer3 0.309113 -0.64527 1.378002 1.4691 0.3989
customer4 -0.12259 0.332883 -0.53543 -0.54537 -0.08043

3.2 图3
3.3 代码3
#导出模块
import pandas as pd
import numpy as np
import matplotlib.pyplot as plt

#定义
def result_pic(result):
    # 解析出类别标签和种类
    labels = ['L', 'R', 'F', 'M', 'C']
    kinds = list(result.iloc[:, 0])
    # 由于在雷达图中,要保证数据闭合,这里就再添加L列,并转换为 np.ndarray
    result = pd.concat([result, result[['L']]], axis=1)
    centers = np.array(result.iloc[:, 1:])
    angle = np.linspace(0, 2 * np.pi, len(labels), endpoint=False)
    angle = np.concatenate((angle, [angle[0]]))
    # 绘图
    fig = plt.figure()
    ax = fig.add_subplot(111, polar=True)    # 参数polar, 以极坐标的形式绘制图形
    # 画线
    for i in range(len(kinds)):
        ax.plot(angle, centers[i], linewidth=2, label=kinds[i])
    # 添加属性标签
    ax.set_thetagrids(angle * 180 / np.pi, labels)
    plt.title('data show')
    plt.legend(loc='lower right')
    plt.show()

if __name__ == '__main__':
    result = pd.read_csv('data2.csv', sep=',')
    result_pic(result)

#注意细节:一般我们都是喜欢用excel或者wps表格进行数据的输入
#但是在保存数据时,喜欢直接更改文件的属性,导致数据读不出来
#应该是将文件另存为.csv格式

 浙公网安备 33010602011771号