FastReport .Net是适用于Windows Forms,ASP.NET,MVC和.NET Core的全功能报表解决方案常见问题解答
FastReport .Net是适用于Windows Forms,ASP.NET,MVC和.NET Core的全功能报表解决方案。它可以在Microsoft Visual Studio 2005-2019中使用。支持.Net Framework 2.0-4.x,.NET Core 3.0及以上版本。
在FastReport .NET 2021.1的新版本中,我们实现了对.NET 5的支持。添加了新条形码-Deutsce Post Leitcode。将RTF转换为报告对象的算法已得到显着改进。并且还添加了用于转换数字的新功能。欢迎下载体验。(点击下方按钮下载)
点击下载FastReport.NET v2021.1最新版【慧都网】
1.如何在WPF应用程序中使用FastReport.Net控件?
您应该为此使用WindowsFormsHost控件:
0)在FastReport.dll上添加引用;
1)如果要使用PreviewControl,则将属性添加到Window(Page)标记中:xmlns:fr =“ clr-namespace:FastReport.Preview; assembly = FastReport”,xmlns:fr1 =“ clr-namespace:FastReport.Design; assembly = FastReport”-if DesignerControl;
2)将WindowsFormsHost标记添加到您的XAML标记中:
<WindowsFormsHost HorizontalAlignment="Stretch" VerticalAlignment="Stretch" Grid.Column="0" Grid.ColumnSpan="3">
</WindowsFormsHost>
3)将子级添加到WindowsFormsHost中:<fr:PreviewControl> </ fr:PreviewControl>或<fr1:Designer> </ fr1:Designer>。
完整的标记应如下所示:
<Window
 xmlns="http://schemas.microsoft.com/winfx/2006/xaml/presentation"
 xmlns:x="http://schemas.microsoft.com/winfx/2006/xaml"
 xmlns:d="http://schemas.microsoft.com/expression/blend/2008"
 xmlns:mc="http://schemas.openxmlformats.org/markup-compatibility/2006"
 x:Class="WpfApplication1.MainWindow"
 Title="MainWindow" Height="375.977" Width="939.258"
 xmlns:fr="clr-namespace:FastReport.Preview;assembly=FastReport">
 <Grid>
 <Grid.ColumnDefinitions>
 <ColumnDefinition Width="*"/>
 <ColumnDefinition Width="*"/>
 <ColumnDefinition Width="*"/>
 </Grid.ColumnDefinitions>
 <WindowsFormsHost HorizontalAlignment="Stretch" VerticalAlignment="Stretch" Grid.Column="0" Grid.ColumnSpan="3">
 <fr:PreviewControl></fr:PreviewControl>
 </WindowsFormsHost>
 </Grid>
</Window>
2.如何以编程方式设置Format的值?
您可以使用以下代码在脚本或项目中执行此操作:
FastReport.Format.NumberFormat format = new FastReport.Format.NumberFormat();
format.UseLocale = false;
format.DecimalDigits = 2;
format.DecimalSeparator = ".";
format.GroupSeparator = ",";
然后:
textObject.Formats.Clear();
textObject.Formats.Add(format);
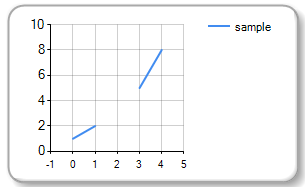
3.如何在MSChartObject中创建带有间隙的行?
您应该创建基本的System.Windows.Forms.DataVisualization.Charting.Series对象,并在此处创建行。之后,应为MSChartObject基本图表分配创建的系列(MSChart1.Chart.Series.Add(series);)不要忘记在“报表”->“脚本”菜单和命名空间System.Windows.Forms中添加 System.Windows.Forms.DataVisualization.dll。 .DataVisualization.Charting。
带有间隙的线的示例:
.
.
using System.Windows.Forms.DataVisualization.Charting;

namespace FastReport
{
 public class ReportScript
 {
 private void MSChart1_BeforePrint(object sender, EventArgs e)
 {
 Series series = new Series("sample");
 series.ChartType = SeriesChartType.Line;
 series.BorderWidth = 2;
 series.MarkerSize = 5;

 series.Points.Add(new DataPoint(0, 1));
 series.Points.Add(new DataPoint(1, 2));
 DataPoint dp = new DataPoint(2, double.NaN);
 dp.IsEmpty = true;
 series.Points.Add(dp);
 series.Points.Add(new DataPoint(3, 5));
 series.Points.Add(new DataPoint(4, 8));

 MSChart1.Chart.Series.Add(series);

 }
 }
}
结果:
4.如何从代码创建MSChartObject?
1.创建新的MSChart对象,设置宽度,高度和图例:
 MSChartObject MSChart1 = new MSChartObject();
 MSChart1.Width = 300;
 MSChart1.Height = 300;
 MSChart1.Chart.Legends.Add(new Legend() { Name = "Legend1", Title="Legend title"});
2.创建ChartArea对象,设置名称,轴标题,并将创建的ChartArea分配给MSChart:
 ChartArea chartArea1 = new ChartArea();
 chartArea1.Name = "ChartArea1";
 chartArea1.Axes[0].Title = "X name";
 chartArea1.Axes[1].Title = "Y name";
 MSChart1.Chart.ChartAreas.Add(chartArea1);
3.创建系列对象,设置图表类型,边框宽度,添加点并将系列分配给图表:
 Series series = new Series("sample");
 series.ChartType = SeriesChartType.Line;
 series.BorderWidth = 2;
 series.Points.Add(new DataPoint(0, 1));
 series.Points.Add(new DataPoint(1, 2));
 series.Points.Add(new DataPoint(3, 5));
 series.Points.Add(new DataPoint(4, 8));

 MSChart1.Chart.Series.Add(series);
4.将创建的MSChart分配给DataBand:
Report report = new Report();
report.Load("ok.frx");
DataBand db = report.FindObject("Data1") as DataBand;

MSChart1.Parent = db;
完整的代码段:
 MSChartObject MSChart1 = new MSChartObject();
 MSChart1.Width = 300;
 MSChart1.Height = 300;
 MSChart1.Chart.Legends.Add(new Legend() { Name = "Legend1", Title="Legend title"});

 ChartArea chartArea1 = new ChartArea();
 chartArea1.Name = "ChartArea1";
 chartArea1.Axes[0].Title = "X name";
 chartArea1.Axes[1].Title = "Y name";
 MSChart1.Chart.ChartAreas.Add(chartArea1);

 Series series = new Series("sample");
 series.ChartType = SeriesChartType.Line;
 series.BorderWidth = 2;
 series.Points.Add(new DataPoint(0, 1));
 series.Points.Add(new DataPoint(1, 2));
 series.Points.Add(new DataPoint(3, 5));
 series.Points.Add(new DataPoint(4, 8));

 MSChart1.Chart.Series.Add(series);

 Report report = new Report();
 report.Load("ok.frx");
 DataBand db = report.FindObject("Data1") as DataBand;
 MSChart1.Parent = db;
结果:


 浙公网安备 33010602011771号