let fireMonitorSub = echarts.init(document.getElementById('fireMonitor'))
let carInfoOption = {
tooltip: {
trigger: 'axis',
backgroundColor: 'rgba(30,41,54,.8)',
axisPointer: {//坐标轴指示器配置项
lineStyle: {
color: '#F50077'
}
},
borderWidth: 0,
textStyle: {
color: 'rgba(255, 255, 255, 0.8)'
},
formatter: function(parmas) {
// console.log(parmas)
const date = new Date();
const year = date.getFullYear()
const month = date.getMonth() + 1
// month = (month > 9) ? month : ("0"+month)
//console.log(month)
const day = date.getDate()
console.log(day)
const hour = date.getHours()
const minitunes = date.getMinutes()
const dateD = year + "-" + zeroPadd(month) +"-"+ zeroPadd(day) +" " +zeroPadd(hour) + ":" + zeroPadd(minitunes)
// console.log(dateD)
function zeroPadd(par) {
par = par.toString()
return par[1] ? par : ("0" + par)
}
let str = ''
parmas.forEach(item => {
// console.log(item.seriesName)
str+= `<p><i style="float: left; width: 5px; height: 5px; border-radius: 50%; margin: 7px 5px 0 0; background: ${item.color}" ></i> ${item.seriesName}: ${item.data}次 </p>`
})
return dateD + str
}
},
legend: {
top: 0,
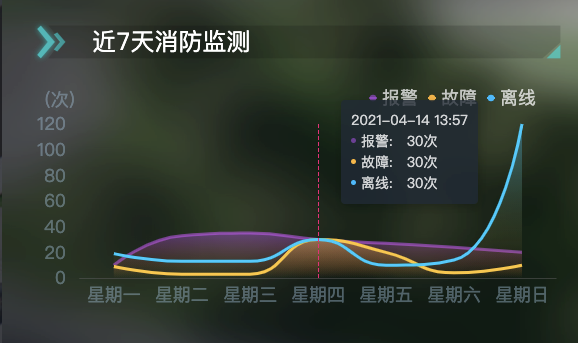
data: ['报警', '故障', '离线'],
right: 20,
nameGap: 10,
itemWidth: 8,
itemHeight: 8,
textStyle: {
color: 'rgba(255,255,255,.7)',
fontSize: 18
}
},
grid: {
left: 5,
right: 5,
bottom: 5,
top: 40,
containLabel: true
},
xAxis: {
type: 'category',
boundaryGap: true,
data: ['星期一', '星期二', '星期三', '星期四', '星期五', '星期六', '星期日'],
splitLine: false,
//坐标轴刻度标签的显示间隔,在类目轴中有效。
axisLabel: {
interval: 0,
color: 'rgba(169, 209, 236, 0.35)',
fontSize: 18
},
axisLine: {
lineStyle: {
color: 'rgba(92, 92, 92, .5)'
}
},
axisTick: false // 去掉x轴刻度线颜色
},
yAxis: {
name: '(次)',
nameTextStyle: {
padding: [5, 0, 0, -40], // 四个数字分别为上右下左与原位置距离
color: 'rgba(169, 209, 236, 0.35)',
fontSize: 18
},
type: 'value',
axisLine: {
show: false//是否显示坐标轴轴线
},
axisTick: {
show: false
},
splitLine: {
show: false
},
axisLabel: { //设置y轴单位
formatter: '{value} ',
color: 'rgba(169, 209, 236, 0.35)',
fontSize: 18
}
},
series: [
{
name: '报警',
type: 'line',
itemStyle: {
normal: {
color: 'rgba(198, 77, 255, 0.5)'
}
},
lineStyle: {
width: 2
},
areaStyle: {
normal: {
color: new window.echarts.graphic.LinearGradient(0, 0, 0, 1, [{
offset: 0,
color: 'rgba(198, 77, 255, 0.5)'
},
{
offset: 1,
color: 'rgba(227, 94, 38, 0)'
}])
}
},
z: 1,
smooth: true,
showSymbol: false,//不显示数据节点的标志 小圆点
symbol: 'none',//鼠标滑过不显示 小圆点
data: [10, 33, 35, 30, 27, 24,20]
// data:[]
},
{
name: '故障',
type: 'line',
itemStyle: {
normal: {
color: 'rgba(255, 180, 42, 1)'
}
},
lineStyle: {
width: 2
},
areaStyle: {
normal: {
color: new window.echarts.graphic.LinearGradient(0, 0, 0, 1, [{
offset: 0,
color: 'rgba(255, 180, 42, 0.5)'
},
{
offset: 1,
color: 'rgba(245, 166, 35, 0)'
}])
}
},
z: 2,
smooth: true,
showSymbol: false,//不显示数据节点的标志 小圆点
symbol: 'none',//鼠标滑过不显示 小圆点
data: [9, 3, 3, 30, 20, 4,10]
// data:[]
},
{
name: '离线',
type: 'line',
itemStyle: {
normal: {
color: 'rgba(0, 186, 255, 1)'
}
},
lineStyle: {
width: 2
},
areaStyle: {
normal: {
color: new window.echarts.graphic.LinearGradient(0, 0, 0, 1, [{
offset: 0,
color: 'rgba(0, 186, 255, .5)'
},
{
offset: 1,
color: 'rgba(245, 166, 35, 0)'
}])
}
},
z: 3,
smooth: true,
showSymbol: false,//不显示数据节点的标志 小圆点
symbol: 'none',//鼠标滑过不显示 小圆点
// data: [220, 150, 360, 360, 260, 260, 260, 10, 186, 206, 160, 160, 190, 20, 20, 210, 200, 270, 300, 100, 100, 260, 230, 140]
data: [19, 13, 13, 30, 10, 14,120]
},
]
}
fireMonitorSub.clear();
fireMonitorSub.setOption(carInfoOption)


 浙公网安备 33010602011771号