VBA绘制Excel图表
VBA调试运行进入:
右键Excel的Sheet - 查看代码 - Microsoft Visual Basic for Applications(VBA)
为了方便,建议开启“开发工具”栏:
文件 - 选项 - 自定义功能区 - 勾选“开发工具”
几个例子:
删除工作表内所有图表
Sub 删除全部图表()
    ActiveSheet.ChartObjects.Delete
End Sub
录制一个宏
' 录制的创建折线图代码
Sub 宏12()
'
' 宏12 宏
'
'
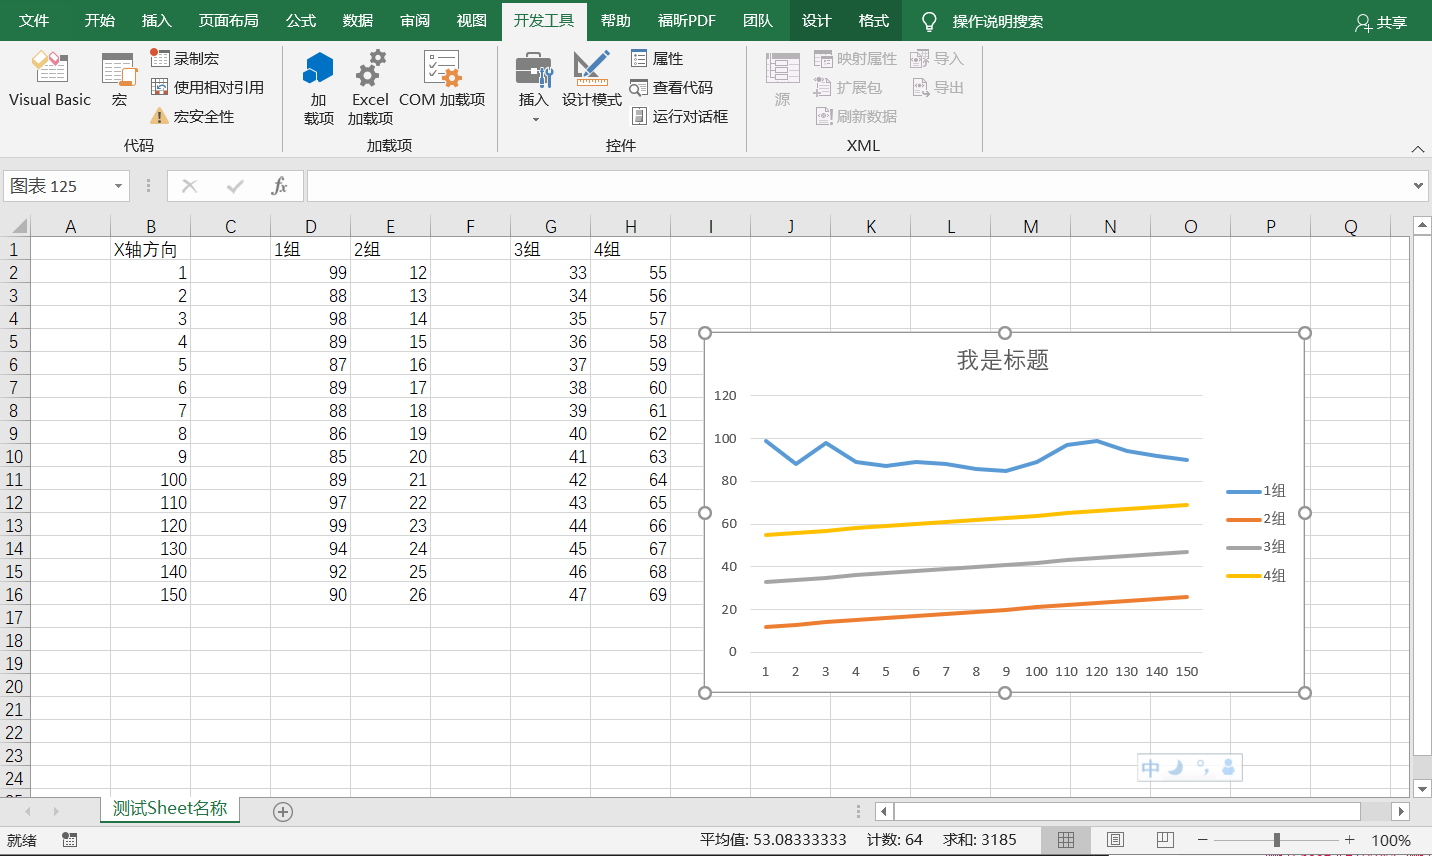
Range("D1,D2:D16,E1,E2:E16,G1,G2:G16,H1,H2:H16").Select ' 选择数据区域
Range("H2").Activate
ActiveSheet.Shapes.AddChart2(227, xlLine).Select ' 选择插入折线图
ActiveChart.SetSourceData Source:=Range( _
"测试Sheet名称!$D$1,测试Sheet名称!$D$2:$D$16,测试Sheet名称!$E$1,测试Sheet名称!$E$2:$E$16,测试Sheet名称!$G$1,测试Sheet名称!$G$2:$G$16,测试Sheet名称!$H$1,测试Sheet名称!$H$2:$H$16" _
) ' 图表的数据选区
Application.CutCopyMode = False ' 取消剪切赋值模式
Application.CutCopyMode = False
ActiveChart.FullSeriesCollection(1).XValues = "=测试Sheet名称!$B$2:$B$16" ' 选择 X 轴坐标选区
ActiveChart.SetElement (msoElementLegendRight) ' 选择图例右边显示
ActiveChart.ChartTitle.Select
ActiveChart.ChartTitle.Text = "我是标题" ' 设置标题名称
Selection.Format.TextFrame2.TextRange.Characters.Text = "我是标题"
With Selection.Format.TextFrame2.TextRange.Characters(1, 4).ParagraphFormat
.TextDirection = msoTextDirectionLeftToRight
.Alignment = msoAlignCenter
End With
With Selection.Format.TextFrame2.TextRange.Characters(1, 4).Font ' 字体设置
.BaselineOffset = 0
.Bold = msoFalse
.NameComplexScript = "+mn-cs"
.NameFarEast = "+mn-ea"
.Fill.Visible = msoTrue
.Fill.ForeColor.RGB = RGB(89, 89, 89)
.Fill.Transparency = 0
.Fill.Solid
.Size = 14
.Italic = msoFalse
.Kerning = 12
.Name = "+mn-lt"
.UnderlineStyle = msoNoUnderline
.Spacing = 0
.Strike = msoNoStrike
End With
End Sub
简化宏再使用
由录制得到的内容可以简化后使用:
Sub 生成图表()
    ActiveSheet.Shapes.AddChart2(227, xlLine).Select        ' 选择插入折线图
    ActiveChart.SetSourceData Source:=Range("测试Sheet名称!$D$1:$D$16,$E$1:$E$16,$G$1:$G$16,$H$1:$H$16")   ' 图表的数据选区
    ActiveChart.FullSeriesCollection(1).XValues = "=测试Sheet名称!$B$2:$B$16" ' 选择 X 轴坐标选区
    ActiveChart.SetElement (msoElementLegendRight)          ' 选择图例右边显示
    ActiveChart.ChartTitle.Text = "我是标题"                 ' 设置标题名称
End Sub
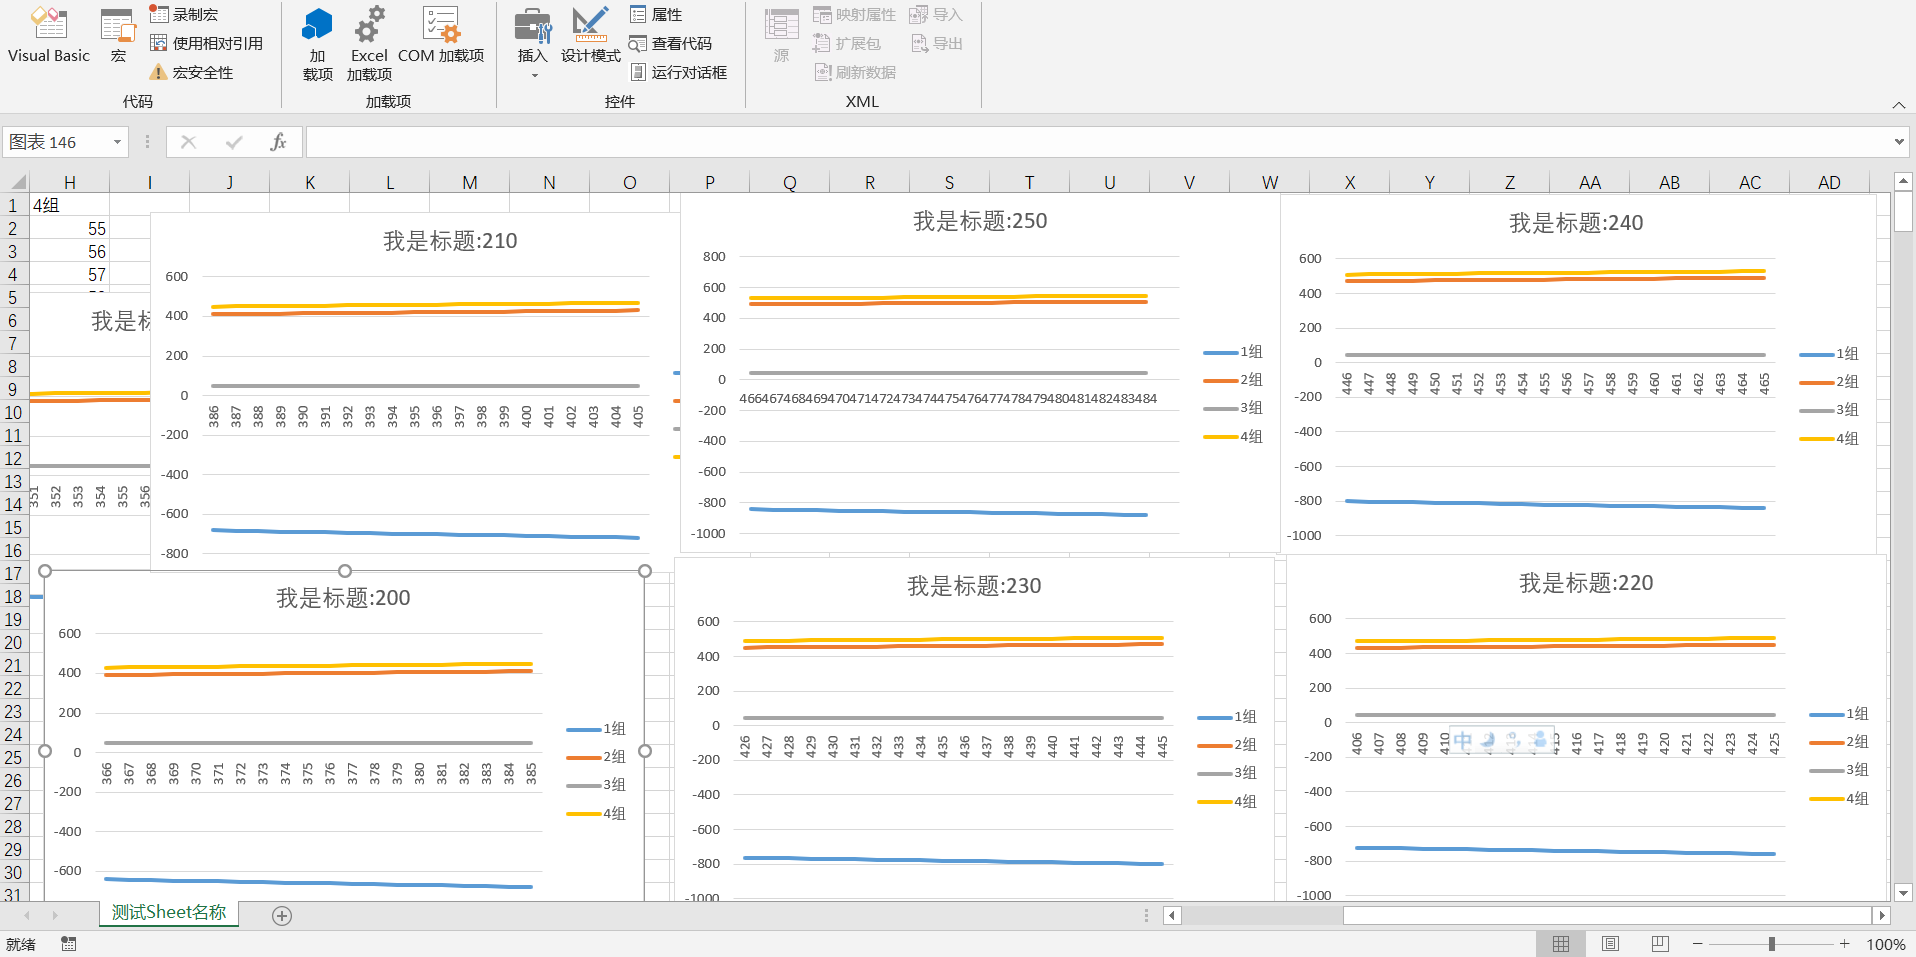
大量图表可采用for循环
Sub 批量生成图表()
Dim numInt, cntInt As Integer
Dim sheetNameStr, rowStartStr, rowEndStr, titleNameStr As String
sheetNameStr = "测试Sheet名称":
cntInt       = 0:
    For numInt = 2 To 500 Step 20
        rowStartStr   = Replace(Str(numInt), " ", ""):           ' 去除数字转字符中的多余空格
        rowEndStr     = Replace(Str(numInt + 19), " ", ""):
        cntInt        = cntInt + 1:
        titleNameStr  = Replace(Str(cntInt * 10), " ", ""):

        ' 使用简化的宏
        ActiveSheet.Shapes.AddChart2(227, xlLine).Select:        ' 选择插入折线图
        ActiveChart.SetSourceData Source:=Range(sheetNameStr & _
            "!$D$1,$D$" & rowStartStr & ":$D$" & rowEndStr & _
            ",$E$1,$E$" & rowStartStr & ":$E$" & rowEndStr & _
            ",$G$1,$G$" & rowStartStr & ":$G$" & rowEndStr & _
            ",$H$1,$H$" & rowStartStr & ":$H$" & rowEndStr _
            ):   ' 图表的数据选区
        ActiveChart.FullSeriesCollection(1).XValues = "=" & sheetNameStr & "!$B$" & rowStartStr & ":$B$" & rowEndStr: ' 选择 X 轴坐标选区
        ActiveChart.SetElement (msoElementLegendRight):          ' 选择图例右边显示
        ActiveChart.ChartTitle.Text = "我是标题:" & titleNameStr  ' 设置标题名称
    Next
End Sub
上面的代码生成效果如下:
注:
| 操作 | 方式 |
|---|---|
| 注释 | 单引号 ' |
| 多行合并 | 冒号 : |
| 分多行书写 | 末尾用下划线 _ |
| 变量定义 | Dim varx,vary As String |
| 连接字符串变量和字符串 | 与号 & |
| for循环 | Dim num As Integer for num = 1 To 15 Step 2 ...循环内容... Next |
CSDN上用积分下载的一个例子
Public Sub CreateChart()
    Dim ws As Worksheet
    Dim myRange As Range
    Dim myChart As ChartObject
    Dim N As Integer
    Dim xmin As Single, xmax As Single, ymin As Single, ymax As Single
    Dim sj As String, X As String, Y As String, A As String, B As String
    Set ws = ThisWorkbook.Worksheets("Sheet1")    '指定数据源工作表
    ws.ChartObjects.Delete     '删除工作表上已经存在的图表
    N = ws.Range("A65536").End(xlUp).Row    '获取数据个数
    X = "数据序列X"    'X坐标轴标题
    Y = "数据序列Y"    'Y坐标轴标题
    A = "A" & 2 & ":A" & N    'X坐标轴数据源
    B = "B" & 2 & ":B" & N    'Y坐标轴数据源
    xmin = Application.WorksheetFunction.Min(ws.Range(A))    'X坐标轴最小值
    xmax = Application.WorksheetFunction.Max(ws.Range(A))    'X坐标轴最大值
    ymin = Application.WorksheetFunction.Min(ws.Range(B))    'Y坐标轴最小值
    ymax = Application.WorksheetFunction.Max(ws.Range(B))    'Y坐标轴最大值
    Set myRange = ws.Range("A" & 1 & ":B" & N)     '图表的数据源
    Set myChart = ws.ChartObjects.Add(100, 30, 400, 250)     '创建一个新图表
    With myChart.Chart
        .ChartType = xlXYScatterSmooth    '指定图表类型
        .SetSourceData Source:=myRange, PlotBy:=xlColumns    '指定图表数据源和绘图方式
        .HasTitle = True    '有标题
        .ChartTitle.Text = "制作图表示例"
        With .ChartTitle.Font    '设置标题的字体
            .Size = 16
            .ColorIndex = 3
            .Name = "华文新魏"
        End With
        .Axes(xlCategory, xlPrimary).HasTitle = True    'X坐标轴有图表标题
        .Axes(xlCategory, xlPrimary).AxisTitle.Characters.Text = X
        .Axes(xlValue, xlPrimary).HasTitle = True    'Y坐标轴有图表标题
        .Axes(xlValue, xlPrimary).AxisTitle.Characters.Text = Y
        With .Axes(xlCategory)
            .MinimumScale = xmin      'X坐标轴最小刻度
            .MaximumScale = xmax      'X坐标轴最大刻度
        End With
        With .Axes(xlValue)
            .MinimumScale = ymin      'Y坐标轴最小刻度
            .MaximumScale = ymax      'Y坐标轴最大刻度
        End With
        With .ChartArea.Interior    '设置图表区的颜色
            .ColorIndex = 15
            .PatternColorIndex = 1
            .Pattern = xlSolid
        End With
        With .PlotArea.Interior    '设置绘图区的颜色
            .ColorIndex = 35
            .PatternColorIndex = 1
            .Pattern = xlSolid
        End With
        With .SeriesCollection(1)
            With .Border    '设置第一个数据系列的格式
                .ColorIndex = 3
                .Weight = xlThin
                .LineStyle = xlDot
            End With
            .MarkerStyle = xlCircle
            .Smooth = True
            .MarkerSize = 5
        End With
        .Legend.Delete     '删除图例
    End With
    Set myRange = Nothing
    Set myChart = Nothing
    Set ws = Nothing
End Sub
VBA数组
Sub tests()
Dim  my_array()
    my_array  = [{"111", "222", "333", "world"}]

    my_array(1) = "111"
    my_array(2) = "222"
    my_array(3) = "333"
    my_array(4) = "world"
End Sub

 浙公网安备 33010602011771号