网站状态监控
网站状态监控
网站状态监控有多种方法,大体上可以分成三类:
- 自己写脚本监控,去网上找一个写的比较好的,改一改也行呀
- 通过开源的第三方的工具,比如zabbix结合grafana
- 通过商业工具,比如:友盟统计
脚本
状态码监控脚本
下面这个脚本相当简单了,就只能检测网站的的状态码,如果状态码不是200就会发邮件通知我们,每两分钟检测一次。
#!/bin/bash
date=`date +"%Y%m%d-%H%M"`
title="status"
contentFail="status is not ok:"
contentSuccess="status is ok:"
url="https://www.zhanghehe.cn"
#通过下面这条命令可以取出状态码
status=`curl -m 20 -s -I $url | grep HTTP | awk '{print $2}'`

#echo "status: $status"

cd /data/shell
laststatus=`cat status.log`

if [ "$status" == "200" ]
    then
        if [ "$laststatus" != 200 ]
            then
                /usr/bin/python /shell/mail.py "$title" "$contentSuccess $url $date $status"
                echo "200" > status.log
        fi
else
    if [ "$laststatus" == 200 ]
        then
            /usr/bin/python /shell/mail.py "$title" "$contentFail $url $date $status"
            echo "$status" > status.log
    fi
fi
#mail.py
from email.header import Header
from email.mime.text import MIMEText
import smtplib
import sys

def sendmail(subject, content):
    sender = 'abc@163.com'
    password = 'abc'
    recipients = 'abc@qq.com'
    host = 'smtp.abc.com'
    msg = MIMEText(content, 'plain', 'utf-8')
    msg['From'] = sender
    msg['To'] = recipients
    msg['Subject'] = Header(subject, 'utf-8').encode()
    server = smtplib.SMTP_SSL(host, 465)
    server.login(sender, password)
    server.sendmail(sender, [recipients], msg.as_string())
    server.quit()


sendmail(sys.argv[1],sys.argv[2])
crontab -e
*/2 * * * * /shell/status.sh
超时时间监控脚本
[root@qd-inf-logcollector01 web_monit]$ pwd
/app/script/web_monit

[root@qd-inf-logcollector01 web_monit]$ ll
total 12
-rwxr-xr-x 1 root root 870 Oct 12 21:34 http_monit.sh      //监控脚本
-rwxr-xr-x 1 root root 857 Oct 12 21:25 sms.py             //短信报警脚本,里面有报警联系人
-rw-r--r-- 1 root root 377 Oct 12 21:27 weblist.txt        //监控的网站域名列表

[root@qd-inf-logcollector01 web_monit]$ cat http_monit.sh
#!/bin/sh
weblist=/app/script/web_monit/weblist.txt
for list in `cat $weblist|grep -E -v "#|^$"`
do
httpcode=`curl -o /dev/null -s -w %{http_code} "$list"`
httptime=`curl -o /dev/null -s -w "time_connect: %{time_connect}\ntime_starttransfer: %{time_starttransfer}\ntime_total: %{time_total}\n" "$list"|grep time_total|awk -F ":" '{print $2*1000}'`
if [ $httpcode = 500 ]||[ $httpcode = 502 ]||[ $httpcode = 503 ]||[ $httpcode = 504 ]
then
   python /app/script/web_monit/sms.py $list "$list 访问有误!状态码为$httpcode!请收到报警后尽快查看并处理!"
else
   echo "$list is checked ok!"
fi

if [ $httptime -ge 10000 ]
then
   python /app/script/web_monit/sms.py $list " $list访问超时!超时时间为$httptime毫秒!请收到报警后尽快查看并处理!"
else
  echo "$list is connect ok!"
fi
done
////小案例
[11:01root@kk ~]# curl -o /dev/null -s -w %{time_namelookup}---%{time_connect}---%{time_starttransfer}---%{time_total}---%{speed_download}"\n" www.baidu.com
0.013---0.035---0.058---0.058---40709.000
[11:02root@kk ~]# curl -o /dev/null -s -w %{time_namelookup}---%{time_connect}---%{time_starttransfer}---%{time_total}---%{speed_download}"\n" www.zhanghehe.cn
0.063---1.436---2.797---2.797---60.000
-o:把curl 返回的html、js 写到垃圾回收站[ /dev/null]
-s:去掉所有状态
-w:按照后面的格式写出rt
time_namelookup:DNS 解析域名www.36nu.com的时间
time_commect:client和server端建立TCP 连接的时间
time_starttransfer:从client发出请求;到web的server 响应第一个字节的时间
time_total:client发出请求;到web的server发送会所有的相应数据的时间
speed_download:下周速度 单位 byte/s
上面这条命令及返回结果可以这么理解:
0.014: DNS 服务器解析www.36nu.com 的时间单位是s
0.015: client发出请求,到c/s 建立TCP 的时间;里面包括DNS解析的时间
0.018: client发出请求;到s响应发出第一个字节开始的时间;包括前面的2个时间
0.019: client发出请求;到s把响应的数据全部发送给client;并关闭connect的时间
1516256.00 :下载数据的速度
建立TCP连接到server返回client第一个字节的时间:0.018s – 0.015s = 0.003s
server把响应数据发送给client的时间:0.019s – 0.018 = 0.01s
curl的部分时间等变量注释:
url_effective The URL that was fetched last. This is most meaningful if you've told curl to follow location: headers.

filename_effective The ultimate filename that curl writes out to. This is only meaningful if curl is told to write to a file with the --remote-name or --output option. It's most useful in combination with the --remote-header-name option. (Added in 7.25.1)

http_code http状态码,如200成功,301转向,404未找到,500服务器错误等。(The numerical response code that was found in the last retrieved HTTP(S) or FTP(s) transfer. In 7.18.2 the alias response_code was added to show the same info.)

http_connect The numerical code that was found in the last response (from a proxy) to a curl CONNECT request. (Added in 7.12.4)

time_total 总时间,按秒计。精确到小数点后三位。 (The total time, in seconds, that the full operation lasted. The time will be displayed with millisecond resolution.)

time_namelookup DNS解析时间,从请求开始到DNS解析完毕所用时间。(The time, in seconds, it took from the start until the name resolving was completed.)

time_connect 连接时间,从开始到建立TCP连接完成所用时间,包括前边DNS解析时间,如果需要单纯的得到连接时间,用这个time_connect时间减去前边time_namelookup时间。以下同理,不再赘述。(The time, in seconds, it took from the start until the TCP connect to the remote host (or proxy) was completed.)

time_appconnect 连接建立完成时间,如SSL/SSH等建立连接或者完成三次握手时间。(The time, in seconds, it took from the start until the SSL/SSH/etc connect/handshake to the remote host was completed. (Added in 7.19.0))

time_pretransfer 从开始到准备传输的时间。(The time, in seconds, it took from the start until the file transfer was just about to begin. This includes all pre-transfer commands and negotiations that are specific to the particular protocol(s) involved.)

time_redirect 重定向时间,包括到最后一次传输前的几次重定向的DNS解析,连接,预传输,传输时间。(The time, in seconds, it took for all redirection steps include name lookup, connect, pretransfer and transfer before the final transaction was started. time_redirect shows the complete execution time for multiple redirections. (Added in 7.12.3))

time_starttransfer 开始传输时间。在client发出请求之后,Web 服务器返回数据的第一个字节所用的时间(The time, in seconds, it took from the start until the first byte was just about to be transferred. This includes time_pretransfer and also the time the server needed to calculate the result.)

size_download 下载大小。(The total amount of bytes that were downloaded.)

size_upload 上传大小。(The total amount of bytes that were uploaded.)

size_header  下载的header的大小(The total amount of bytes of the downloaded headers.)

size_request 请求的大小。(The total amount of bytes that were sent in the HTTP request.)

speed_download 下载速度,单位-字节每秒。(The average download speed that curl measured for the complete download. Bytes per second.)

speed_upload 上传速度,单位-字节每秒。(The average upload speed that curl measured for the complete upload. Bytes per second.)

content_type 就是content-Type,不用多说了,这是一个访问我博客首页返回的结果示例(text/html; charset=UTF-8);(The Content-Type of the requested document, if there was any.)

num_connects Number of new connects made in the recent transfer. (Added in 7.12.3)

num_redirects Number of redirects that were followed in the request. (Added in 7.12.3)

redirect_url When a HTTP request was made without -L to follow redirects, this variable will show the actual URL a redirect would take you to. (Added in 7.18.2)

ftp_entry_path The initial path libcurl ended up in when logging on to the remote FTP server. (Added in 7.15.4)

ssl_verify_result ssl认证结果,返回0表示认证成功。( The result of the SSL peer certificate verification that was requested. 0 means the verification was successful. (Added in 7.19.0))
开源第三方工具
grafana可以监控多地点访问自定义网站的延时率,可以很好的判断网站的联通性。特别是对使用cdn网络的网站监控很有帮助。
第一步:
//首先要安装grafana
//debian系列
//1.添加源
root@compute-node:~#deb https://packagecloud.io/grafana/stable/debian/ jessie main >> /etc/apt/source.list
//2.添加包签名
root@compute-node:~#curl https://packagecloud.io/gpg.key | sudo apt-key add -
//3.更新软件包列表
root@compute-node:~#sudo apt-get update
//4.安装grafana
root@compute-node:~#sudo apt-get install grafana
//redhat系列
//1.下载软件rpm包
root@compute-node:~#wget https://s3-us-west-2.amazonaws.com/grafana-releases/release/grafana-4.4.3-1.x86_64.rpm
//2.安装依赖
root@compute-node:~#sudo yum install initscripts fontconfig
//3.安装grafana
root@compute-node:~#sudo rpm -Uvh grafana-4.4.3-1.x86_64.rpm
启动grafana并通过web访问
root@compute-node:~#service grafana-server restart
用浏览器访问http://</ip>:3000
默认账号:admin,默认密码:admin
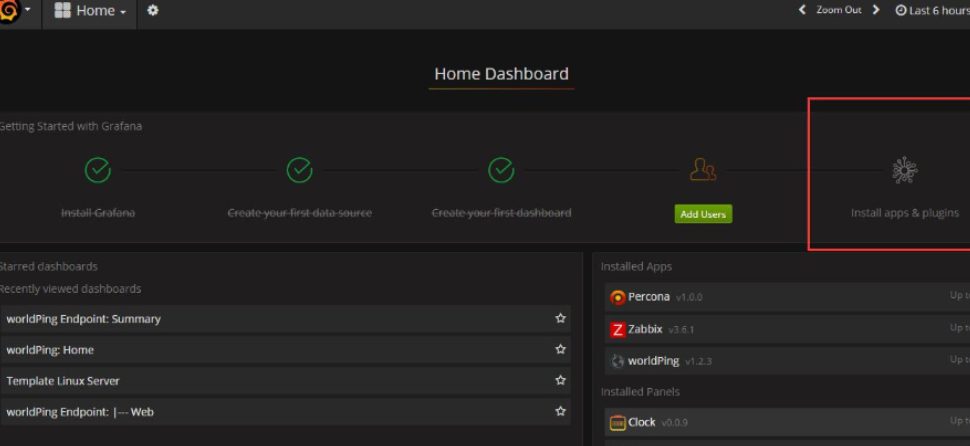
登陆后我们按下install apps & plugins 按钮
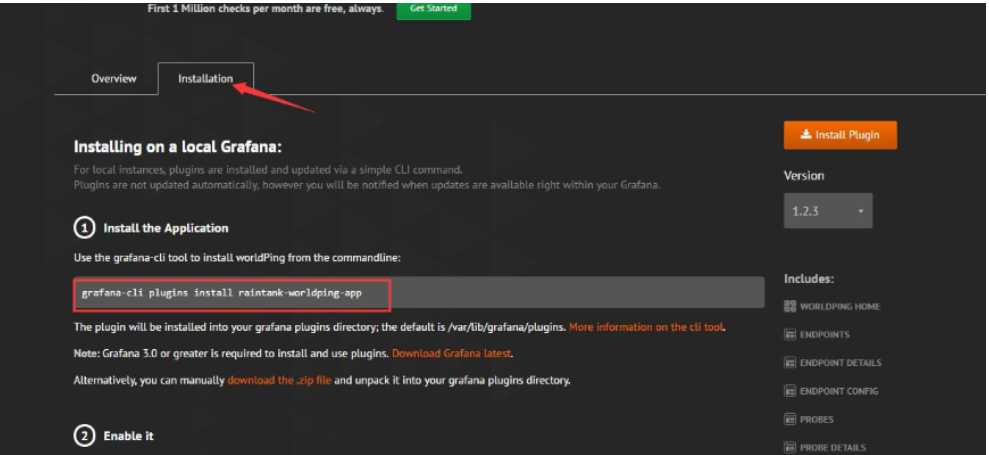
第二步: 跳转到grafana官网的插件列表,选择worldPing ,在界面的提示下安装worldping

跳到安装选项卡,把红框中的命令在shell下执行并重启grafana
root@compute-node:~#grafana-cli plugins install raintank-worldping-app
root@compute-node:~#service grafana-server restart
第三步: 重启服务,在worldPing 中输入你要检测的网址后点击自动发现 ,会自动生成图表,如下所示:
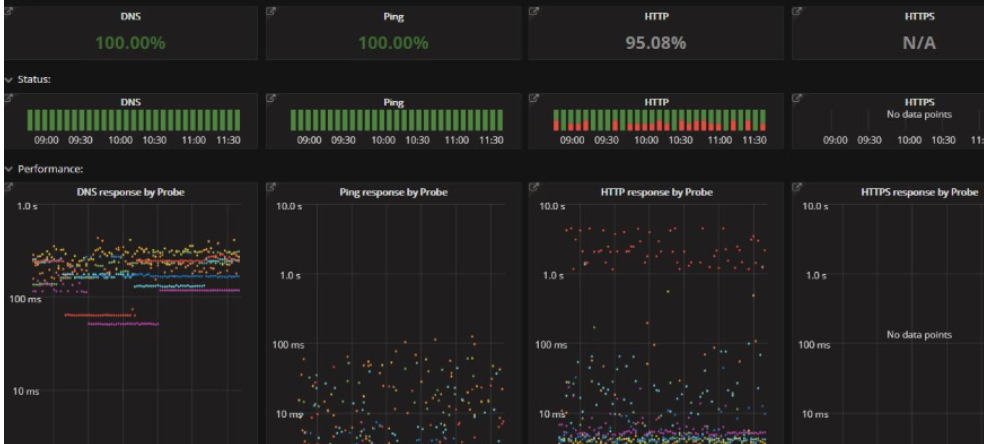
grafana还自带告警功能,我们可以对延时率做告警,支持页面消息,邮件等告警方式。
一个速度好的机房,首先丢包率不能超过1% ,打开网页的速度最好不能超过1秒。
第三方商业检测
第三方的网站商业检测,比如友盟,它的基础功能是不需要付费的,也可以看到网站的很多信息,我特意拿了我自己的博客站点来做实验。
当我在我的博客的站点当中写入了友盟提供的监测代码之后,出现了“站长统计”的字样,如下所示:

在控制台上查看是这样的:
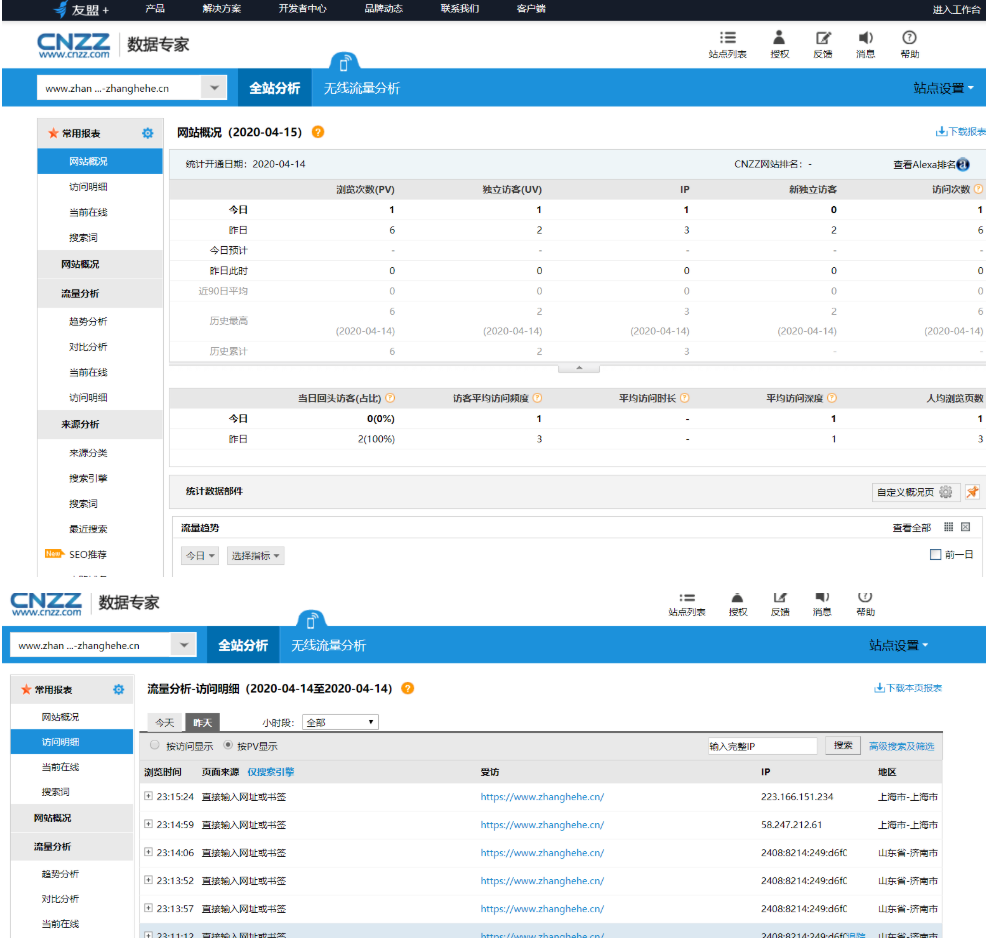
一些基本的统计都不用付费,而且界面也很美观漂亮,还支持报警