

matlab画频率分布直方图
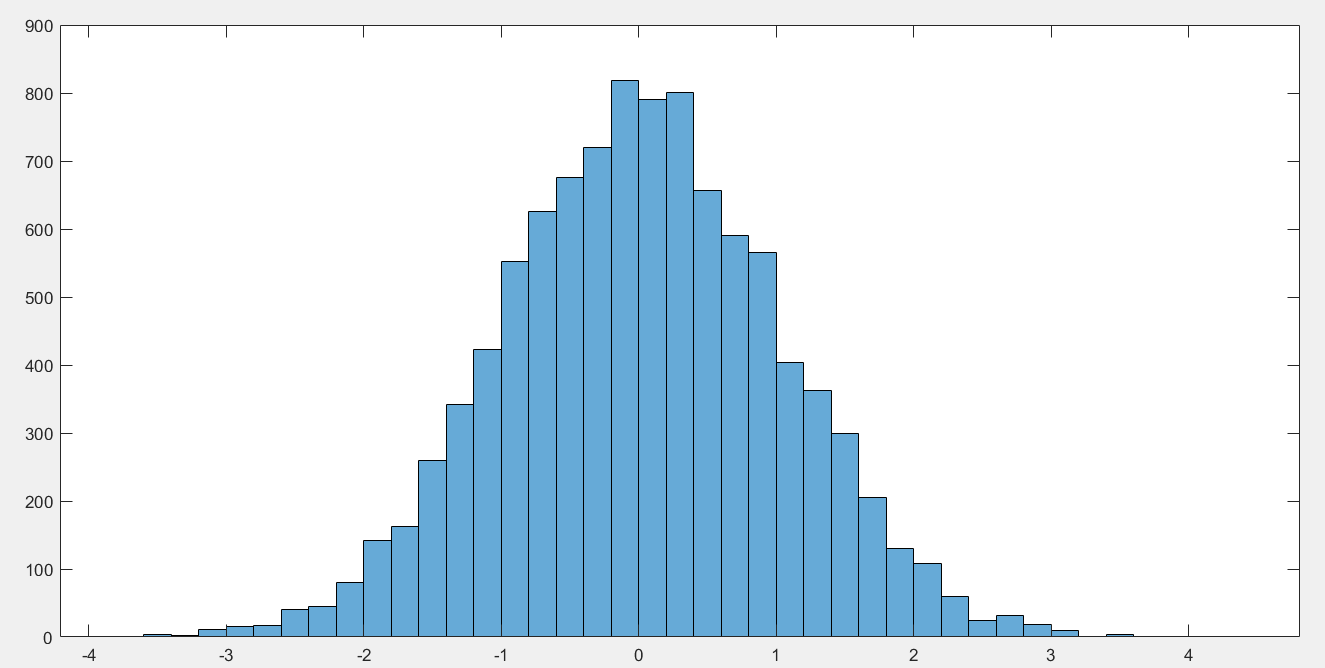
Generate 10,000 random numbers and create a histogram. Thehistogramfunction automatically chooses
an appropriate number of bins to cover the range of values inxand show the shape of the
underlying distribution.
x = randn(10000,1);
h = histogram(x)
randn(100001)产生10 000个均值![]() 0,标准差
0,标准差![]() 1的正态分布随机数。
1的正态分布随机数。
另一个例子:
clc
clear
close all

imgColor = imread('one_section_bianjihou.jpg');
imgGray = rgb2gray(imgColor);

%% imhist
figure('name', 'imhist'),
imhist(imgGray);

%% histogram
figure('name', 'histogram auto'),
% histogram函数自动计算NumBins值
hist2 = histogram(imgGray);
% Find the bin counts
binCounts = hist2.Values;
% Get bin number
binNum = hist2.NumBins;

%% histogram 指定NumBins值
% Specify number of histogram bins
figure('name', 'histogram256'),
hist256 = histogram(imgGray, 256); % 等同于 imhist(imgGray)


 浙公网安备 33010602011771号