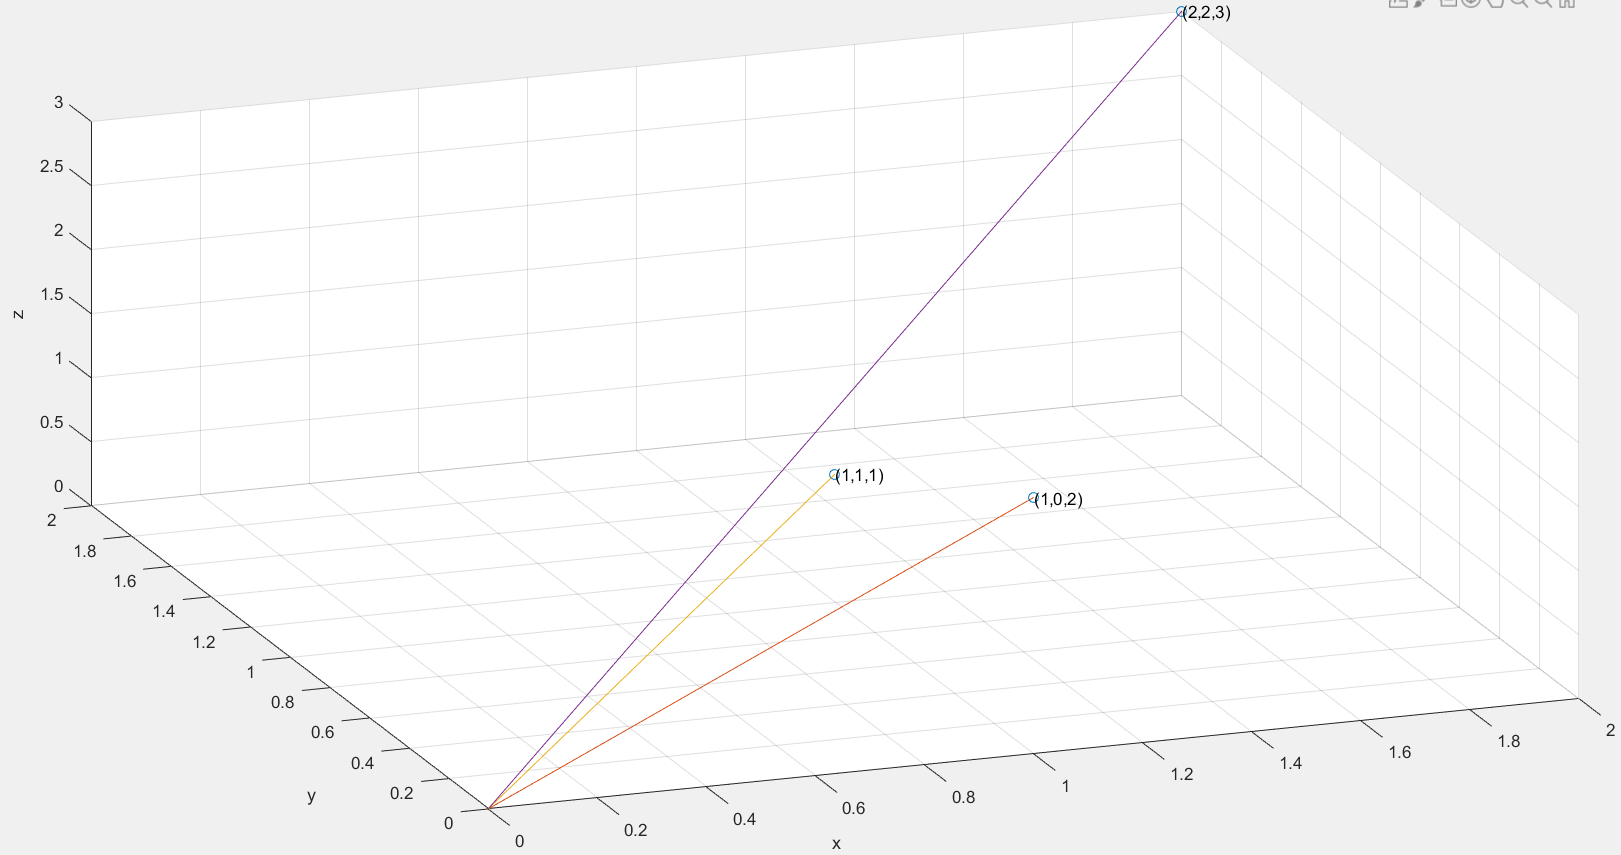
clc;clear;close all;
A = [1 0 2
 1 1 1
 2 2 3
];

[mm,nn] = size(A);
figure(1);
hold on;
grid on;
    plot3(A(:,1),A(:,2),A(:,3),'o')   ;
for i = 1:mm
    X1 = [A(i,1);0];
    Y1 = [A(i,2);0];
    Z1 = [A(i,3);0];
    plot3(X1,Y1,Z1)
    text(A(i,1),A(i,2),A(i,3),['(' num2str(A(i,1)) ',' num2str(A(i,2)) ',' num2str(A(i,3)) ')'])
end
view(-20,40)
xlabel( 'x');
ylabel( 'y');
zlabel( 'z');
![]()
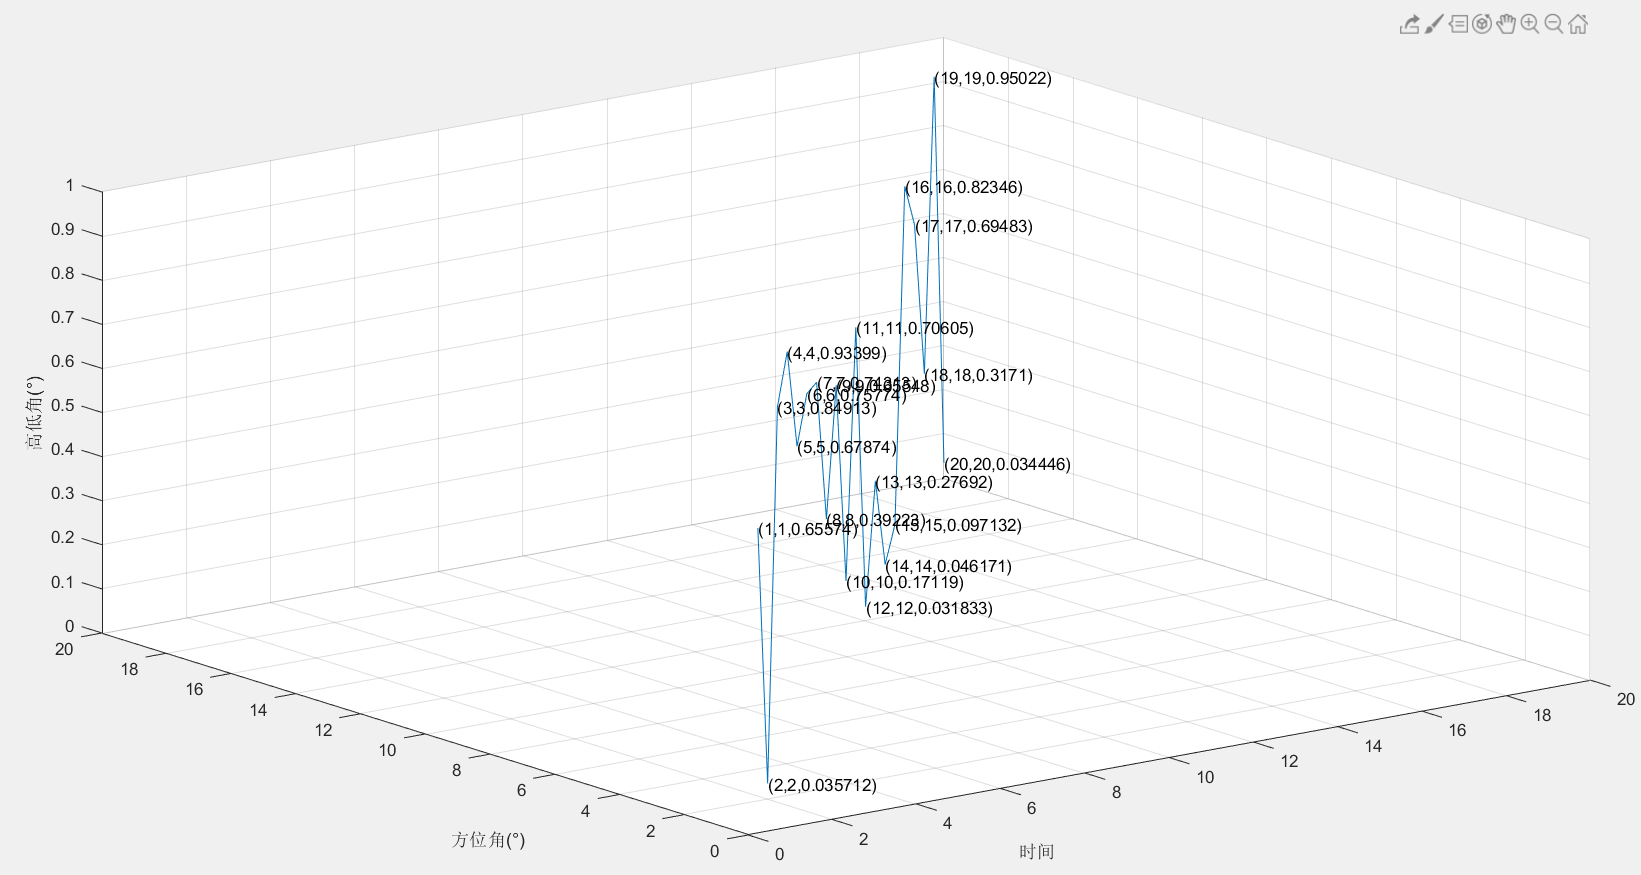
clc
close all
clear
x = 1:20;
y = 1:20;
z = rand(1,20);
plot3(x,y,z)
xlabel 时间
ylabel 方位角(°)
zlabel 高低角(°)
grid on
for ii=1:1:length(x)
text(x(ii),y(ii),z(ii),['(' num2str(x(ii)) ',' num2str(y(ii)) ',' num2str(z(ii)) ')'])
end
![]()
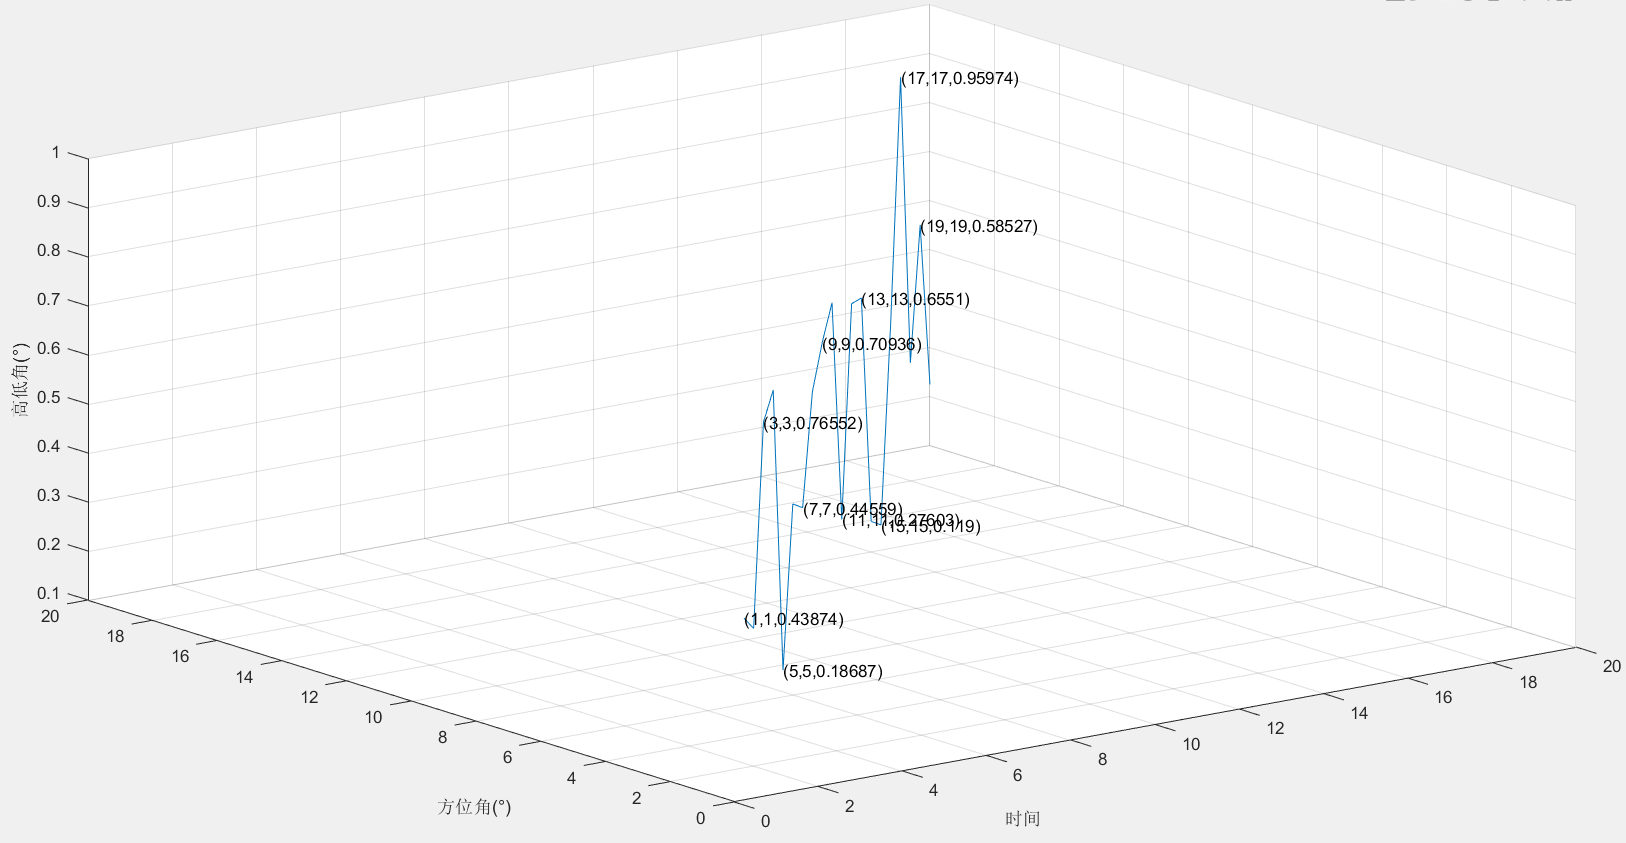
clc
close all
clear
x = 1:20;
y = 1:20;
z = rand(1,20);
plot3(x,y,z)
xlabel 时间
ylabel 方位角(°)
zlabel 高低角(°)
grid on
for  ii=1:2:length(x)
    text(x(ii),y(ii),z(ii),['(' num2str(x(ii)) ',' num2str(y(ii)) ',' num2str(z(ii))  ')'])
end
![]()


 浙公网安备 33010602011771号