
Highcharts 在Vue3 TS 引入
前沿
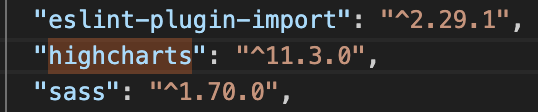
在vue3 中引入 Highcharts
但是在你要是这么引入的话最新的版本 Highcharts
然后就在 main.ts下引入就会报错
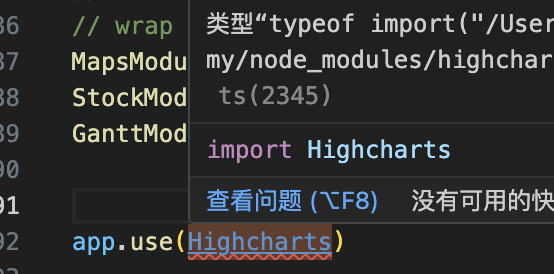
// Use the HighchartsVue plugin, register <highcharts> component
// @ts-ignore
app.use(Highcharts)
这么写虽然不会报错,但是还是无法在页面里面使用
然后查阅和自己研究了
提供了3种方案 可以在在Vue3 TS中可以引入 Highcharts 方案
第一种
在types 目录下, 新建 extends.d.ts
输入
/// <reference types="../../node_modules/highcharts" />
解释:
如果指定了--noResolve编译选项,三斜线引用会被忽略;它们不会增加新文件,也不会改变给定文件的顺序。
/// <reference types="..." />
与 /// <reference path="..." />指令相似,这个指令是用来声明 依赖的; 一个 /// <reference types="..." />指令则声明了对某个包的依赖。
然后在 runtime 下新建一个highchart.ts 文件
写入
import Highcharts from 'highcharts';
export default Highcharts;
这样 在你使用的页面里面引入就OK了
import Highcharts from "@/runtime/highchart";


dayChart = Highcharts.chart('dayChart', {
accessibility: {
enabled: false
},
chart: {
zoomType: 'xy',
type: "column",
},
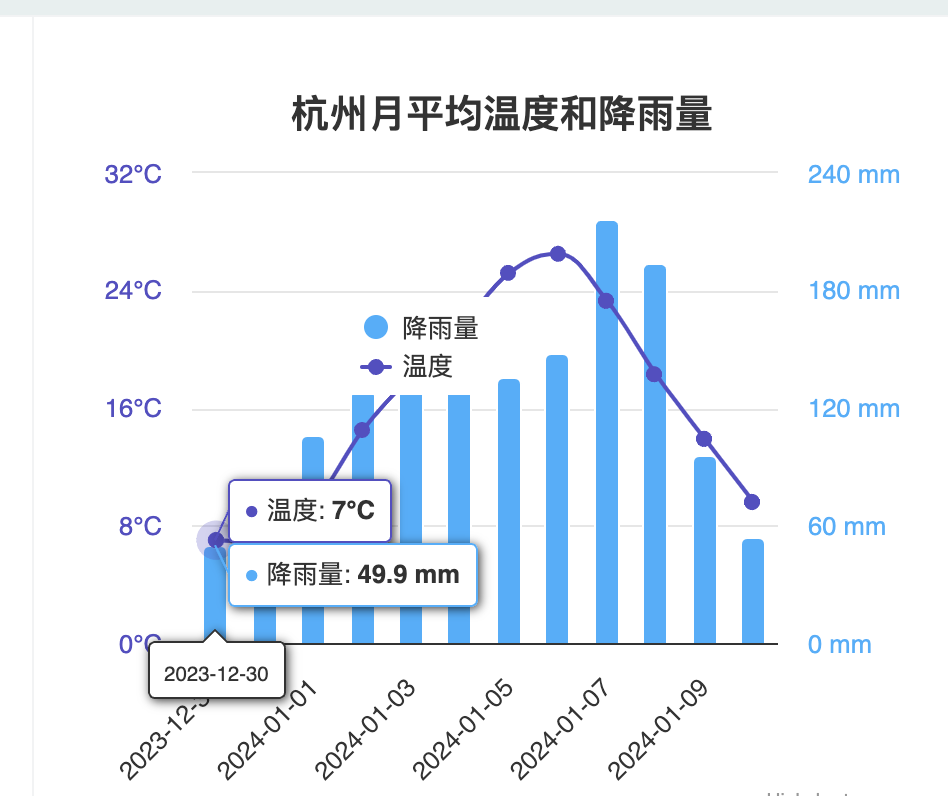
title: {
text: '杭州月平均温度和降雨量'
},
subtitle: {
// text: '数据来源: WorldClimate.com'
},
xAxis: [{
// categories: ['Jan', 'Feb', 'Mar', 'Apr', 'May', 'Jun',
// 'Jul', 'Aug', 'Sep', 'Oct', 'Nov', 'Dec'],
// crosshair: true,
categories: [],
allowDecimals: false, //不允许小数
type: "category", //自定义X坐标类别
showEmpty: false,
}],
yAxis: [{ // Primary yAxis
labels: {
format: '{value}°C',
style: {
color: Highcharts.getOptions().colors[1]
}
},
title: {
enabled: false,
text: '温度',
style: {
color: Highcharts.getOptions().colors[1]
}
}
}, { // Secondary yAxis
title: {
enabled: false,
text: '降雨量',
style: {
color: Highcharts.getOptions().colors[0]
}
},
labels: {
format: '{value} mm',
style: {
color: Highcharts.getOptions().colors[0]
}
},
opposite: true
}],
tooltip: {
split: true,
shared: true
},
legend: {
layout: 'vertical',
align: 'left',
x: 120,
verticalAlign: 'top',
y: 100,
floating: true,
backgroundColor: (Highcharts.theme && Highcharts.theme.legendBackgroundColor) || '#FFFFFF'
},
series: [{
name: '降雨量',
type: 'column',
yAxis: 1,
data: [49.9, 71.5, 106.4, 129.2, 144.0, 176.0, 135.6, 148.5, 216.4, 194.1, 95.6, 54.4],
tooltip: {
valueSuffix: ' mm'
}
},
{
name: '温度',
type: 'spline',
data: [7.0, 6.9, 9.5, 14.5, 18.2, 21.5, 25.2, 26.5, 23.3, 18.3, 13.9, 9.6],
tooltip: {
valueSuffix: '°C'
}
}]
});
这样 就能在图表中引入
第二种:
就是注册全局的方法 app.config.globalProperties 的方法
import Highcharts from "highcharts";
import MapsModule from "highcharts/modules/map";
import StockModule from "highcharts/modules/stock";
import GanttModule from "highcharts/modules/gantt";

// In order to use Highcharts Maps we need to
// wrap Highcharts with the correct module:
MapsModule(Highcharts);
StockModule(Highcharts)
GanttModule(Highcharts);

// Use the HighchartsVue plugin, register <highcharts> component
// @ts-ignore
app.use(Highcharts)

app.config.globalProperties.highcharts = Highcharts;
window.highcharts = Highcharts;
然后调用 window 下的 方法直接只用
console.log(proxy.isEnglish)
console.log(window.highcharts)
OK
第3种
就是在你的chart 文件下单独引入 这个包 也不会报错 就可以了
import Highcharts from 'highcharts/es-modules/masters/highcharts.src.js';
import 'highcharts/es-modules/masters/highcharts-more.src.js';
import 'highcharts/es-modules/masters/modules/boost.src.js';
import 'highcharts/es-modules/masters/modules/no-data-to-display.src.js';
推荐第三种, 因为这很好用
然后会报 黄色警告,然后在charts 下引入这个 (在你使用的图表下引入)
 accessibility: {
      enabled: false
 }
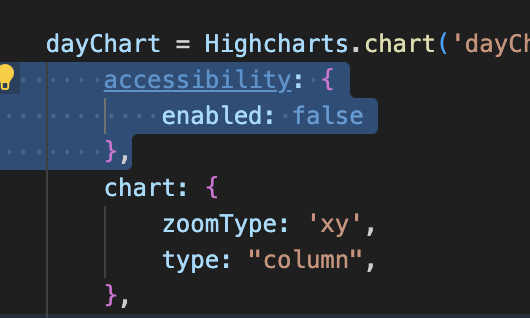
然后使用了
rollup-plugin-visualizer 分析
plugins: [vue(),
  visualizer({
    emitFile: true,
    filename: 'stats.html',
    open: true,
    // gzipSize: true,
    // brotliSize: true,
  })
  ],
第一种是 按照引入
包的大小
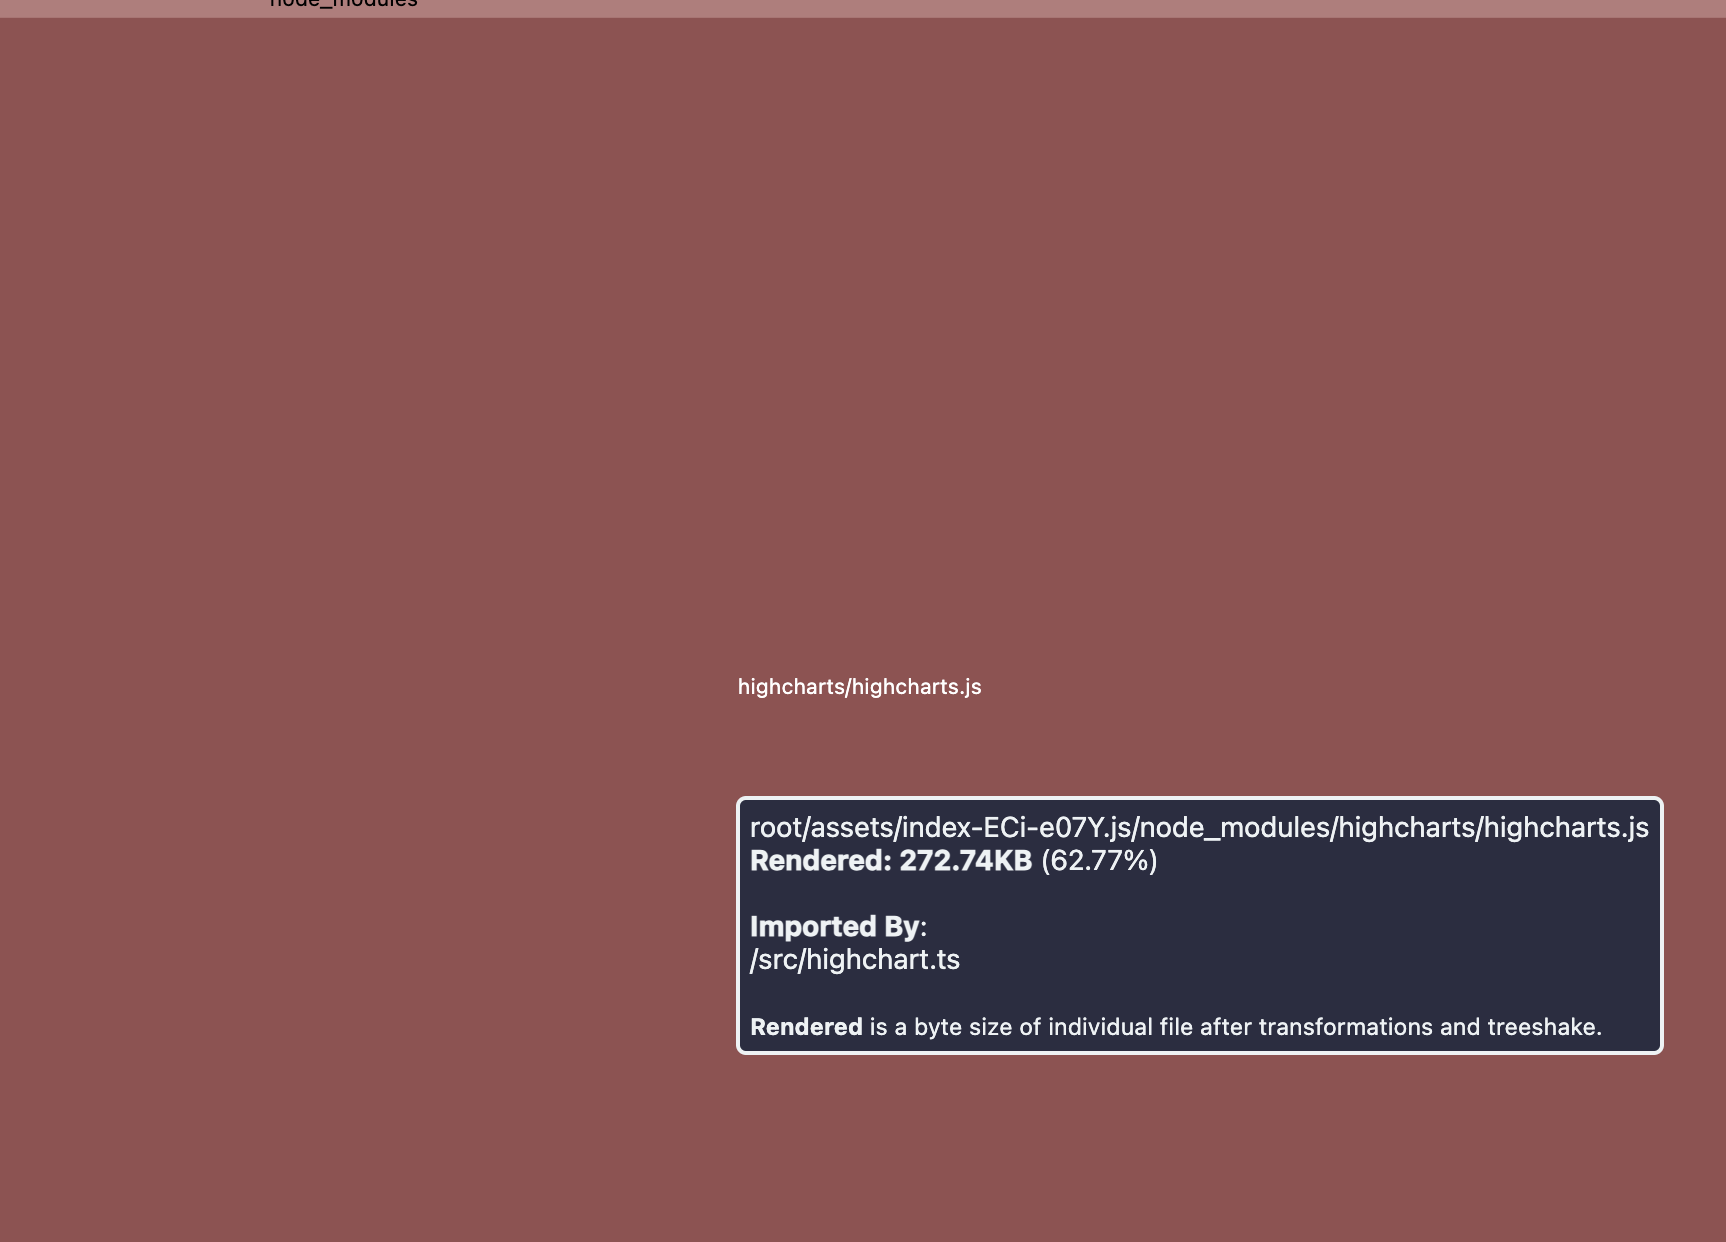
62.77%. 272.74KB 很大
第三种引入的方式 的大小
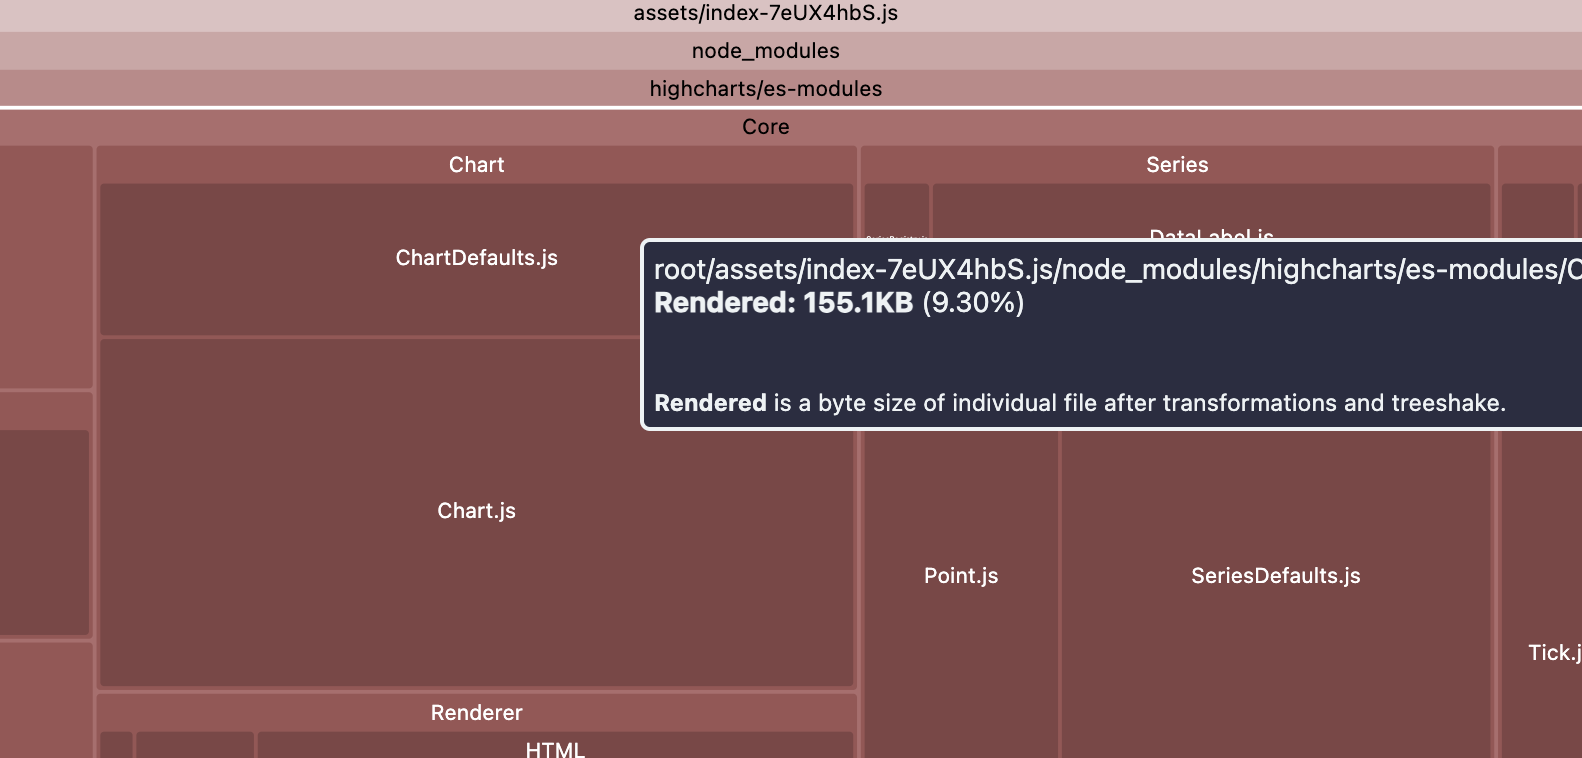
就155.1 少了一半
那显然易见了 , 真的就第三种 ,然后就OK了

 浙公网安备 33010602011771号