将Python123中作业成绩绘制成雷达图


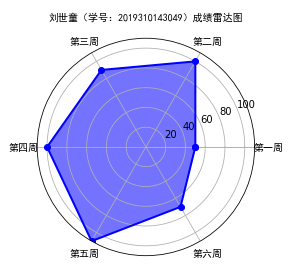
import numpy as np
import matplotlib.pyplot as plt

#标签
labels = np.array(['第一周','第二周','第三周','第四周','第五周','第六周'])
#数据个数
dataLenth = 6
#数据
data = np.array([50,100,90,100,110,70])

angles = np.linspace(0, 2*np.pi, dataLenth, endpoint=False)
data = np.concatenate((data, [data[0]])) # 闭合
angles = np.concatenate((angles, [angles[0]])) # 闭合

fig = plt.figure()
ax = fig.add_subplot(111, polar=True)# polar参数!!
ax.plot(angles, data, 'bo-', linewidth=2)# 画线
ax.fill(angles, data, facecolor='b', alpha=0.55)# 填充
ax.set_thetagrids(angles * 180/np.pi, labels, fontproperties="SimHei")
ax.set_title("刘世童(学号:2019310143049)成绩雷达图", va='bottom', fontproperties="SimHei")
ax.set_rlim(0,110)
ax.grid(True)
plt.show()
效果图: