Prometheus实现 windows 机器 ,并在Grafana上看到指标
Promethues 在Linux环境下部署;
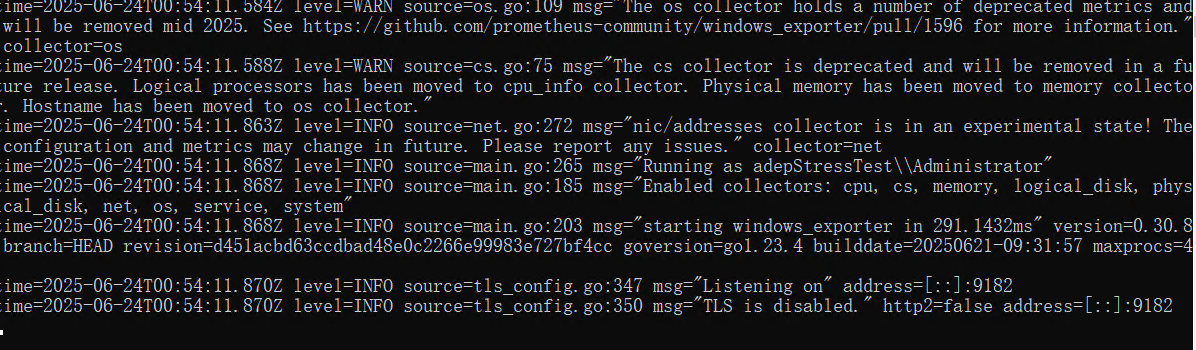
下载Windows版本的node_exporter,放到Windows服务器上,并双击运行;
下载地址:https://github.com/prometheus-community/windows_exporter/releases
![]()
运行成功截图
在Promethues 配置文件 添加node_exporter的地址,端口是9182;添加后,重启Promethues ;
scrape_configs:
  # The job name is added as a label `job=<job_name>` to any timeseries scraped from this config.
  - job_name: "prometheus"
    static_configs:
      - targets: ["10.1.13.17:9100"]
  - job_name: "node_exporter_10.53.9.18:9182"
    metrics_path: '/metrics'
    static_configs:
      - targets: ["10.53.9.18:9182"]
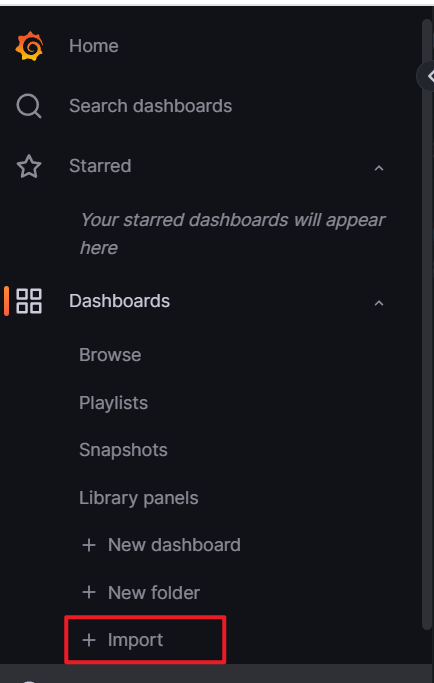
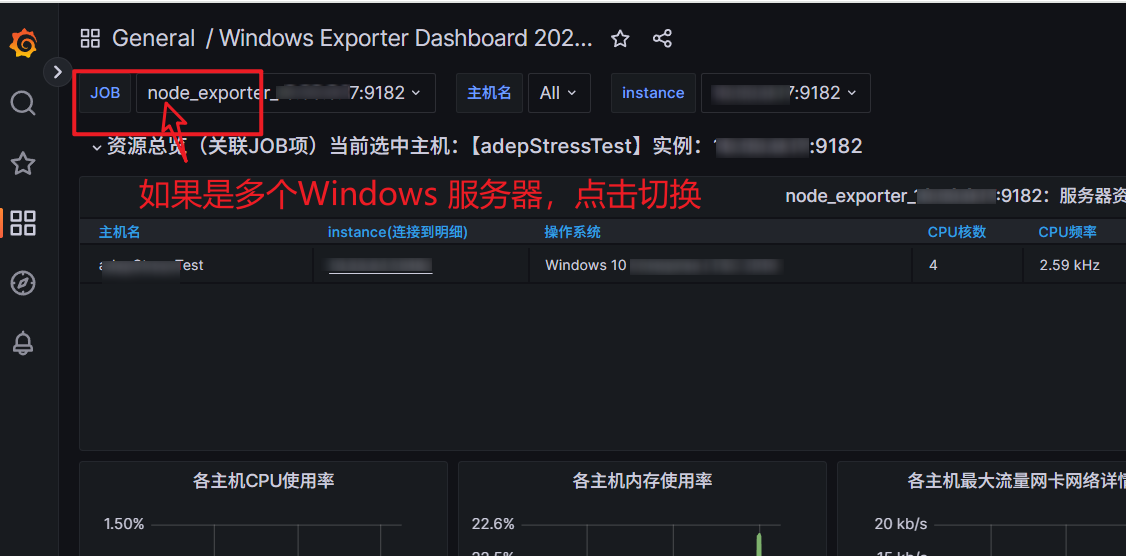
进入Grafana,添加可查看Windows node_exporter的模版:比如:10467;

 浙公网安备 33010602011771号