使用cAdvisor监控docker容器
1、确保安装docker
2、下载cAdvisor
docker pull google/cadvisor
3、使用docker-compose.yml启动cAdvisor;
cAdvisor可以监控到所有容器;为什么会这么神奇,请阅读:https://www.cnblogs.com/ychun/p/18902962
创建docker-compose.yml
version: '3.8'

services:
  cadvisor:
    image: google/cadvisor  # 官方镜像
    container_name: cadvisor                # 固定容器名
    ports:
      - "19100:8080"                       # 暴露Web UI端口
    volumes:
      - /:/rootfs:ro                       # 挂载宿主机根目录(只读)
      - /var/run:/var/run:rw               # Docker运行时文件(读写)
      - /sys:/sys:ro                       # 系统信息(只读)
      - /var/lib/docker/:/var/lib/docker:ro # Docker数据目录(只读)
    privileged: true                       # 特权模式(必须)
    restart: unless-stopped                # 自动重启

###### 下面这些容器名不写也能监控到所有容器
  app1:
    image: nginx                           # 示例业务容器1
    labels:
      - "monitor=true"                     # 可选的监控标签

  app2:
    image: redis:latest                           # 示例业务容器2

  app3:
    image: bryink/oracle_jdk:8                           # 示例业务容器3

  app4:
    image: mysql:8.0.21                            # 示例业务容器4
4、启动
docker-compose up -d
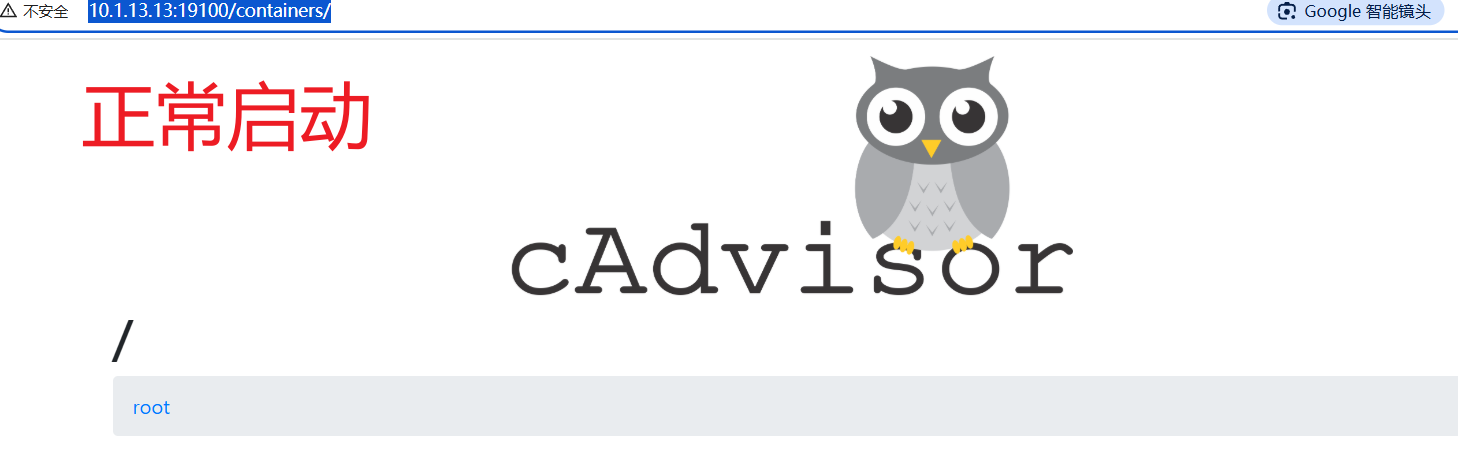
尝试访问:http://cAdvisor所在机器ID:19100/containers/ ,显示如下图即可正常访问
5、配置promethues 的promethues.yml文件
最重要的是写明数据源:
        labels:
          source: 'cadvisor'
scrape_configs:
  # The job name is added as a label `job=<job_name>` to any timeseries scraped from this config.
  - job_name: "prometheus"

    # metrics_path defaults to '/metrics'
    # scheme defaults to 'http'.

    static_configs:
      - targets: ["10.1.13.17:9100"]
  - job_name: "node_exporter_13.54"
    static_configs:
      - targets: ["10.1.13.54:9100"]

  - job_name: "cadvisor_13.13"
    scrape_interval: 10s
    metrics_path: '/metrics'
    static_configs:
      - targets: ["10.1.13.13:19100"]
        labels:
          source: 'cadvisor'
6、重启prometheus
7、在grafana添加该promethues为数据源
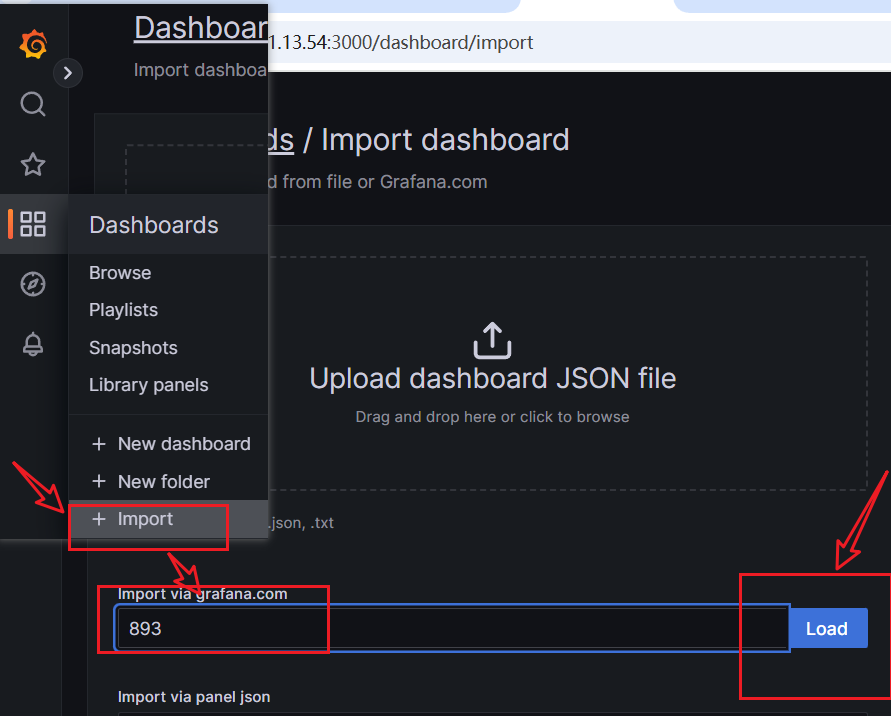
8、在grafana中添加支持该数据源的模版
输入模板ID比如: 893,由 Google cAdvisor 团队维护,包含容器和主机级指标;
也可以使用其他模版,比如14282,专门为 cAdvisor 设计的现代仪表,更直观的资源使用可视化; 比如 10619,专为 Prometheus + cAdvisor 优化,包含历史趋势分析,;比如:1860,结合容器和主机系统监控,包含告警面板;
个人推荐:14282
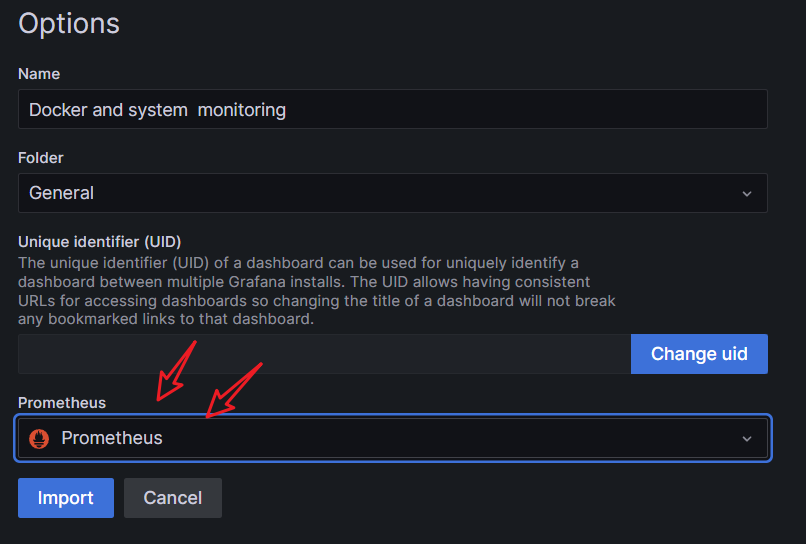
选择数据源是刚才创建的promethues
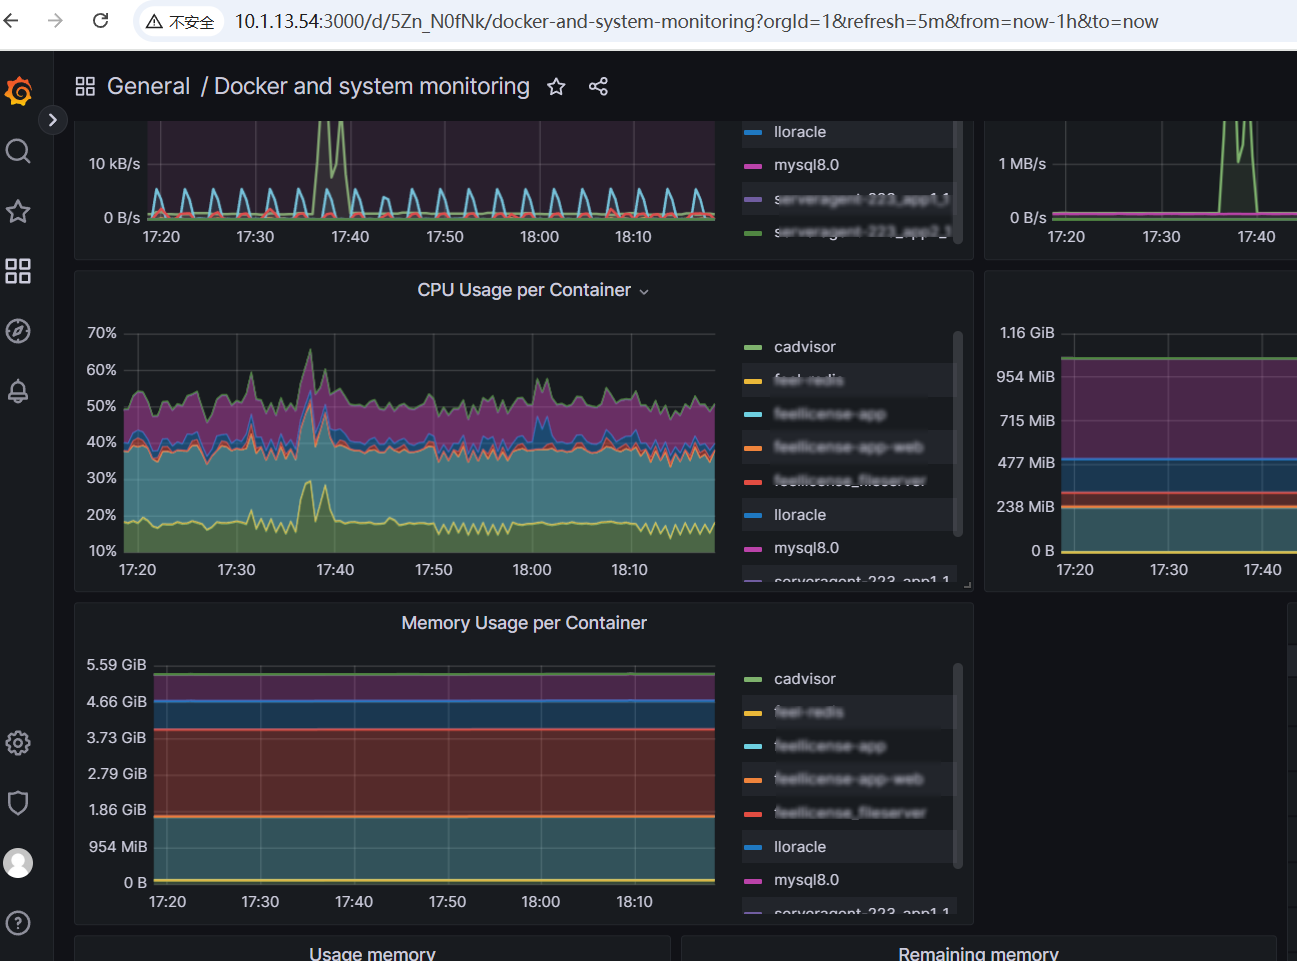
9、看到结果

 浙公网安备 33010602011771号