
第十节:开源监控系统Prometheus介绍、部署、及常见Exporter的安装使用
一. 简介
1. 介绍
官网:https://prometheus.io/download/
Prometheus (普罗米修斯)是一个开源的监控和报警系统,主要用于收集和存储时序数据。他的核心作用是监控应用和服务器等基础设施的状态,并根据收集到的数据进行报警。它能够对系统、服务、应用程序和硬件的各种指标(如 CPU 使用率、内存消耗、请求延迟等)进行实时监控。
2 关键组成
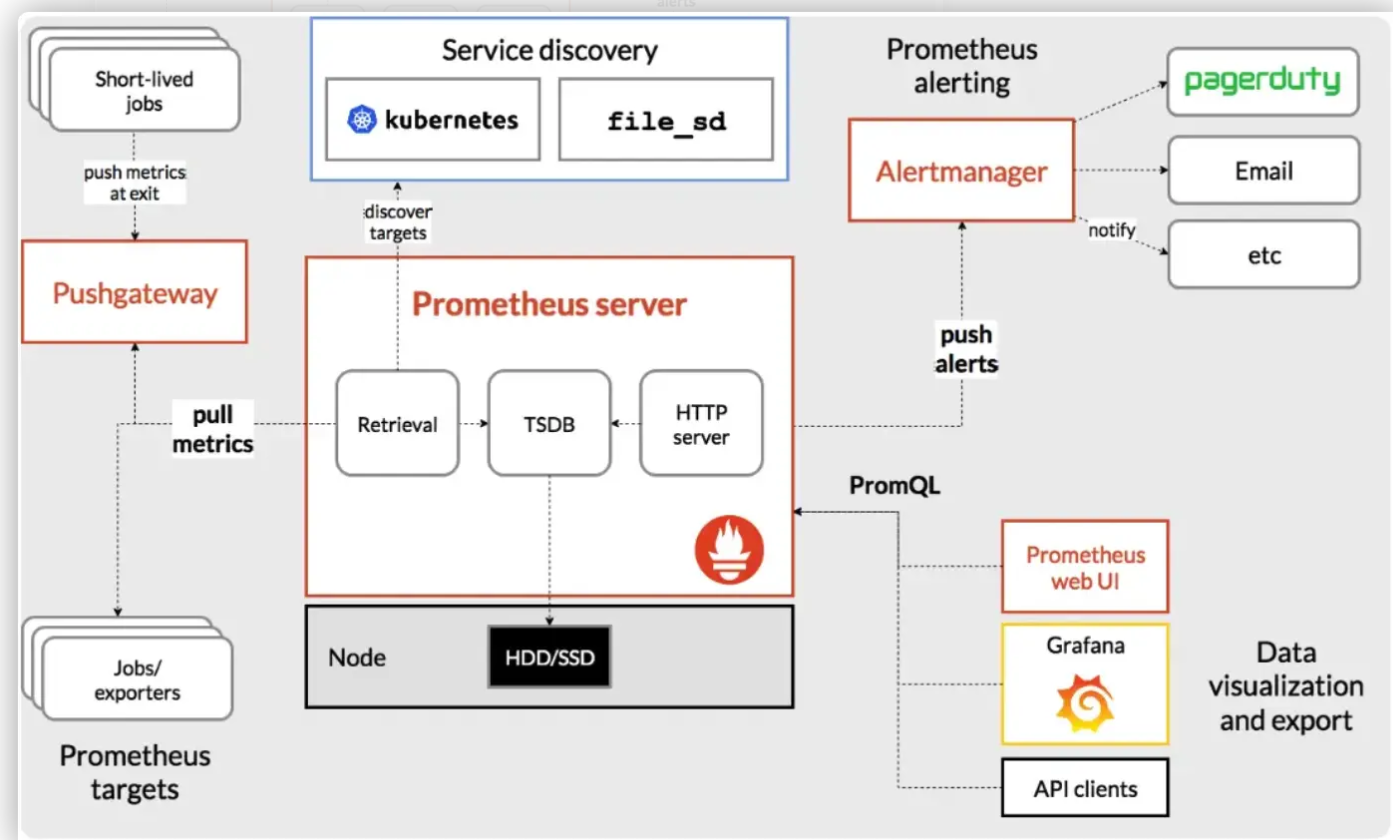
Prometheus 作为一个完整的监控系统,具有多个关键组件,每个组件都在不同的阶段执行特定的功能。以下是 Prometheus 的四个关键组件:
(1) Prometheus Server 是Prometheus 的核心组件,负责数据的采集、存储和查询。Prometheus Server 主要通过pull方式定期从被监控的目标(如 HTTP 服务、Exporters、Kubernetes 等)获取指标数据。它支持拉取不同类型的监控数据,如系统资源、应用状态、性能指标等。
(2) Alertmanager是报警相关组件,主要用于 Prometheus 相关监控的报警规则管理和预警。
(3) UI工具,这部分就是把 Prometheus 采集到的数据做图形化展示的,他自带了 web UI,但是效果不太好,一般都是采用 Grafana [ɡrəˈfɑːnə] 来进行图形界面展示的。
(4) Exporters 是一些专门用于暴露监控数据的服务。它们将各种服务或系统的内部状态以 Prometheus 可解析的格式(通常是 HTTP endpoint)暴露出来。常见的 Exporters:
A. Node Exporter:监控系统的硬件和操作系统级别的指标,如 CPU 使用率、内存消耗、磁盘空间、网络流量等。
B. MySQL Exporter:监控 MySQL 数据库的性能指标,如查询响应时间、连接数等。
C. Blackbox Exporter:用于监控网络服务的可用性,例如通过 HTTP、HTTPS、TCP 等协议进行探测。
D. Kubernetes Exporter:为 Kubernetes 集群提供监控数据,收集集群节点、Pod、容器等的性能指标。
E. 自定义 Exporters:用户也可以编写自己的 Exporter,以暴露特定应用程序或服务的监控数据
3 环境说明
服务器:阿里云centos stream 9.0
Prometheus:3.0.1 linux-amd64.tar.gz
node_exporter:1.8.2.linux-amd64.tar.gz
二. Prometheus部署
1. 下载
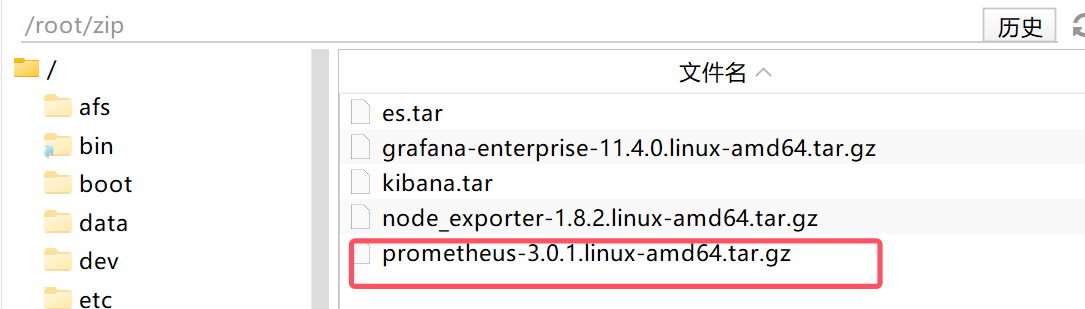
将下载后的 prometheus-3.0.1.linux-amd64.tar.gz 包copy到 /root/zip 目录下
2. 解压并重命名
解压到/root/目录下,并重命名为 prometheus_3.0.1
【tar -xf prometheus-3.0.1.linux-amd64.tar.gz】
【mv prometheus-3.0.1.linux-amd64.tar.gz /root/prometheus_3.0.1】
安装目录为:/root/prometheus_3.0.1
![]()
3. 创建服务文件
(1) 在下面路径中创建服务文件 prometheus.service
【touch /etc/systemd/system/prometheus.service】
PS:用户自定义的服务文件都是在 /etc/systemd/system/ 下,系统默认的服务在 /usr/lib/systemd/system/ 下,不建议在系统默认目录下创建
(2) 编写如下服务内容
绿色部分都要改为自己的安装目录:ExecStart=/root/prometheus_3.0.1/prometheus --config.file=/root/prometheus_3.0.1/prometheus.yml
[Unit]
Description=prometheus
Documentation=https://prometheus.io/
After=network.target

[Service]
Type=simple
User=root
Group=root
# 确保可执行文件路径正确(指向prometheus二进制文件)
ExecStart=/root/prometheus_3.0.1/prometheus --config.file=/root/prometheus_3.0.1/prometheus.yml --web.enable-lifecycle --web.external-url=http://60.205.120.80:9090
Restart=on-failure

[Install]
WantedBy=multi-user.target
4. 配置权限
【sudo chmod 777 /etc/systemd/system/prometheus.service】 # 服务文件授予可执行权限
【sudo chown root:root /etc/systemd/system/prometheus.service 】 # 确保所有者是 root
5. 启动服务
【sudo systemctl daemon-reload】 # 重新加载配置
【sudo systemctl start prometheus】 # 启动服务
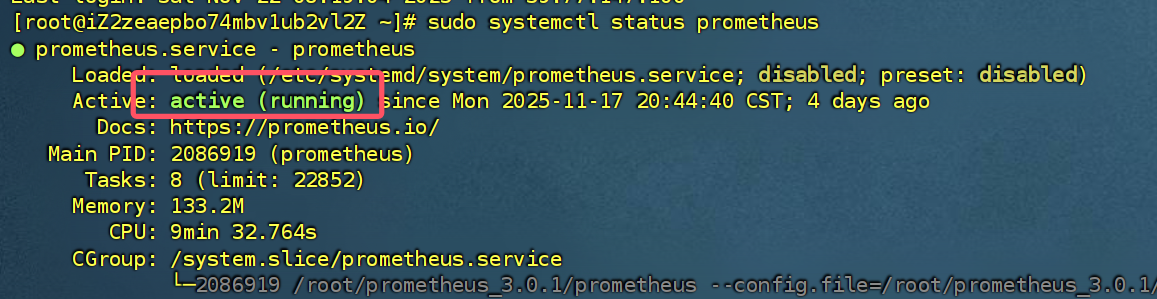
【sudo systemctl status prometheus 】 # 查看状态(若失败,日志会显示具体错误) 如下图
ps:补充开机自启动命令 【systemctl enable prometheus --now】
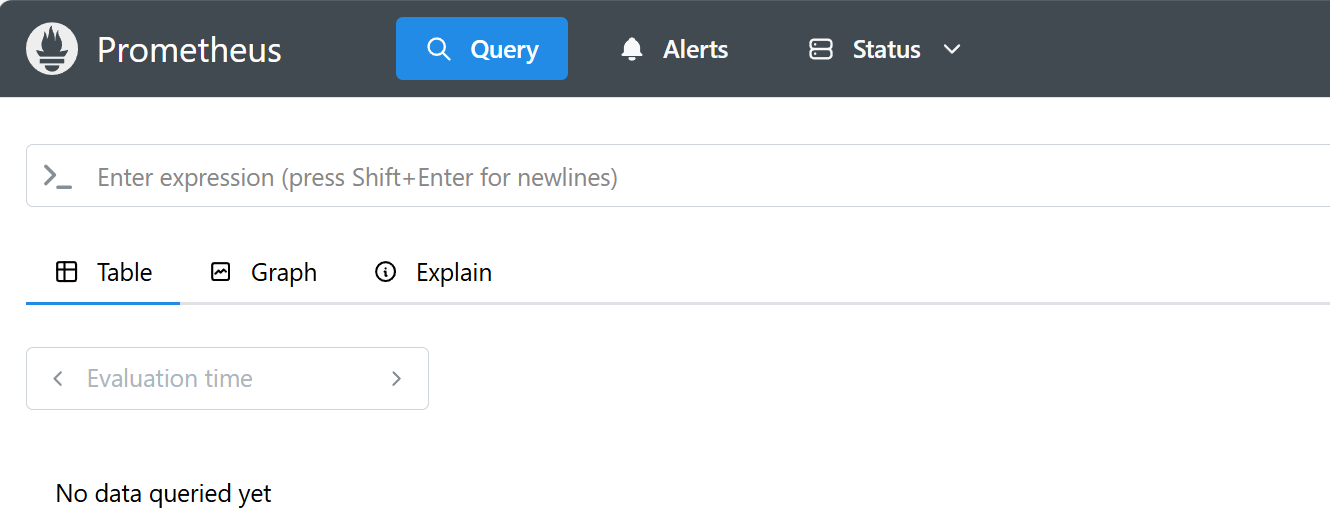
6. 查看地址
http://60.205.xx.80:9090/
7. 补充运维指令
三. Node Exporter安装
1. 下载
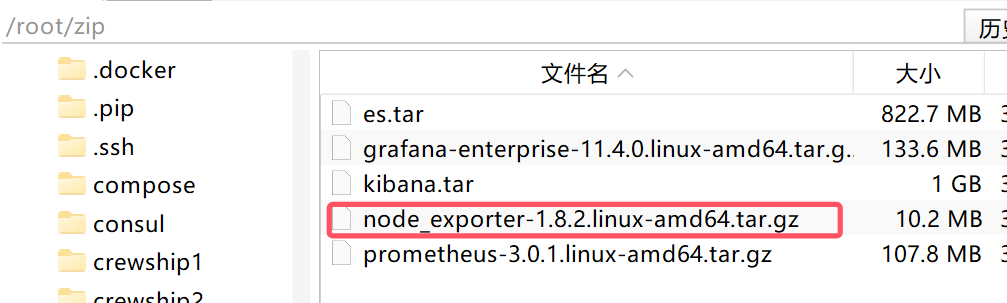
将下载后的 node_exporter-1.8.2.linux-amd64.tar.gz 包copy到 /root/zip 目录下
2. 解压并重命名
解压到/root/目录下,并重命名为 node_exporter_1.8.2
【tar -xf node_exporter-1.8.2.linux-amd64.tar.gz】
【mv node_exporter-1.8.2.linux-amd64.tar.gz /root/node_exporter_1.8.2】
安装目录为:/root/node_exporter_1.8.2
3. 创建服务文件
(1) 在下面路径中创建服务文件 node_exporter.service
【touch /etc/systemd/system/node_exporter.service】
PS:用户自定义的服务文件都是在 /etc/systemd/system/ 下,系统默认的服务在 /usr/lib/systemd/system/ 下,不建议在系统默认目录下创建
(2) 编写如下服务内容
绿色部分都要改为自己的安装目录:ExecStart=/root/node_exporter_1.8.2/node_exporter
[Unit]
Description=node_exporter
Documentation=https://prometheus.io/
After=network.target
[Service]
Type=simple
User=root
Group=root
ExecStart=/root/node_exporter_1.8.2/node_exporter
Restart=on-failure
[Install]
WantedBy=multi-user.target
4. 配置权限
【sudo chmod 777 /etc/systemd/system/node_exporter.service】 # 服务文件授予可执行权限
【sudo chown root:root /etc/systemd/system/node_exporter.service 】 # 确保所有者是 root
5. 启动服务
【sudo systemctl daemon-reload】 # 重新加载配置
【sudo systemctl start node_exporter】 # 启动服务
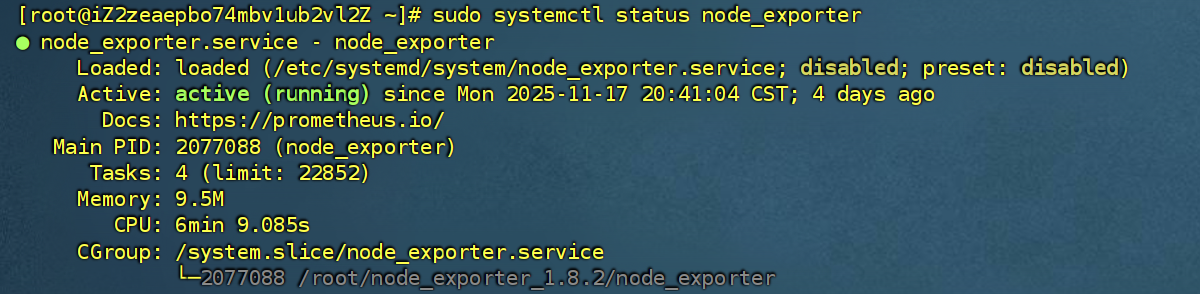
【sudo systemctl status node_exporter】 # 查看状态(若失败,日志会显示具体错误) 如下图
ps:补充开机自启动命令 【systemctl enable node_exporter --now】
6. 查看地址
http://60.205.xx.80:9100/ 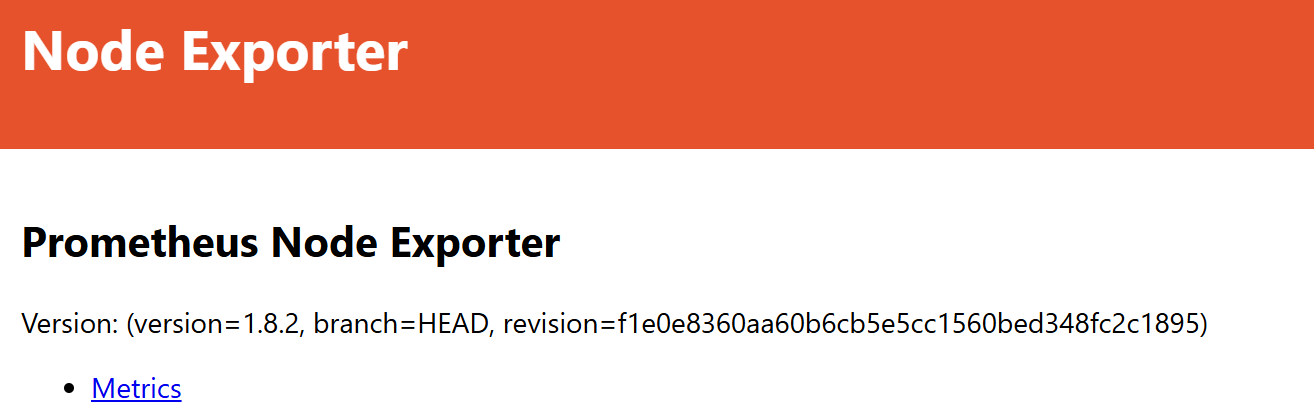
7. 补充运维指令
查看端口,显示进程 ID 和名称【netstat -ntlup】
查看 node_exporter 进程 【ps aux|grep node_exporter 】
查看详细日志 【journalctl -u node_exporter -f】
8. 关联Prometheus
修改下面文件 /root/prometheus_3.0.1/prometheus.yml
加入node_exporter 对应的9100端口,不在一台机器上则写ip地址即可
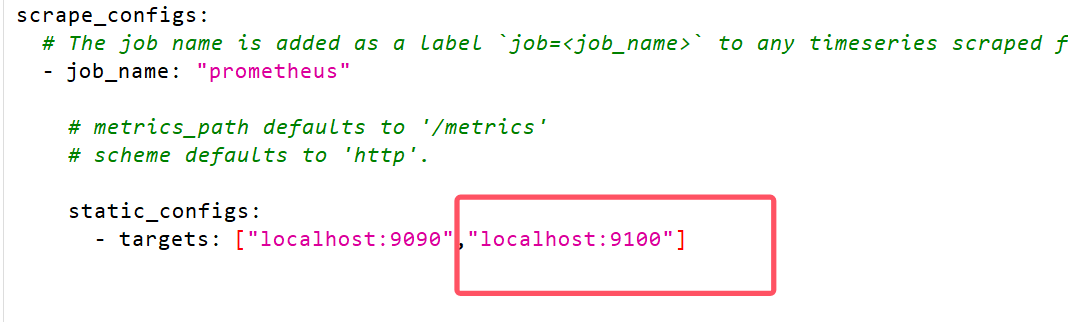
然后重启Prometheus服务: 【systemctl restart prometheus】 ,重新访问9090端口,如下图
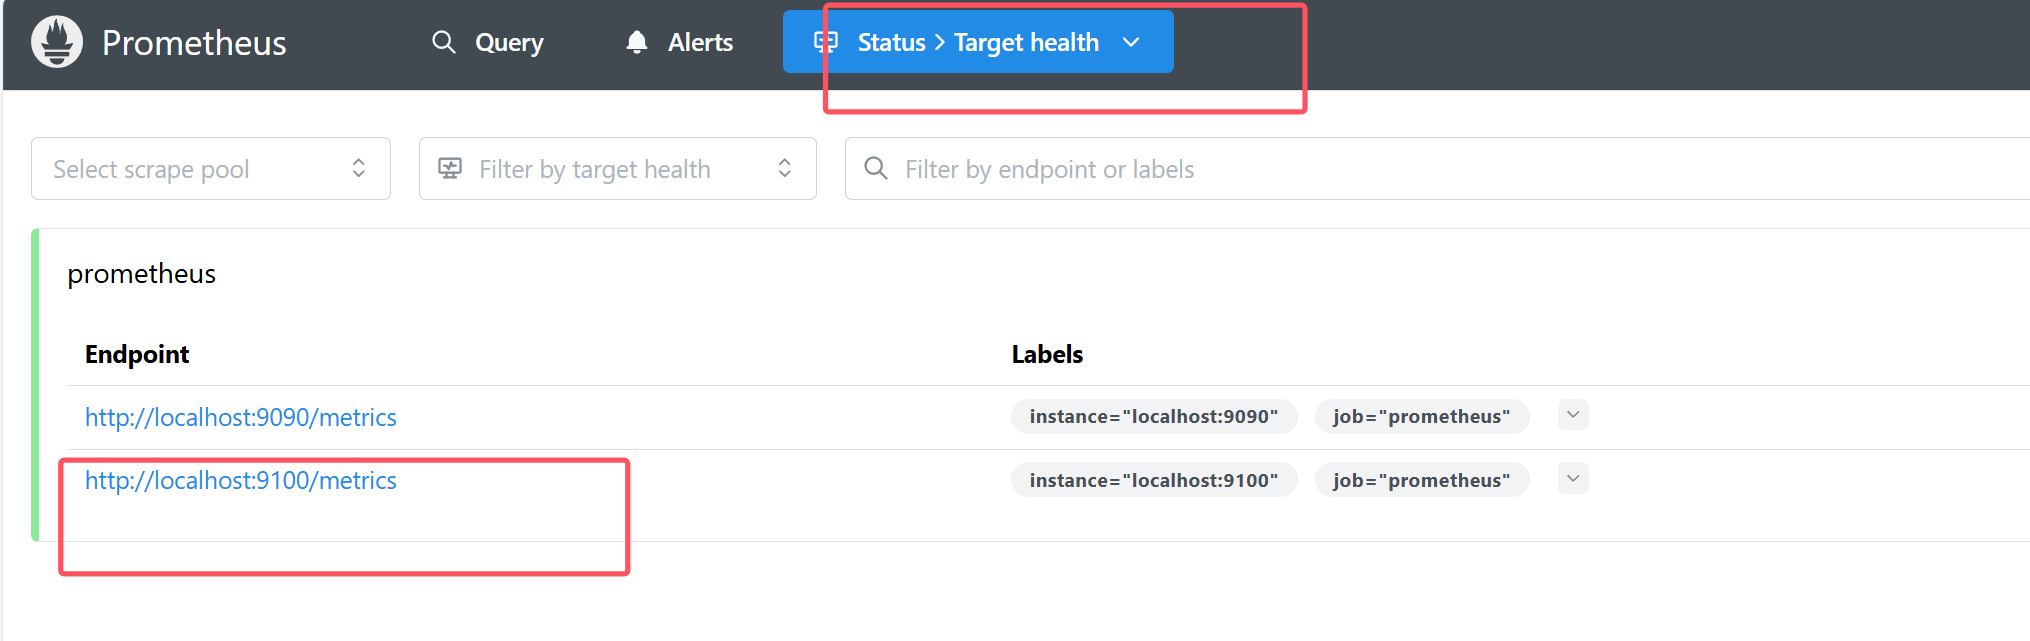
!
- 作 者 : Yaopengfei(姚鹏飞)
- 博客地址 : http://www.cnblogs.com/yaopengfei/
- 声 明1 : 如有错误,欢迎讨论,请勿谩骂^_^。
- 声 明2 : 原创博客请在转载时保留原文链接或在文章开头加上本人博客地址,否则保留追究法律责任的权利。

 浙公网安备 33010602011771号