

import rasterio
import matplotlib.pyplot as plt
import numpy as np
def imageshow(image, title):
plt.figure(figsize=(15, 8))
plt.imshow(image, cmap='viridis')
plt.colorbar()
plt.title(title)
plt.show()
文件地址
sr_o_image
sr_e_image
output_srre_image_dir
output_smc_image_dir
with rasterio.open(sr_e_image, 'r') as ds:
mask = ds.read(1)
mask = np.isfinite(mask)
with rasterio.open(sr_o_image, 'r') as ds:
bands = ds.read(range(1,8)).astype(np.float32) # (7, 4110, 11661)
height, width = ds.height, ds.width
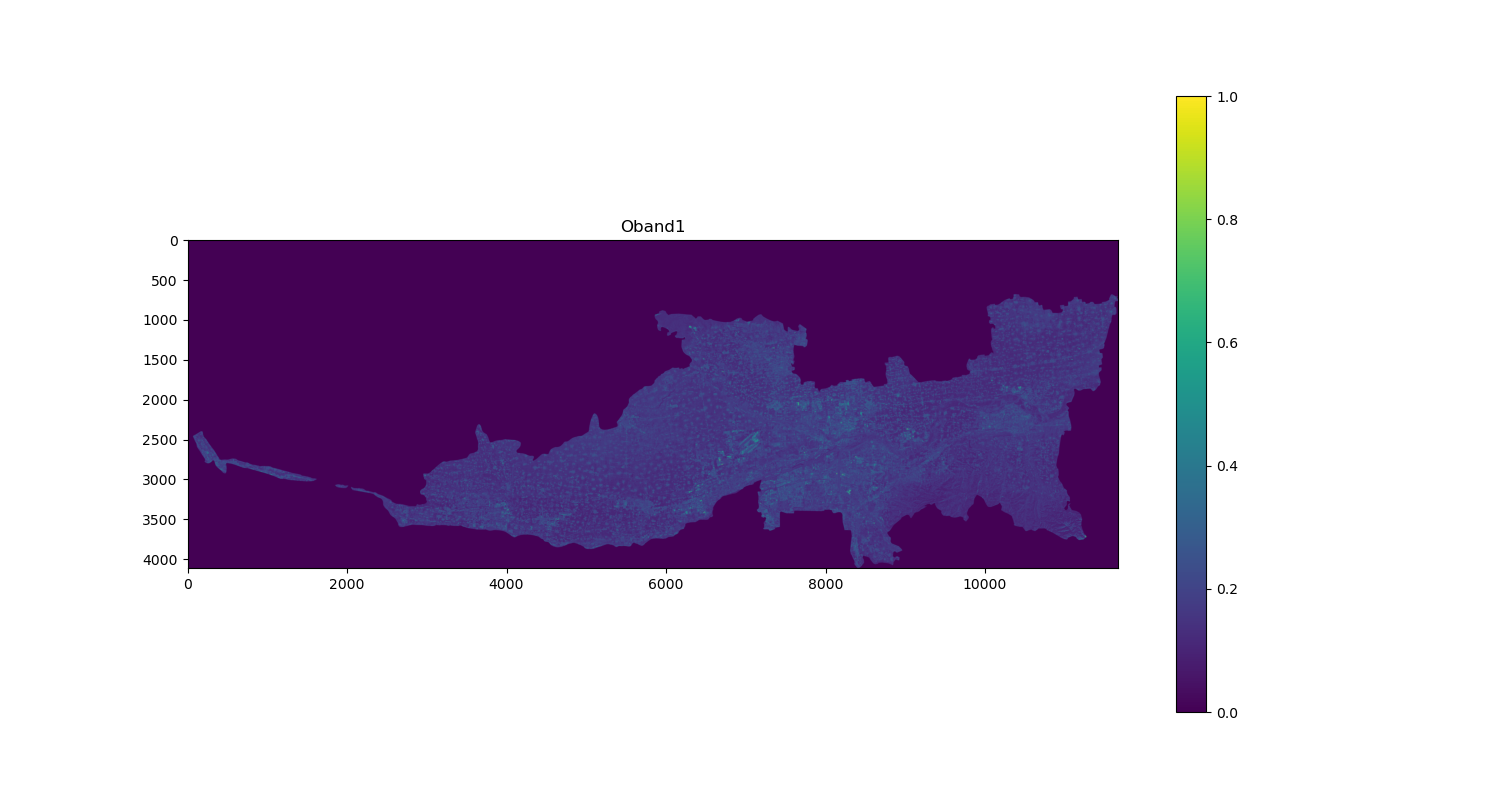
bands = np.clip(bands, 0, 1.0)
print("原始7个波段形状:", bands.shape)
imageshow(bands[0], "Oband1")
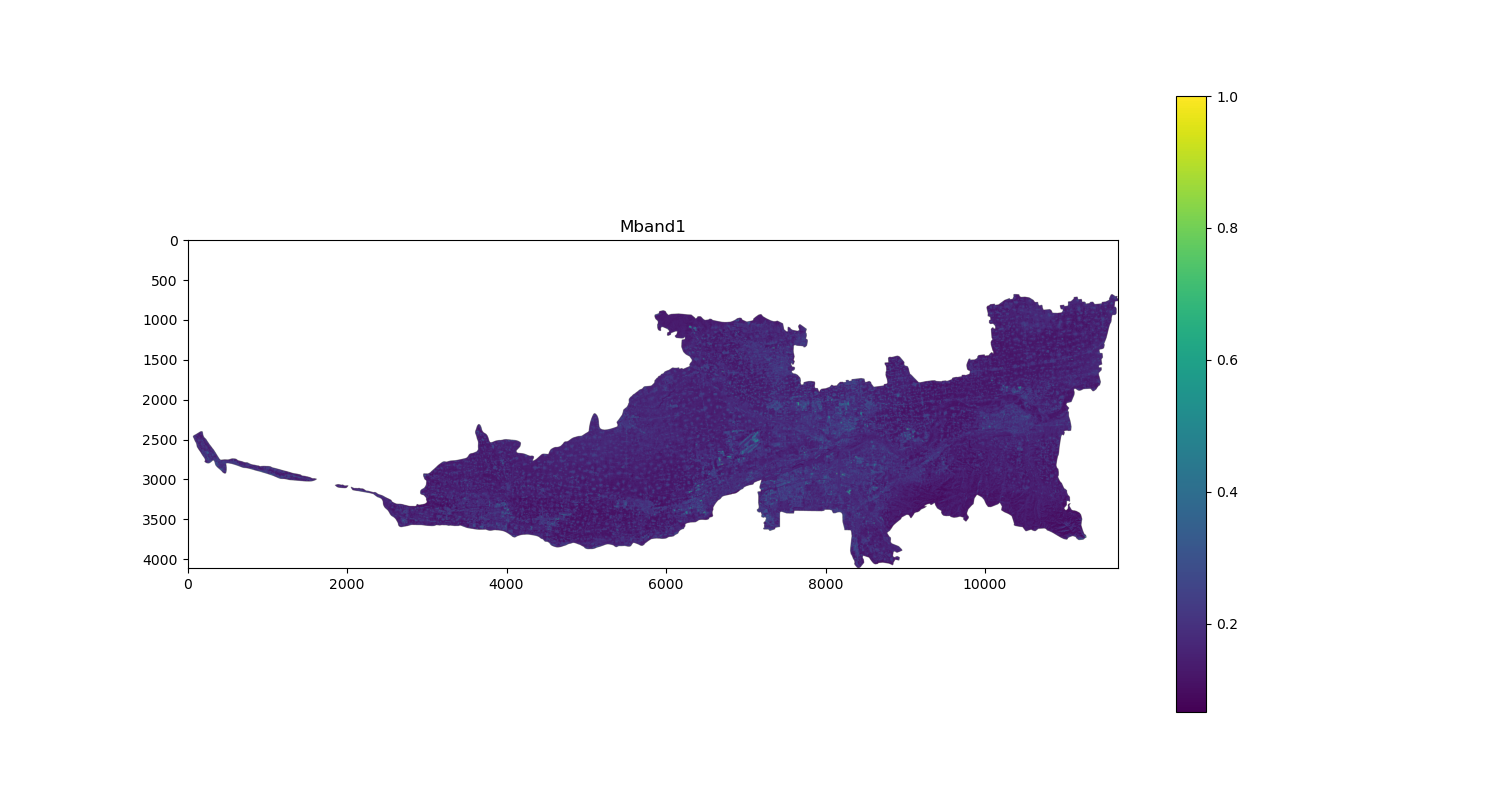
bands_masked = np.where(mask, bands, np.nan)
print("遮盖后7个波段形状:",bands_masked.shape)
imageshow(bands_masked[0], "Mband1")
X_2d = bands_masked.reshape(7,-1).T  # 转置后形状: (n_samples, n_features) 方便输入机器学习模型
print(f"转换后形状: {bands_masked.reshape(7,-1).shape}")
print(f"转置后形状: {X_2d.shape}")  #  (47926710, 7)

X_back = X_2d.T.reshape(7, height, width) 对于机器学习模型的输出结果,必须将其重新转置,否则数据会错乱
print(f"转回来的形状: {X_back.shape}")  # (7, 4110, 11661)
imageshow(X_back[0], "Bband1")

