Elasticsearch + Logstash + Kibana +Redis +Filebeat 单机版日志收集环境搭建
1.前置工作
1.虚拟机环境简介
Linux版本:Linux localhost.localdomain 3.10.0-862.el7.x86_64 #1 SMP Fri Apr 20 16:44:24 UTC 2018 x86_64 x86_64 x86_64 GNU/Linux
ip地址:192.168.1.4(虚拟机Nat配置可参考我的CSDN博客https://blog.csdn.net/yanshaoshuai/article/details/97689891)
Java环境:java 12.0.2(java环境安装可以参考我的CSDN博客https://blog.csdn.net/yanshaoshuai/article/details/87868286)
2.用户及权限配置
由于ELK产品不能以root用户运行,所以要先创建一个普通用户,并且最低要给予该用户你运行程序目录的执行权限,以及配置文件的修改权限和运行程序中产生文件的读写权限等。
#创建用户和组
[root@localhost gz]# groupadd es_group
[root@localhost gz]# useradd es_user
[root@localhost gz]# passwd es_user
Changing password for user es_user.
New password:
BAD PASSWORD: The password is shorter than 8 characters
Retype new password:
passwd: all authentication tokens updated successfully.
#把用户添加到组
[root@localhost gz]#  usermod -g es_group es_user
#更改目录所有者为新用户
[root@localhost es]# chown -R es_user:es_group /opt/es
2.Elasticsearch 7.2版本安装配置
下载链接:https://artifacts.elastic.co/downloads/elasticsearch/elasticsearch-7.2.0-linux-x86_64.tar.gz
解压:切换到前面创建的es_user用户执行下面命令
[es_user@localhost es]$ tar -xzvf ./gz/elasticsearch-7.2.0-linux-x86_64.tar.gz -C .
切换到root用户修改elasticsearch配置文件:
[root@localhost ~]# vim /opt/es/elasticsearch-7.2.0/config/elasticsearch.yml
#配置文件内容
# Path to directory where to store the data (separate multiple locations by comma):
#
path.data: /opt/es/elasticsearch-7.2.0/data
#
# Path to log files:
#
path.logs: /opt/es/elasticsearch-7.2.0/logs
# Set the bind address to a specific IP (IPv4 or IPv6):
#
network.host: 192.168.1.4
#
# Set a custom port for HTTP:
#
http.port: 9200
# Bootstrap the cluster using an initial set of master-eligible nodes:
#
cluster.initial_master_nodes: ["192.168.1.4"]
切换到es_user用户启动Elasticsearch:
./elasticsearch-7.2.0/bin/elasticsearch
启动报错及处理:
ES启动三个报错的处理
[1]: max file descriptors [4096] for elasticsearch process is too low, increase to at least [65536]
[2]: max number of threads [3829] for user [elk] is too low, increase to at least [4096]
[3]: max virtual memory areas vm.max_map_count [65530] is too low, increase to at least [262144]
在root用户下修改下面文件内容
最大文件打开数调整/etc/security/limits.conf
* - nofile 65536
最大打开进程数调整/etc/security/limits.d/20-nproc.conf
* - nproc 10240
内核参数调整 /etc/sysctl.conf
vm.max_map_count = 262144
修改完毕后再次启动即可。
启动成功测试:
[root@localhost ~]# curl 192.168.1.4:9200
{
  "name" : "localhost.localdomain",
  "cluster_name" : "elasticsearch",
  "cluster_uuid" : "0cwX-EgVR8W-61tlZV7cXg",
  "version" : {
    "number" : "7.2.0",
    "build_flavor" : "default",
    "build_type" : "tar",
    "build_hash" : "508c38a",
    "build_date" : "2019-06-20T15:54:18.811730Z",
    "build_snapshot" : false,
    "lucene_version" : "8.0.0",
    "minimum_wire_compatibility_version" : "6.8.0",
    "minimum_index_compatibility_version" : "6.0.0-beta1"
  },
  "tagline" : "You Know, for Search"
}
后台启动加上 -d 参数即可
3.Kinaba 7.2版本安装配置
下载链接:https://artifacts.elastic.co/downloads/kibana/kibana-7.2.0-linux-x86_64.tar.gz
解压:切换到前面创建的es_user用户执行下面命令
tar -xzvf ./gz/kibana-7.2.0-linux-x86_64.tar.gz -C ./
修改Kibana配置文件:
vim ./kibana-7.2.0-linux-x86_64/config/kibana.yml
#配置文件内容
# Kibana is served by a back end server. This setting specifies the port to use.
server.port: 5601
# To allow connections from remote users, set this parameter to a non-loopback address.
server.host: "192.168.1.4"
# The URLs of the Elasticsearch instances to use for all your queries.
elasticsearch.hosts: ["http://192.168.1.4:9200"]
防火墙对外开放5601端口:
[root@localhost ~]# firewall-cmd --zone=public --add-port=5601/tcp --permanent
success
[root@localhost ~]# firewall-cmd --reload
success
启动kibana:
./kibana-7.2.0-linux-x86_64/bin/kibana
远程访问kibana:
在浏览器输入192.168.1.4:5601回车即可访问到kibana

选择Explore on my own点击最下方箭头展开kibana选项卡,然后选择Dev Tools-->Console即可在kibana上操作ES了。
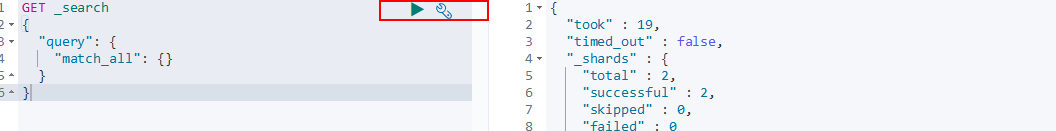
ES简单操作:
# 获取所有索引数据
GET _search
{
  "query": {
    "match_all": {}
  }
}
# 查询索引下所有数据
GET /shijiange/_doc/_search?q=*
# 删除索引
DELETE /shijiange
# 添加索引数据(若无索引会创建索引)
PUT /shijiange/_doc/1
{
  "name":"yanshaoshuai",
  "age":19
}
# 覆盖
PUT /shijiange/_doc/1
{
  "age":19
}
# 修改
POST /shijiange/_doc/1/_update
{
  "doc":{
   "name":"yan1"
  }
}
Console中输入正确操作语句后点击后面绿色按钮即可执行该语句
4.Logstash7.2版本安装配置
下载链接:https://artifacts.elastic.co/downloads/logstash/logstash-7.2.0.tar.gz
解压:切换到es_user用户下执行以下操作
tar -xzvf /opt/es/gz/logstash-7.2.0.tar.gz -C /opt/es
简单启动
编写简单配置文件:
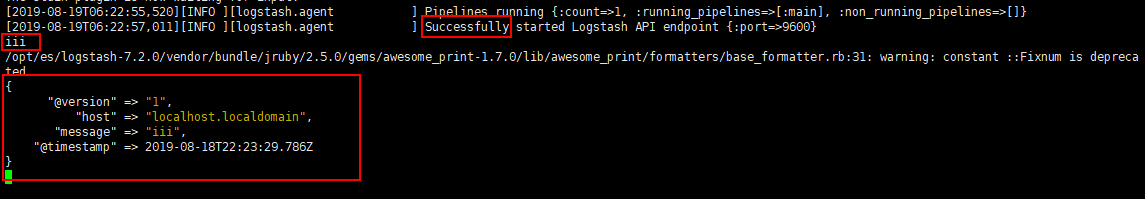
# 标准输入-->logstash-->标准输出 的配置文件
vim /opt/es/logstash-7.2.0/config/logstash_std.conf
input{
  stdin{}
}
output{
  stdout{
    codec=>rubydebug
  }
}
以logstash_std.conf配置文件启动:
/opt/es/logstash-7.2.0/bin/logstash -f ./logstash_std.conf
启动成功后光标停滞在启动日志末尾,此时输入的内容会被logstash接收并且将处理后的数据打印在标准输出上:
读取日志文件并输出到Elasticsearch
编写配置文件:
# /opt/es/example.log-->logstash-->elasticsearch-->kibana
vim ./logstash_elk.conf
#logstash_elk.conf内容
input {
  file {
    path => "/opt/es/example.log"
  }
}
output {
  elasticsearch {
    hosts => ["http://192.168.1.4:9200"]
  }
}
以logstash_elk.conf启动(在先启动elasticsearch的情况下):
/opt/es/logstash-7.2.0/bin/logstash -f ./logstash_elk.conf
启动成功后测试如下:
echo 'test the elk config' >> /opt/es/example.log
等待数秒后在Kibana上查询所有数据:
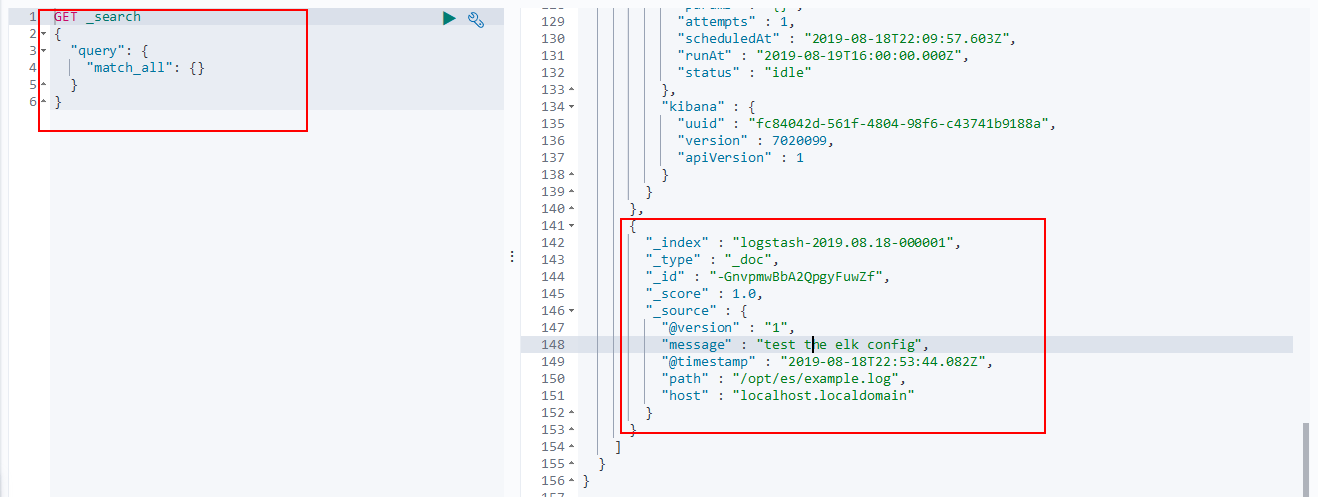
可以看到我们的ELK配置是成功的
但是Logstash作为日志收集软件在每一个机器上都启动一份的话显得过于臃肿,一般都是在各个服务其上用更轻量级的filebeat来简单的收集日志,然后多台服务器的日志发送到redis中,利用redis的消息队列功能实现日志的序列化,然后logstash再统一消费redis队列中的日志内容,利用其丰富的输入处理格式化能力将日志处理成便于阅读的格式然后发送给elasticsearch存储起来,接下来介绍filebeat和redis部分的内容。
5.Filebeat7.2版本安装配置
filebeat7.2下载链接:https://artifacts.elastic.co/downloads/beats/filebeat/filebeat-7.2.0-linux-x86_64.tar.gz
解压:切换到es_user用户执行以下操作
tar -xzvf filebeat-7.2.0-linux-x86_64.tar.gz -C ../
filebeat读取日志文件发送到logstash配置:
logstash配置文件:
vim ./logstash_beat.conf
#logstash_beat.conf内容
input {
  beats {
    host => '192.168.1.4'
    port => 5044
  }
}
output {
  elasticsearch {
    hosts => ["http://192.168.1.4:9200"]
  }
}
logstash以logstash_beat.conf启动:
/opt/es/logstash-7.2.0/bin/logstash -f ./logstash_beat.conf
修改filebeat配置:
vim filebeat-7.2.0-linux-x86_64/filebeat.yml
# filebeat.yml内容
filebeat.inputs:
- type: log
  tail_files: true
  backoff: "1s"
  paths:
      - /opt/es/example.log

output:
  logstash:
    hosts: ["192.168.1.4:5044"]
启动filebeat:
./filebeat-7.2.0-linux-x86_64/filebeat -e -c ./filebeat-7.2.0-linux-x86_64/filebeat.yml
测试配置是否成功:
先删除之前的索引,否则会和之前的logstash发往elasticsearch所建立的索引冲突,从而产生Can't get text on a START_OBJECT at 1:446错误响应
在kibana执行:
DELETE /logstash-2019.08.18-000001
然后在命令行执行:
echo 'file-->logstash-->elasticsearch-->kibana' >> example.log
数秒后在kibana查看elasticsearch索引内容:
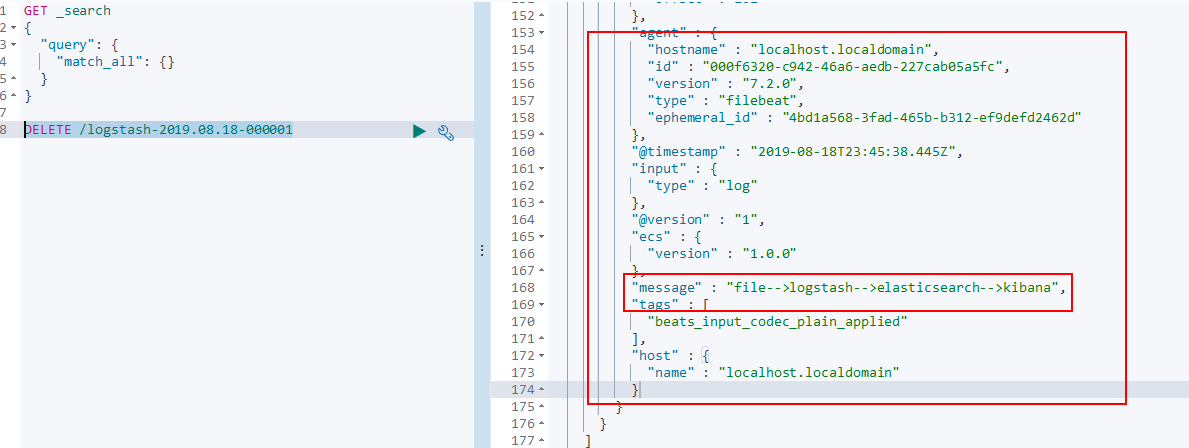
可以看到,我们新加的filebeat配置也可以成功的和ELK一起工作了。
接下来就是最后一步了,把redis也引入到我们的ELK之中,利用他的消息队列功能实现多个filebeat同时向ELK发送日志的功能。
6.引入Redis
redis的安装配置详细步骤请参考我dcsdn博客:https://blog.csdn.net/yanshaoshuai/article/details/97618991
在6379端口启动redis之后filebeat配置如下:
vim ./filebeat-7.2.0-linux-x86_64/filebeat.yml
# filebeat.yml内容
filebeat.inputs:
- type: log
  tail_files: true
  backoff: "1s"
  paths:
      - /opt/es/example.log
  fields:
    type: example.log
  fields_under_root: true
output:
  redis:
      hosts: ["192.168.1.4:6379"]
      key: 'queue'
在logstash的config目录下新建一个logstash_redis.conf配置文件,内容如下:
# logstash_redis.conf内容
input {
  redis {
    host => '192.168.1.4'
    port => 6379
    key => "queue"
    data_type => "list"
  }
}
output {
  elasticsearch {
    hosts => ["http://192.168.1.4:9200"]
  }
}
先保证redis正运行在你配置的端口,这里是6379端口,然后启动logstash和filebeat:
#以logstash_redis.conf文件启动logstash
/opt/es/logstash-7.2.0/bin/logstash -f ./logstash_redis.conf
# 启动filebeat
./filebeat-7.2.0-linux-x86_64/filebeat -e -c ./filebeat-7.2.0-linux-x86_64/filebeat.yml
logstash和filebeat启动后,向example.log中追加一条数据:
echo 'file-->redis-->logstash-->elasticsearch-->kibana' >> example.log
数秒后在kibana执行查询可以看到我们刚才追加到example.log中的信息数据,证明现在filebeat-->redis-->logstash-->elasticsearch-->logstash的配置是成功的

当然也可以用其它的消息队列替代redis,企业中一般用的是kafka消息队列,其原理与redis类似,就不赘述了。

 浙公网安备 33010602011771号