

angular2 图表指令ng2-echarts
一、安装
npm install echarts --save

npm install ng2-echarts --save
二、配置
1、angular-cli.json
"scripts": ["../node_modules/echarts/dist/echarts.min.js"]
2、相应模块module.ts
import { Ng2Echarts } from 'ng2-echarts';                     // 图表 - echart

@NgModule({
  declarations: [
    Ng2Echarts,
  ]
})
三、使用
1、html
<div class="echart-pie" [ng2-echarts]="incomesAmount" ></div>
2、component.ts
具体使用方法(或者默认参数设置)可参照echarts官网:http://echarts.baidu.com/examples.html
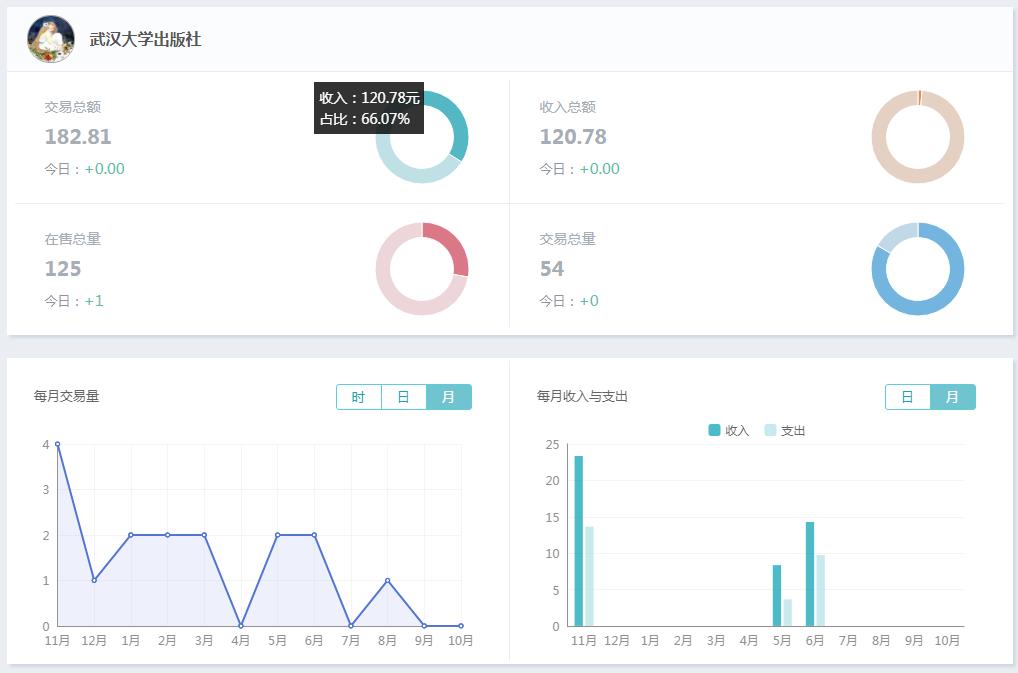
以空心饼图为例:
①、先设置默认参数defaultPieOptions如下:
 1 public defaultPieOptions = {
 2   series: [{
 3     type: 'pie',
 4     name: '交易总额',
 5     radius: ['67%', '100%'],
 6     minAngle: 5,
 7     avoidLabelOverlap: false,
 8     hoverAnimation: false,
 9     label: {
10       normal: {
11         show: false,
12         position: 'center',
13         textStyle: {
14           fontSize: '30',
15           fontWeight: 'bold'
16         }
17       },
18       emphasis: {
19         show: false
20       }
21     },
22     labelLine: {
23       normal: {
24         show: false
25       }
26     },
27     itemStyle: {
28       normal: {
29         borderWidth: 1,
30         borderColor: '#fff'
31       }
32     }
33   }],
34   color: ['#53b8c4', '#bfe0e4'],   // 有多少项就设置多少个颜色
35   tooltip: {
36     formatter: '{b}:{c}元<br/>占比:{d}%',
37     backgroundColor: 'rgba(0,0,0,0.8)',
38     borderColor: '#000',
39     borderRadius: 0,
40     padding: 5
41   },
42   legend: {
43     show: false
44   }
45 };
②、通过tradeAmountData()方法设置series属性来控制饼图的弧度,使用方法如下:
1   // 交易总额
2   tradeAmountData(obj) {
3     this.tradeAmount = CommonFuncService.clone(defaultPieOptions);    // 需要深拷贝,不然无法设置
4     this.tradeAmount.series[0].data = [
5       { value: obj.payment, name: '支出' },
6       { value: obj.inconmes, name: '收入' },
7     ]
8   }
③、最后在页面从后台拿到数据tradeAmountsData后,就执行tradeAmountData()方法:
1     if (this.tradeAmountsData) {
2       this.tradeAmountData(this.tradeAmountsData);
3     }
其他折线图,柱状图原理一样,只不过需要多设置一个xAxis(X轴数据),或者柱状图Y轴上需要设置一个或多个series数据。
1       this.lineIncomeNumber.xAxis[0].data = dataBarArr.axisLine;
2       this.lineIncomeNumber.series[0].data = dataBarArr.yxisLine.inconmes;
3       this.lineIncomeNumber.series[1].data = dataBarArr.yxisLine.payment;
附上深拷贝service.ts文件源码:
 1 import { Injectable } from '@angular/core';
 2
 3 let UUID = {};
 4
 5 @Injectable()
 6 export class CommonFuncService {
 7
 8   constructor() { }
 9
10   public static clone(object: any){
11     if(object==null){
12       return object;
13     }else if(object instanceof Array){
14       return CommonFuncService.cloneArray(object);
15     }else if(typeof object == 'object'){
16       return CommonFuncService.cloneObject(object);
17     }else{
18       return object;
19     }
20   }
21
22   private static cloneObject(object){
23     let result = new Object();
24     for(let name in object){
25       result [name] = CommonFuncService.clone(object[name]);
26     }
27     return result;
28   }
29
30   private static cloneArray(object){
31     let result = [];
32     for(let ob of object){
33       result.push(CommonFuncService.clone(ob));
34     }
35     return result;
36   }
37
38   public static makeUUID(){
39     let id = '' + parseInt('' + Math.random() * 100000, 10);
40     while(UUID[id]){
41       id = '' + parseInt('' + Math.random() * 100000, 10);
42     }
43     UUID[id] = 1;
44     return id;
45   }
46
47 }
(本文原创,转载请注明出处!!)

 浙公网安备 33010602011771号