
完整教程:zabbix监控ES集群健康状态并触发钉钉告警
一、获取集群健康状态的api
ES提供了一个可以获取集群健康状态的api,在浏览器访问:http://10.0.0.91:9200/_cluster/health?pretty
# 和Elasticsearch里其他API一样,“cluster-health”会返回一个JSON响应。
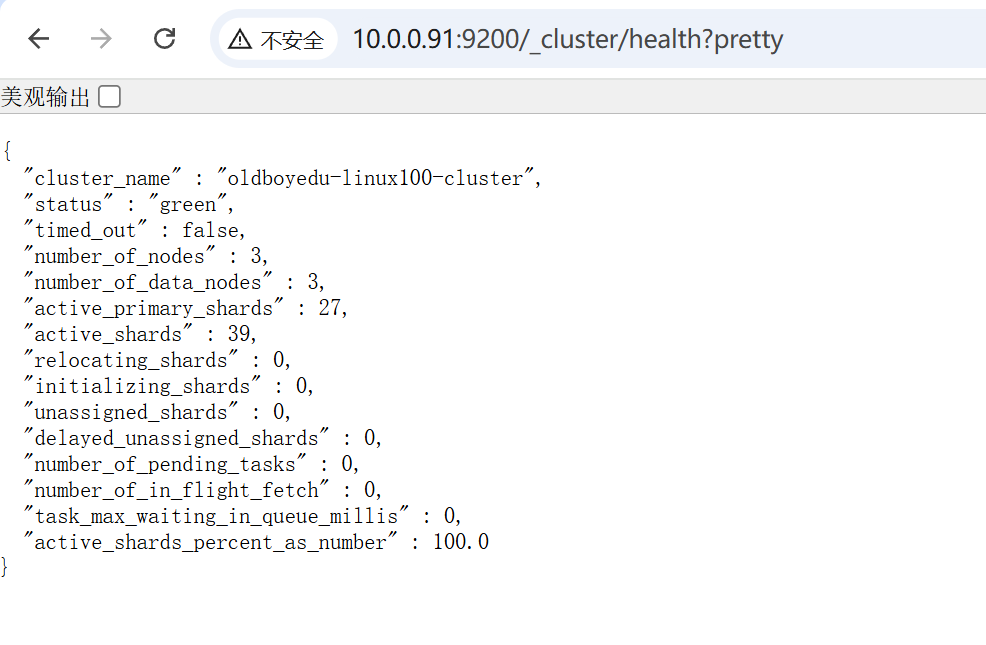
# 响应的内容解释:
"cluster_name" : "my-application", #集群名
"status" : "green", #集群健康状态,正常的话是“green”,缺少副本分片为“yellow”,缺少主分片为“red”
"timed_out" : false,
"number_of_nodes" : 2, #集群节点数
"number_of_data_nodes" : 2, #数据节点数
"active_primary_shards" : 138, #主分片数
"active_shards" : 274, #可用的分片数
"relocating_shards" : 0, #正在迁移的分片数
"initializing_shards" : 0, #正在初始化的分片数
"unassigned_shards" : 0, #未分配的分片,但在集群中存在
"delayed_unassigned_shards" : 0, #延时待分配到具体节点上的分片数
"number_of_pending_tasks" : 0, #待处理的任务数,指主节点创建索引并分配shards等任务
"number_of_in_flight_fetch" : 0,
"task_max_waiting_in_queue_millis" : 0,
"active_shards_percent_as_number" : 100.0 #可用分片数占总分片的比例
二、编写采集脚本获取集群状态
[root@elk91 ~]# cat /etc/zabbix/scripts/monitor_es.sh
#!/bin/bash
case $1 in
cluster_name)
curl -s -XGET 'http://10.0.0.91:9200/_cluster/health?pretty' |awk -F\" '/cluster_name/ {print $4}' ;;
status)
curl -s -XGET 'http://10.0.0.91:9200/_cluster/health?pretty' |awk -F\" 'NR==3 {print $4}' ;;
timed_out)
curl -s -XGET 'http://10.0.0.91:9200/_cluster/health?pretty' |awk -F\, 'NR==4 {print $1}' |awk -F: '{print $2}' ;;
number_nodes)
curl -s -XGET 'http://10.0.0.91:9200/_cluster/health?pretty' |awk -F\, 'NR==5 {print $1}' |awk -F: '{print $2}' ;;
data_nodes)
curl -s -XGET 'http://10.0.0.91:9200/_cluster/health?pretty' |awk -F\, 'NR==6 {print $1}' |awk -F: '{print $2}' ;;
active_primary_shards)
curl -s -XGET 'http://10.0.0.91:9200/_cluster/health?pretty' |awk -F\, 'NR==7 {print $1}' |awk -F: '{print $2}' ;;
active_shards)
curl -s -XGET 'http://10.0.0.91:9200/_cluster/health?pretty' |awk -F\, 'NR==8 {print $1}' |awk -F: '{print $2}' ;;
relocating_shards)
curl -s -XGET 'http://10.0.0.91:9200/_cluster/health?pretty' |awk -F\, 'NR==9 {print $1}' |awk -F: '{print $2}' ;;
initializing_shards)
curl -s -XGET 'http://10.0.0.91:9200/_cluster/health?pretty' |awk -F\, 'NR==10 {print $1}' |awk -F: '{print $2}' ;;
unassigned_shards)
curl -s -XGET 'http://10.0.0.91:9200/_cluster/health?pretty' |awk -F\, 'NR==11 {print $1}' |awk -F: '{print $2}' ;;
delayed_unassigned_shards)
curl -s -XGET 'http://10.0.0.91:9200/_cluster/health?pretty' |awk -F\, 'NR==12 {print $1}' |awk -F: '{print $2}' ;;
number_of_pending_tasks)
curl -s -XGET 'http://10.0.0.91:9200/_cluster/health?pretty' |awk -F\, 'NR==13 {print $1}' |awk -F: '{print $2}' ;;
active_shards_percent_as_number)
curl -s -XGET 'http://10.0.0.91:9200/_cluster/health?pretty' |awk -F\, 'NR==16 {print $1}' |awk -F: '{print $2}' ;;
*)echo "Usage: $0 { cluster_name | status | timed_out | number_nodes | data_nodes | active_primary_shards | active_shards | relocating_shards |
ed_shards|delayed_unassigned_shards|number_of_pending_tasks|active_shards_percent_as_number}" ;;
esac
# 在shell脚本里,“curl -s -XGET 'http://10.253.40.87:9200/_cluster/health?pretty' |awk -F\, 'NR==16 {print $1}' |awk -F: '{print $2}'”这样的命令,“NR==16”是指在浏览器访问http://10.253.40.87:9200/_cluster/health?pretty,获取页面的第16行(从第1行的“{”开始计数)。=
给脚本授予执行权限:
chmod +x monitor_es.sh
属主、属组可能也需要授权:
chown zabbix:zabbix monitor_es.sh
三、增加zabbix-agent配置文件
[root@elk91 zabbix_agentd.conf.d]# cat /etc/zabbix/zabbix_agentd.conf.d/monitor_es.conf
UserParameter=es_cluster_name,/etc/zabbix/scripts/monitor_es.sh cluster_name
UserParameter=es_status,/etc/zabbix/scripts/monitor_es.sh status
#UserParameter=timed_out,/etc/zabbix/scripts/monitor_es.sh timed_out
UserParameter=es_number_nodes,/etc/zabbix/scripts/monitor_es.sh number_nodes
UserParameter=es_data_nodes,/etc/zabbix/scripts/monitor_es.sh data_nodes
UserParameter=es_active_primary_shards,/etc/zabbix/scripts/monitor_es.sh active_primary_shards
UserParameter=es_active_shards,/etc/zabbix/scripts/monitor_es.sh active_shards
UserParameter=es_relocating_shards,/etc/zabbix/scripts/monitor_es.sh relocating_shards
UserParameter=es_initializing_shards,/etc/zabbix/scripts/monitor_es.sh initializing_shards
UserParameter=es_unassigned_shards,/etc/zabbix/scripts/monitor_es.sh unassigned_shards
UserParameter=es_delayed_unassigned_shards,/etc/zabbix/scripts/monitor_es.sh delayed_unassigned_shards
UserParameter=es_number_of_pending_tasks,/etc/zabbix/scripts/monitor_es.sh number_of_pending_tasks
UserParameter=es_active_shards_percent_as_number,/etc/zabbix/scripts/monitor_es.sh active_shards_percent_as_number
四、重启zabbix-agent服务
[root@elk91 ~]# systemctl restart zabbix-agent.service
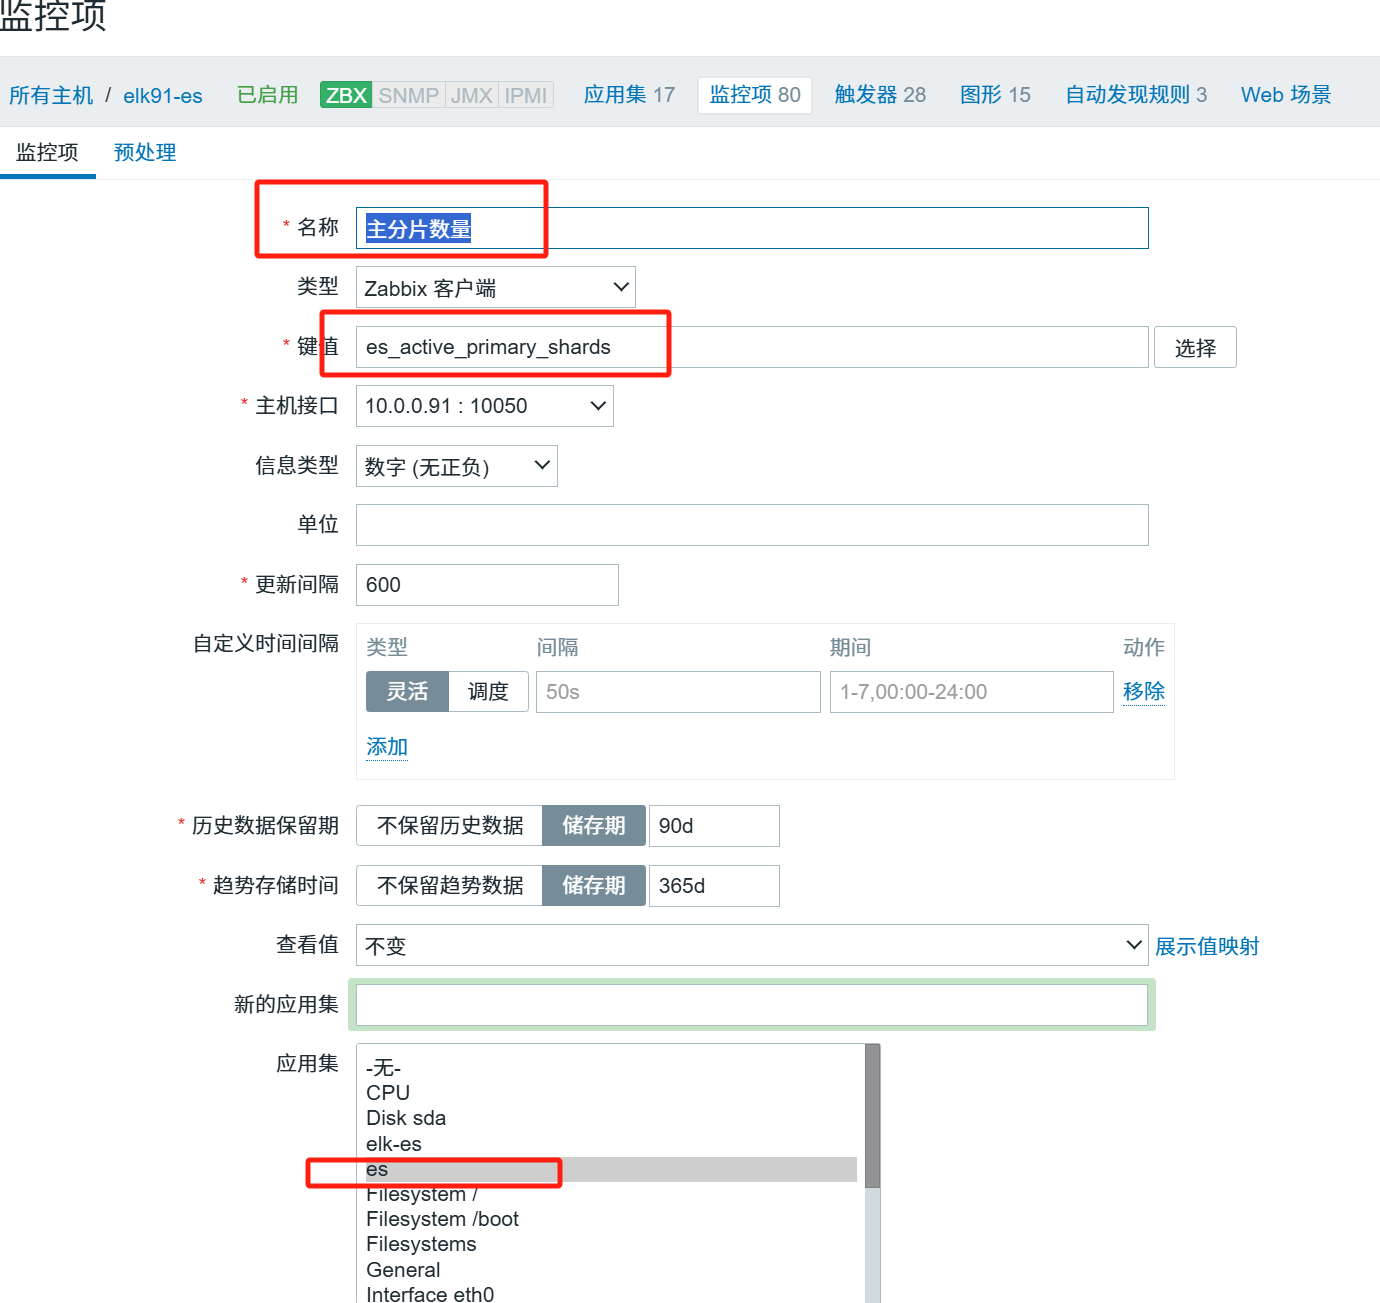
五、web页面调整
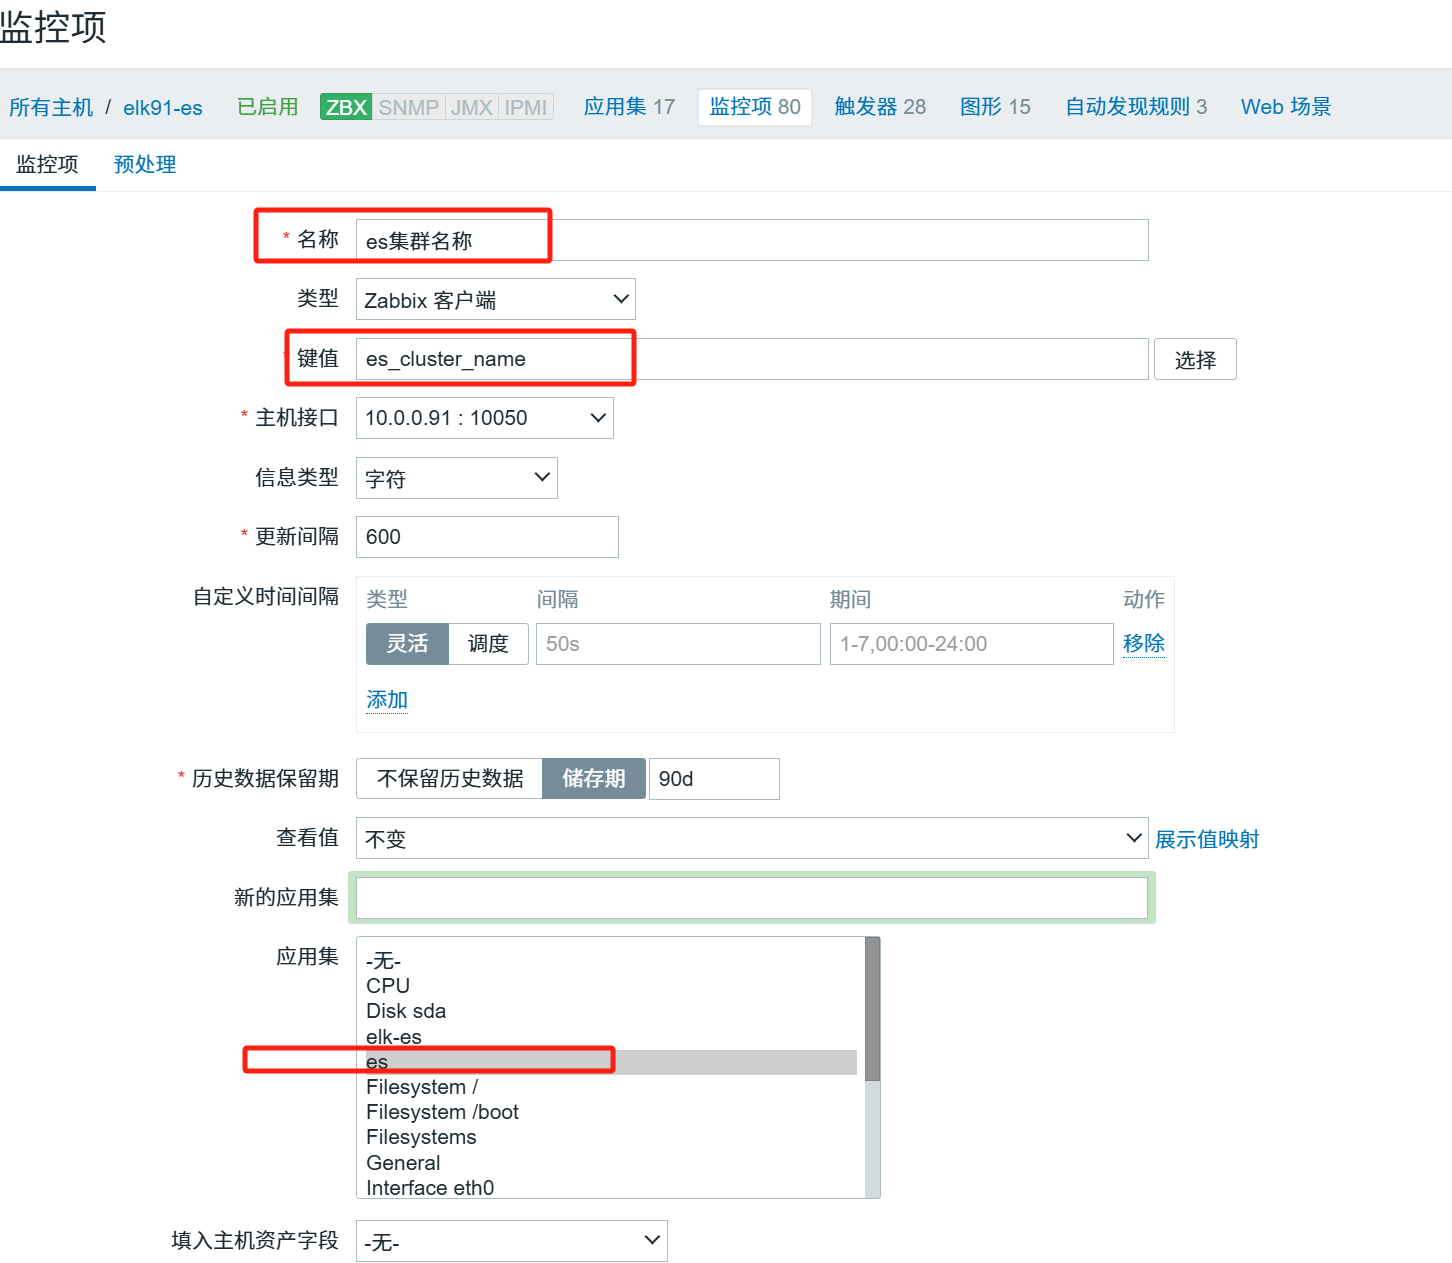
由于收集的信息只有“green”、“yellow”和“red”,所以,这里的信息类型为字符型。
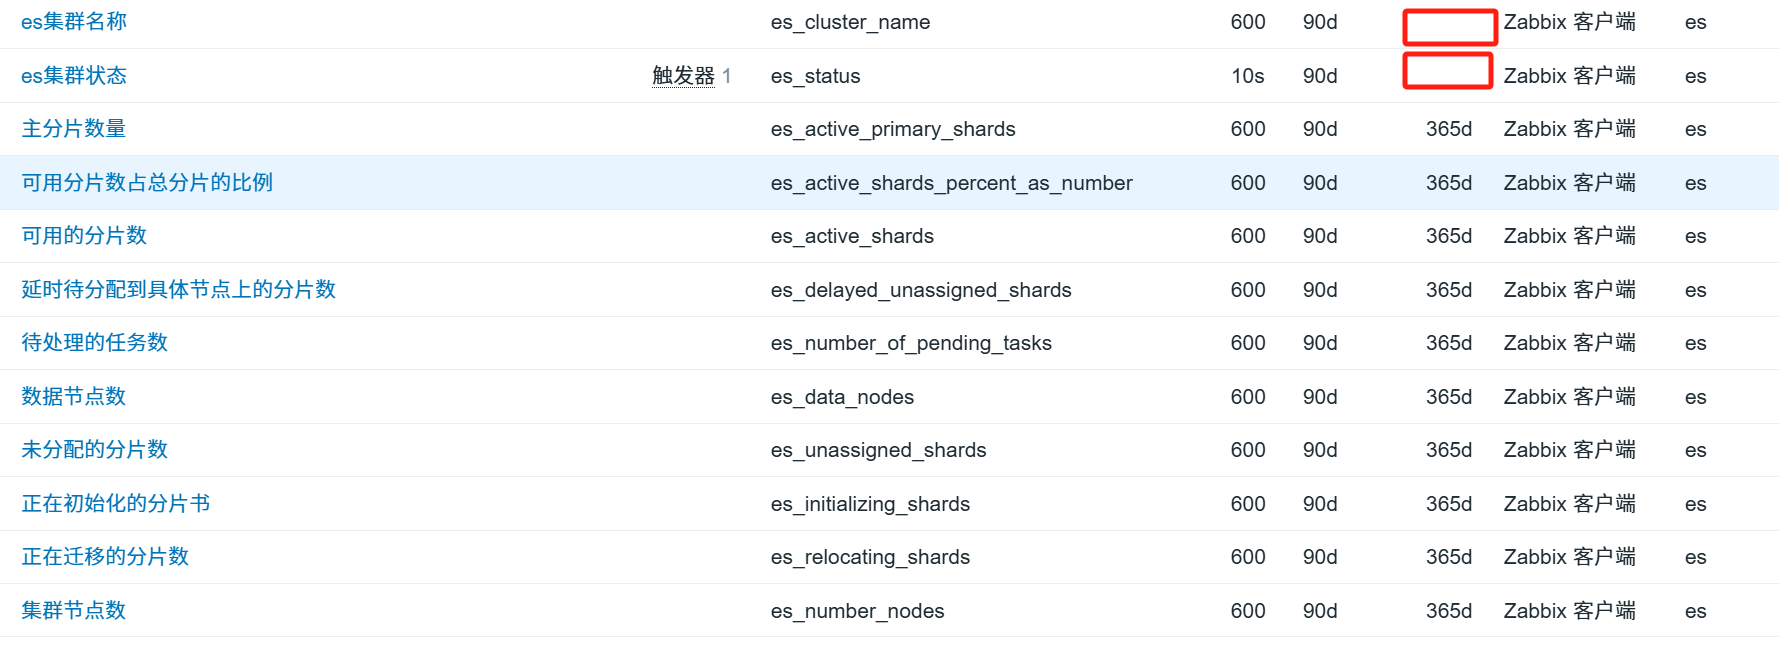
数值型的。例如:就是只有“es集群名称”和“es集群状态”2个监控项的“Type of information”(字段类型)是字符型的,其他监控项必须
空的(下图所示)。就是由于“es集群名称”和“es集群状态”的字段类型是字符型的,所以“Trends”列这个监控项
#这一点很重要。
#如果所有监控项都是字符型,那么,在后面添加“图形”时,监控项是找不到的。
5.1、触发器的创建:
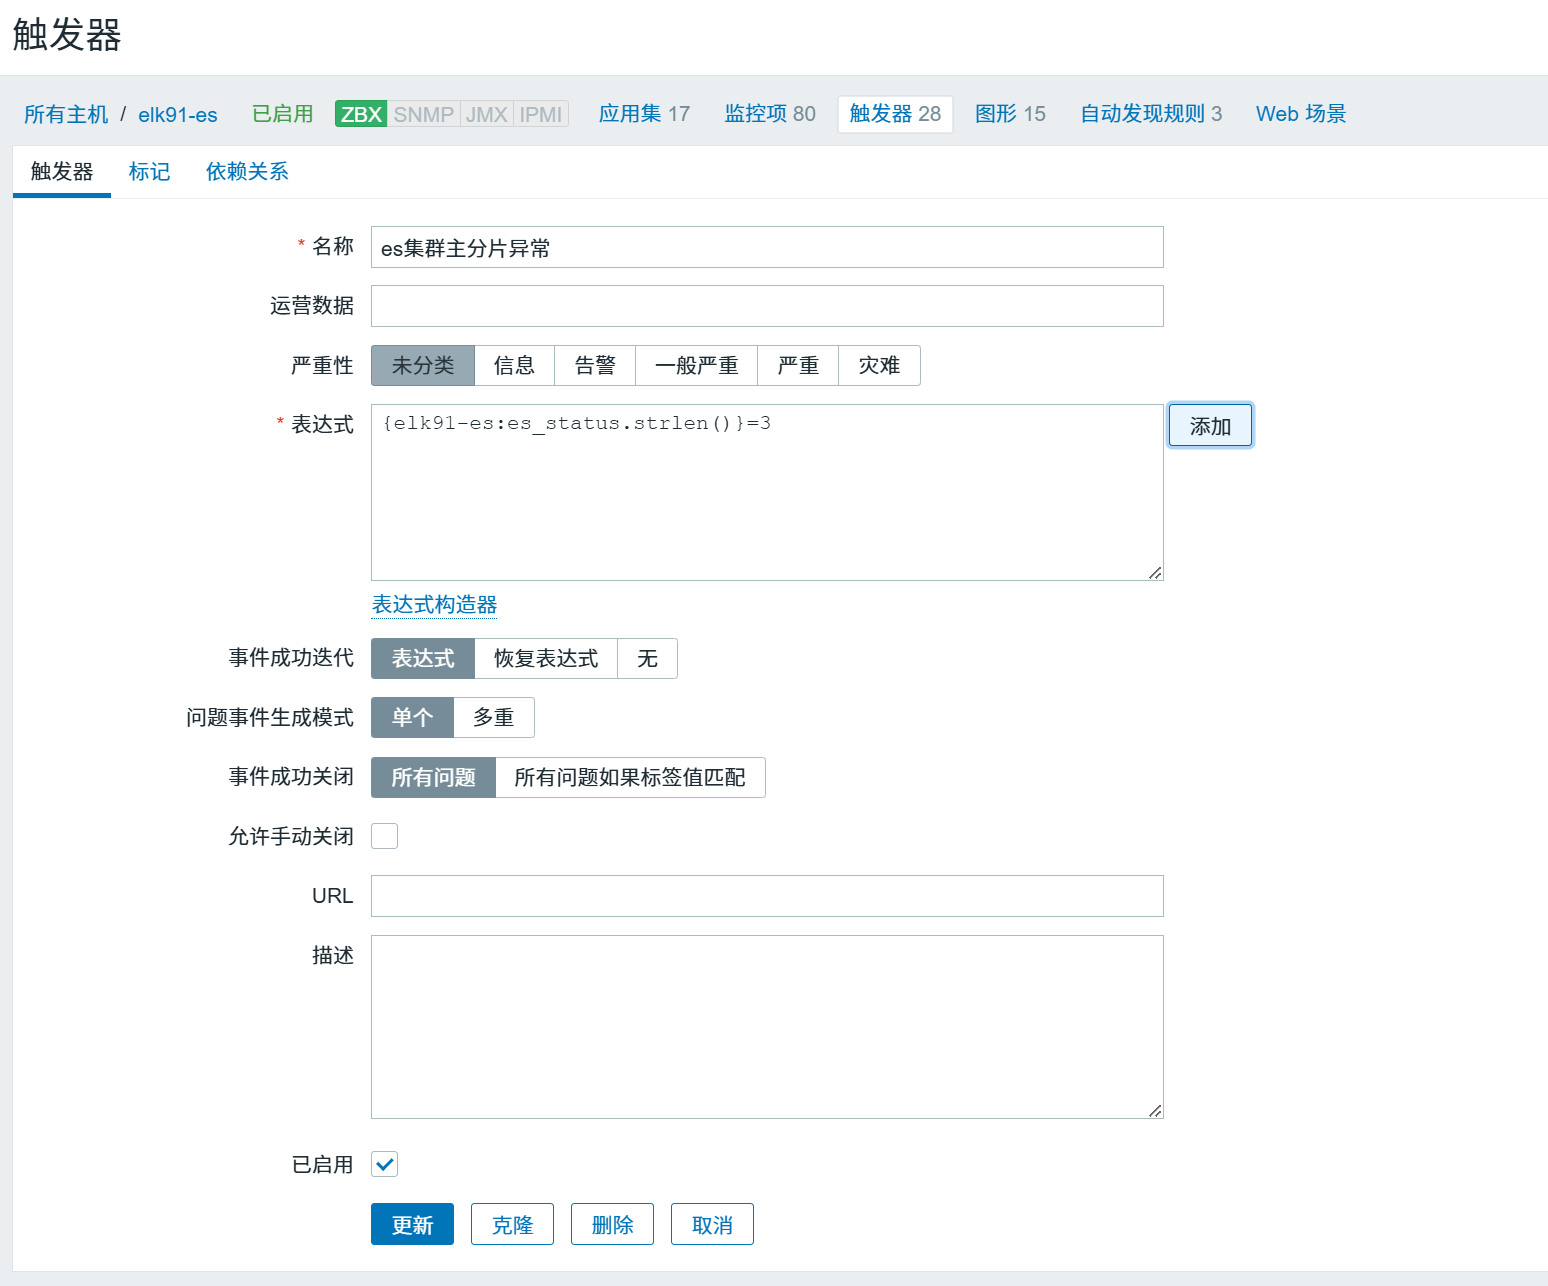
5.2、点击“Add”按纽,需要填写的信息:
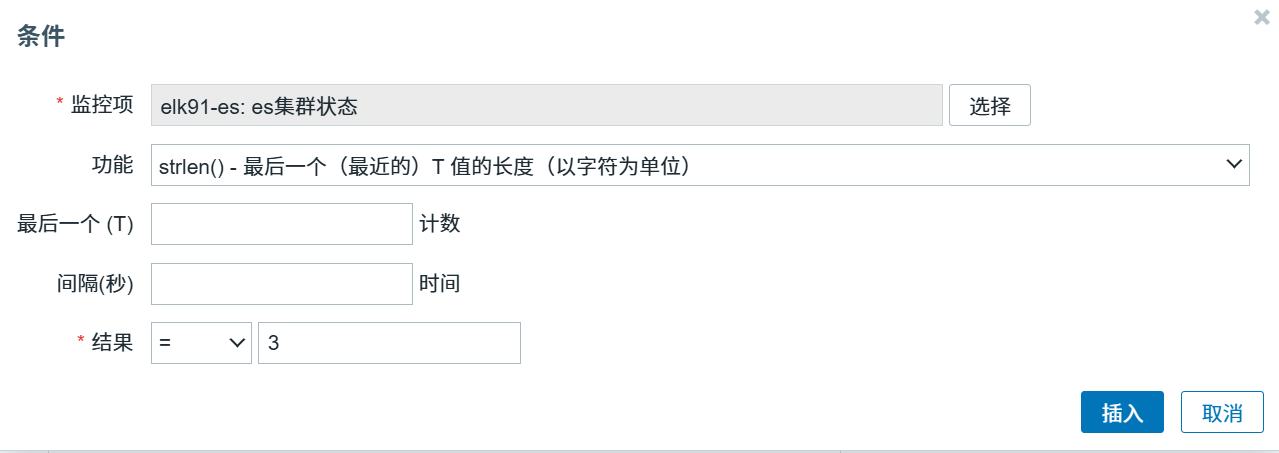
重点。就是# 注意:“Function(功能)”和“N(结果)”
# 这个触发器表达式的意思是,当字符串长度为3,也就是状态值为“red”,触发报警。
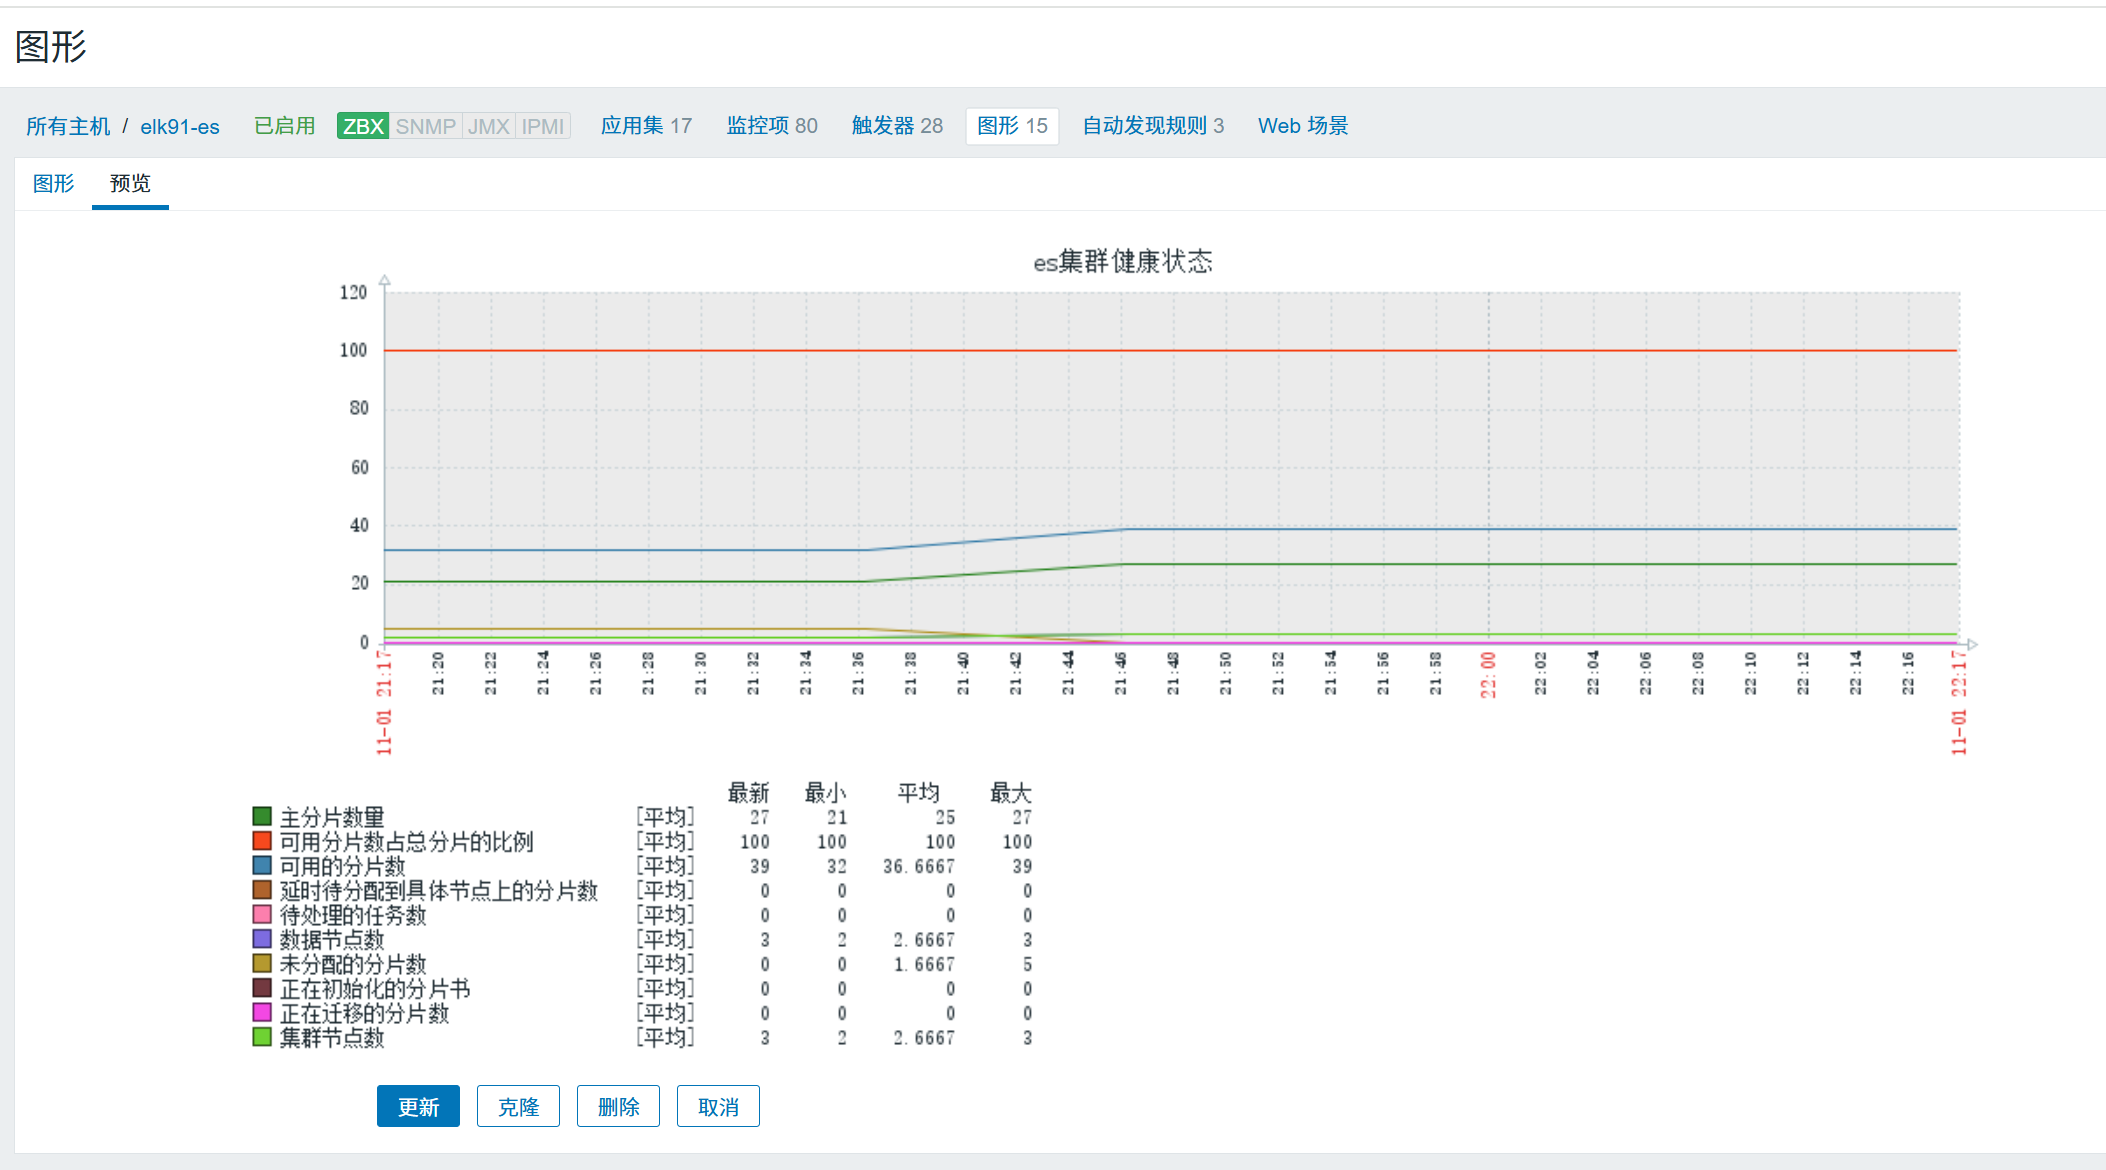
5.3、图形创建:
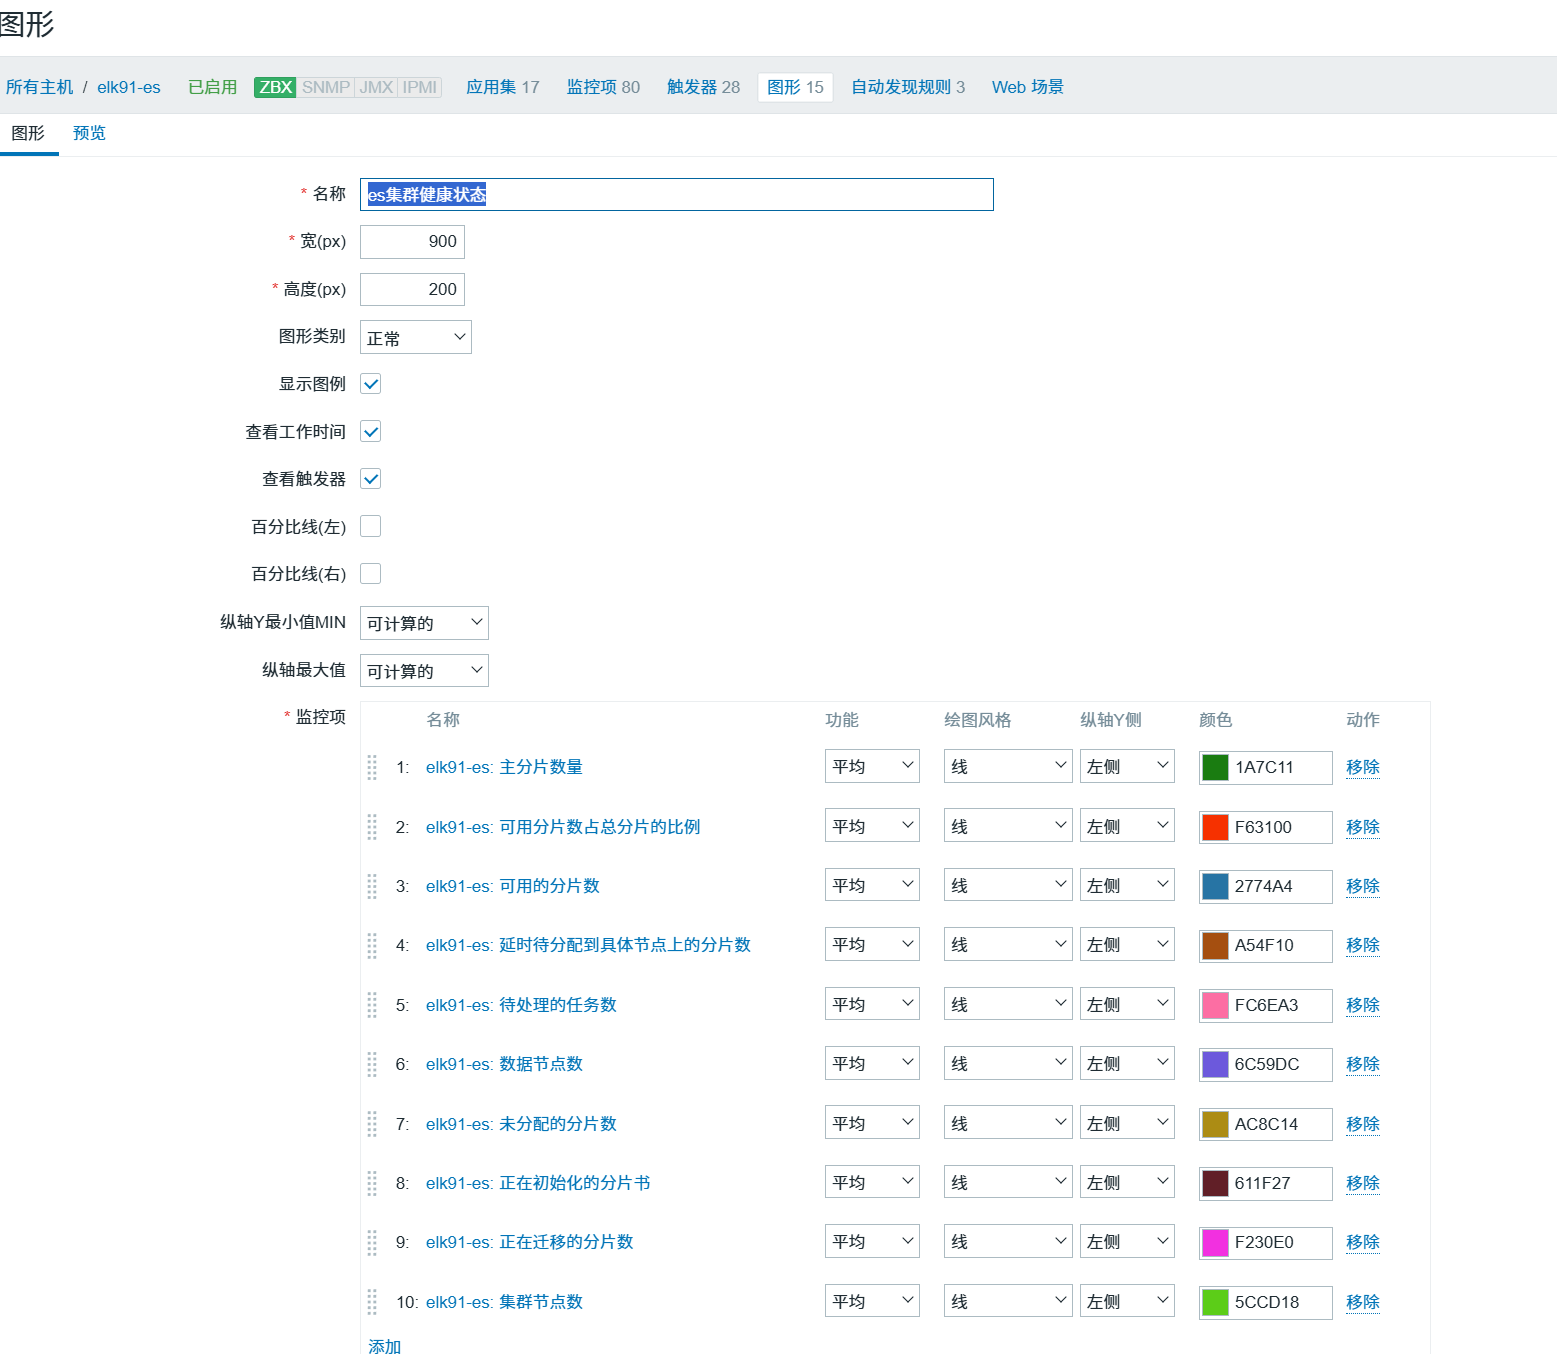
# 点击下面的“Add”按纽,在弹出的对话框里能看到这次创建的监控项,就是因为这些监控项的字段类型是数值型。当前,字符型的2个监控项这里就不存在。
5.4、当前zabbix收集数据没有难题:
六、配置钉钉告警
1、下载钉钉
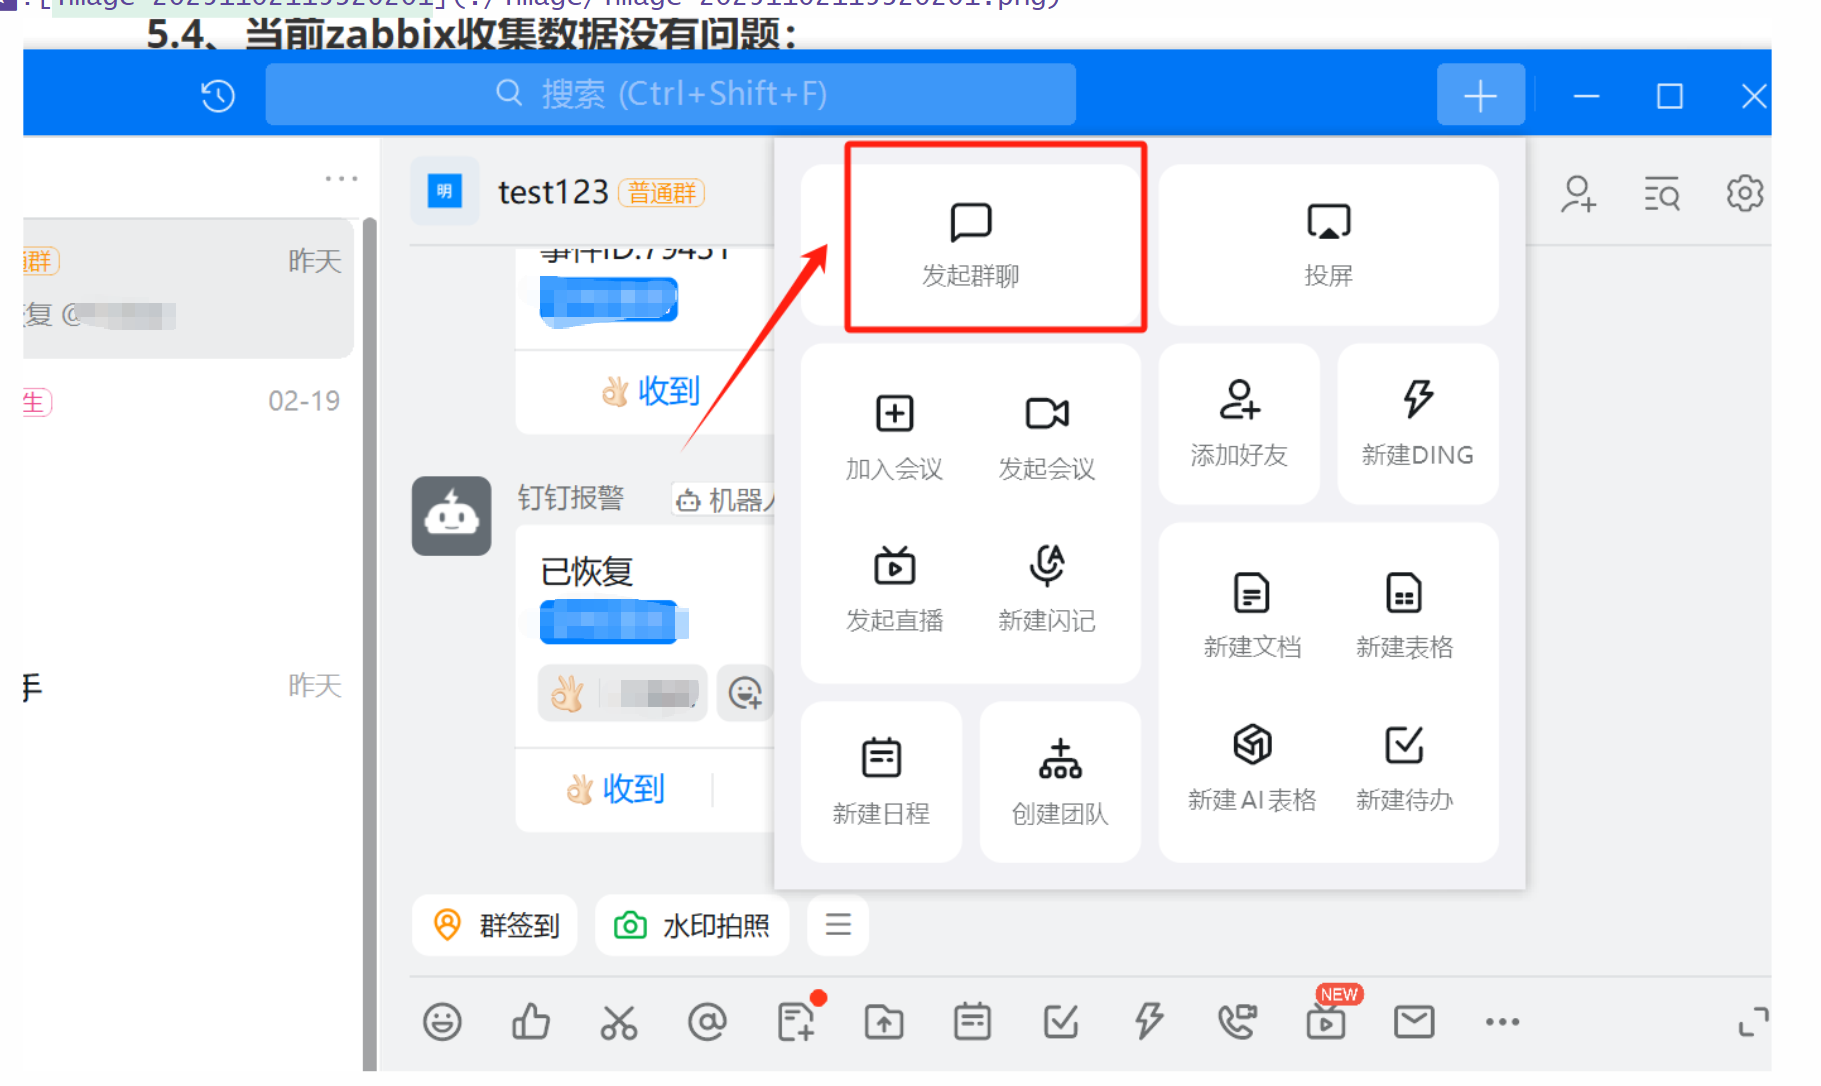
2、创建群聊(如图)
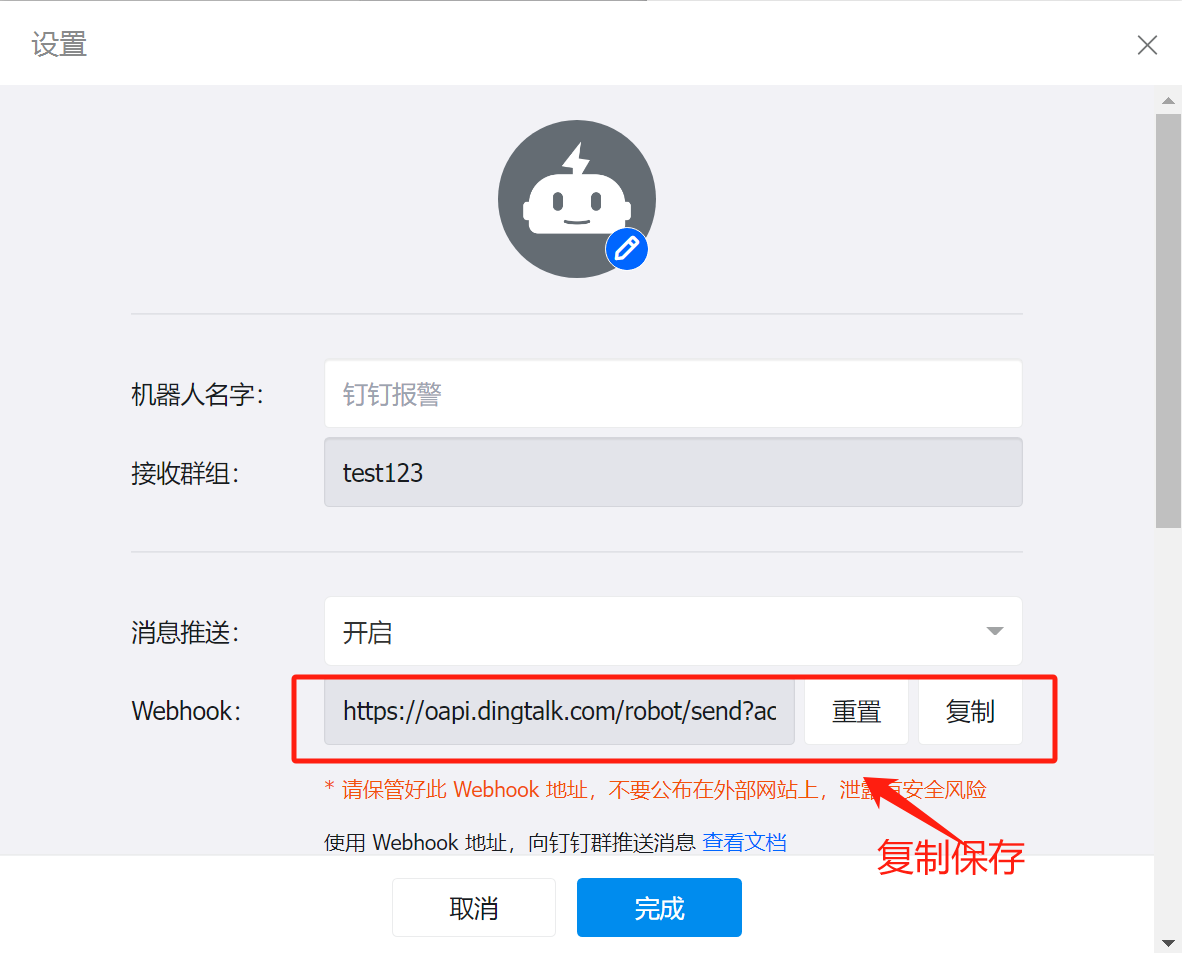
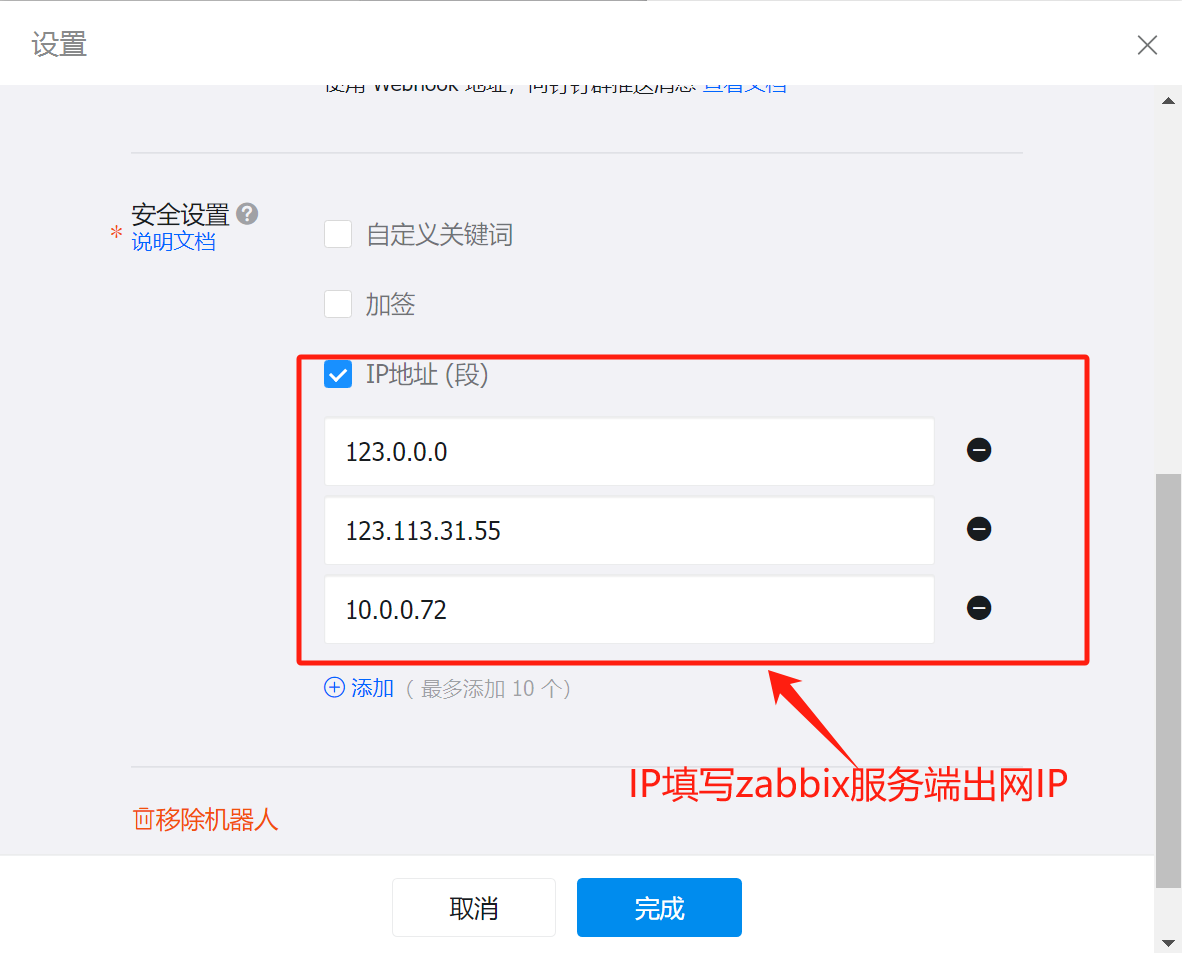
3、添加自定义机器人

4、编写钉钉告警的python脚本
[root@zabbix ~]# cat /usr/local/share/zabbix/alertscripts/DingDing.py
#!/usr/bin/env python
#-*- coding: utf-8 -*-
import requests,json,sys,os,datetime
webhook="https://oapi.dingtalk.com/robot/send?access_token=8071abd4459d3603635521e228204c499925de078ec358e6f4990e97635c5c36"#说明:这里改为自己创建的机器人的webhook的值
user=sys.argv[1]
#发给钉钉群中哪个用户
text=sys.argv[3]data={
"msgtype": "text",
"text": {
"content": text
},
"at": {
"atMobiles": [
user
],
"isAtAll": False
}
}
#钉钉API固定数据格式
headers = {'Content-Type': 'application/json'}
x=requests.post(url=webhook,data=json.dumps(data),headers=headers)
if os.path.exists("/usr/lib/zabbix/alertscripts/dingding.log"):
f=open("/usr/lib/zabbix/alertscripts/dingding.log","a+")
else:
f=open("/usr/lib/zabbix/alertscripts/dingding.log","w+")
f.write("\n"+"--"*30)
if x.json()["errcode"] == 0:
f.write("\n"+str(datetime.datetime.now())+" "+str(user)+" "+"发送成功"+"\n"+str(text))
f.close()
else:
f.write("\n"+str(datetime.datetime.now()) + " " + str(user) + " " + "发送失败" + "\n" + str(text))
f.close()# 上面脚本里面的webhook修改为刚才在钉钉复制的webhook值
# 因为脚本里编写的有日志文件,所以要创建日志文件,并且给予属主属组zabbix。否则安装zabbix页面时会报错 (如下)
[root@zabbix alertscripts]# pwd
/usr/lib/zabbix/alertscripts
[root@zabbix alertscripts]# ll
total 4
-rw-r--r-- 1 root root 3702 Nov 1 21:45 dingding.log
[root@zabbix alertscripts]# chown zabbix.zabbix dingding.log
5、给予 +x 权限
[root@zabbix alertscripts]# chmod +x DingDing.py
[root@zabbix alertscripts]# ll DingDing.py
-rwxr-xr-x 1 root root 1152 Nov 1 20:45 DingDing.py
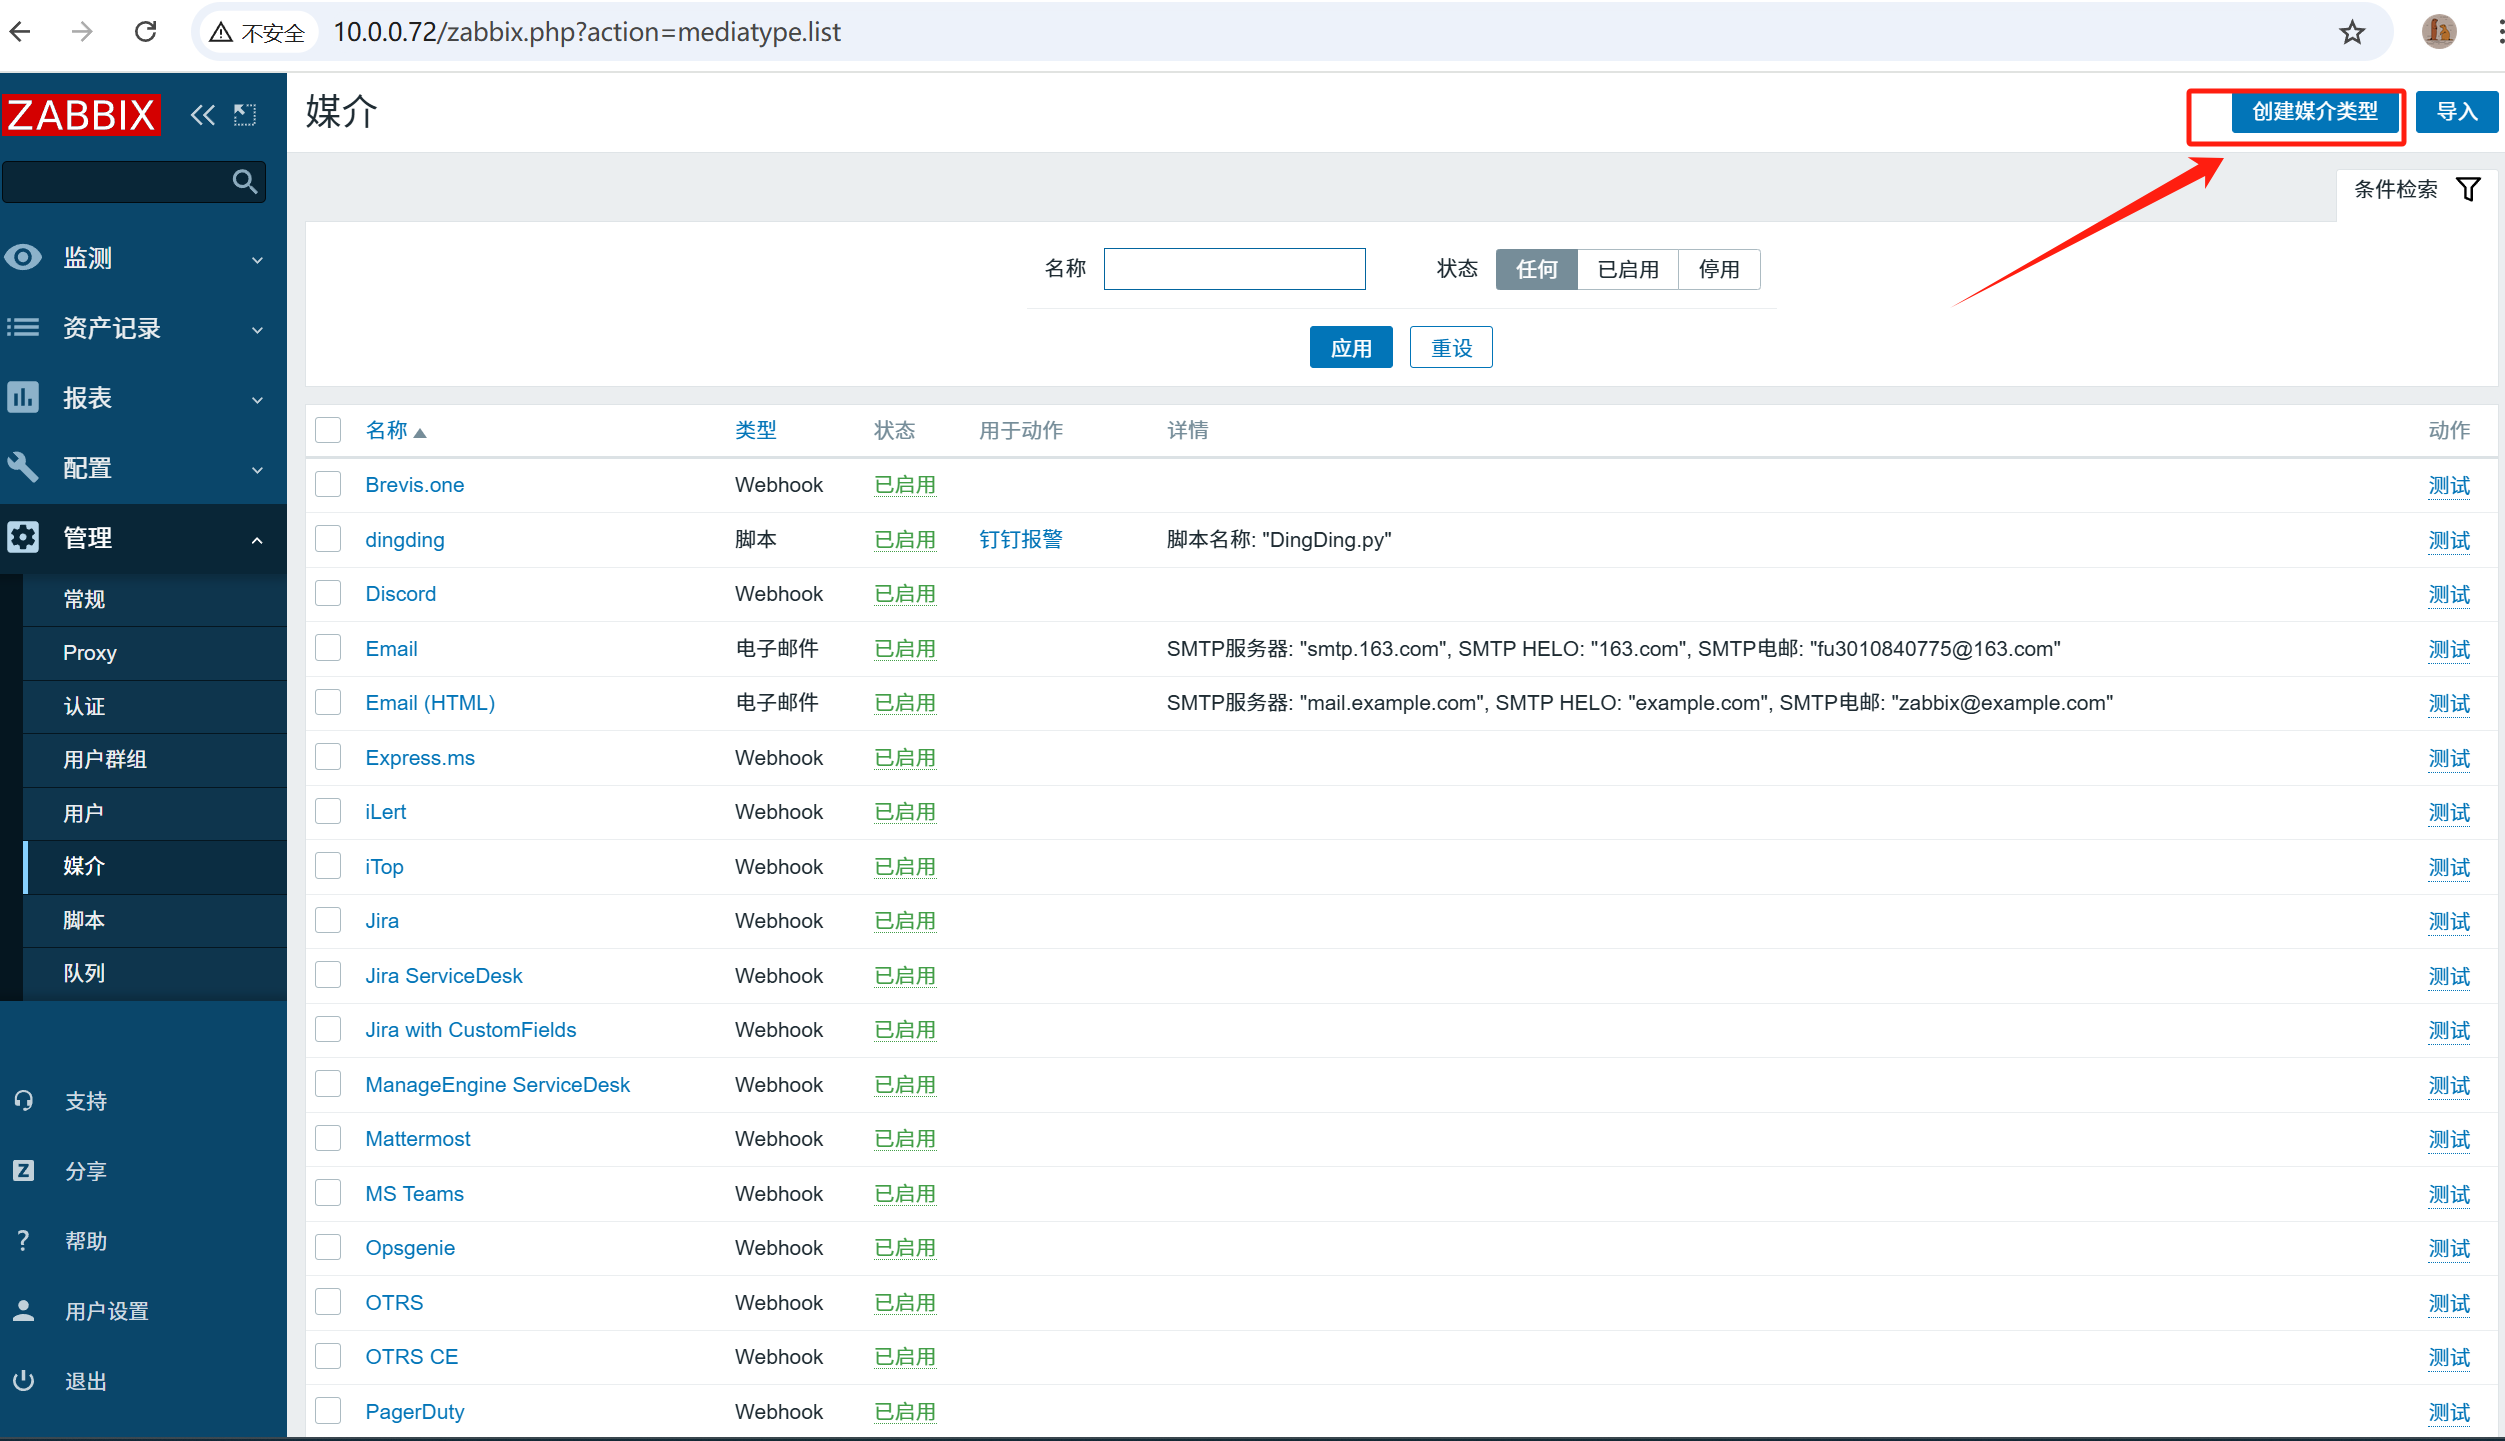
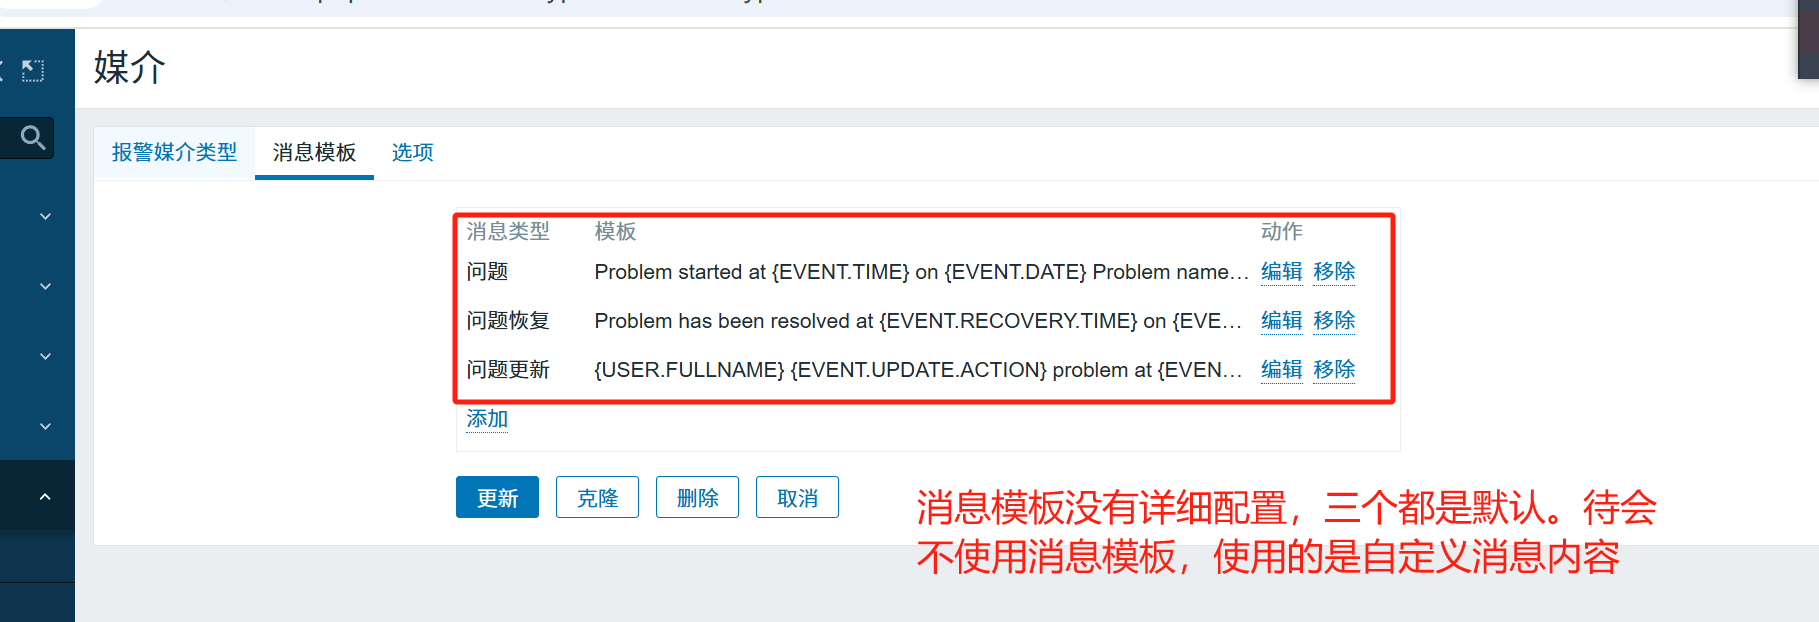
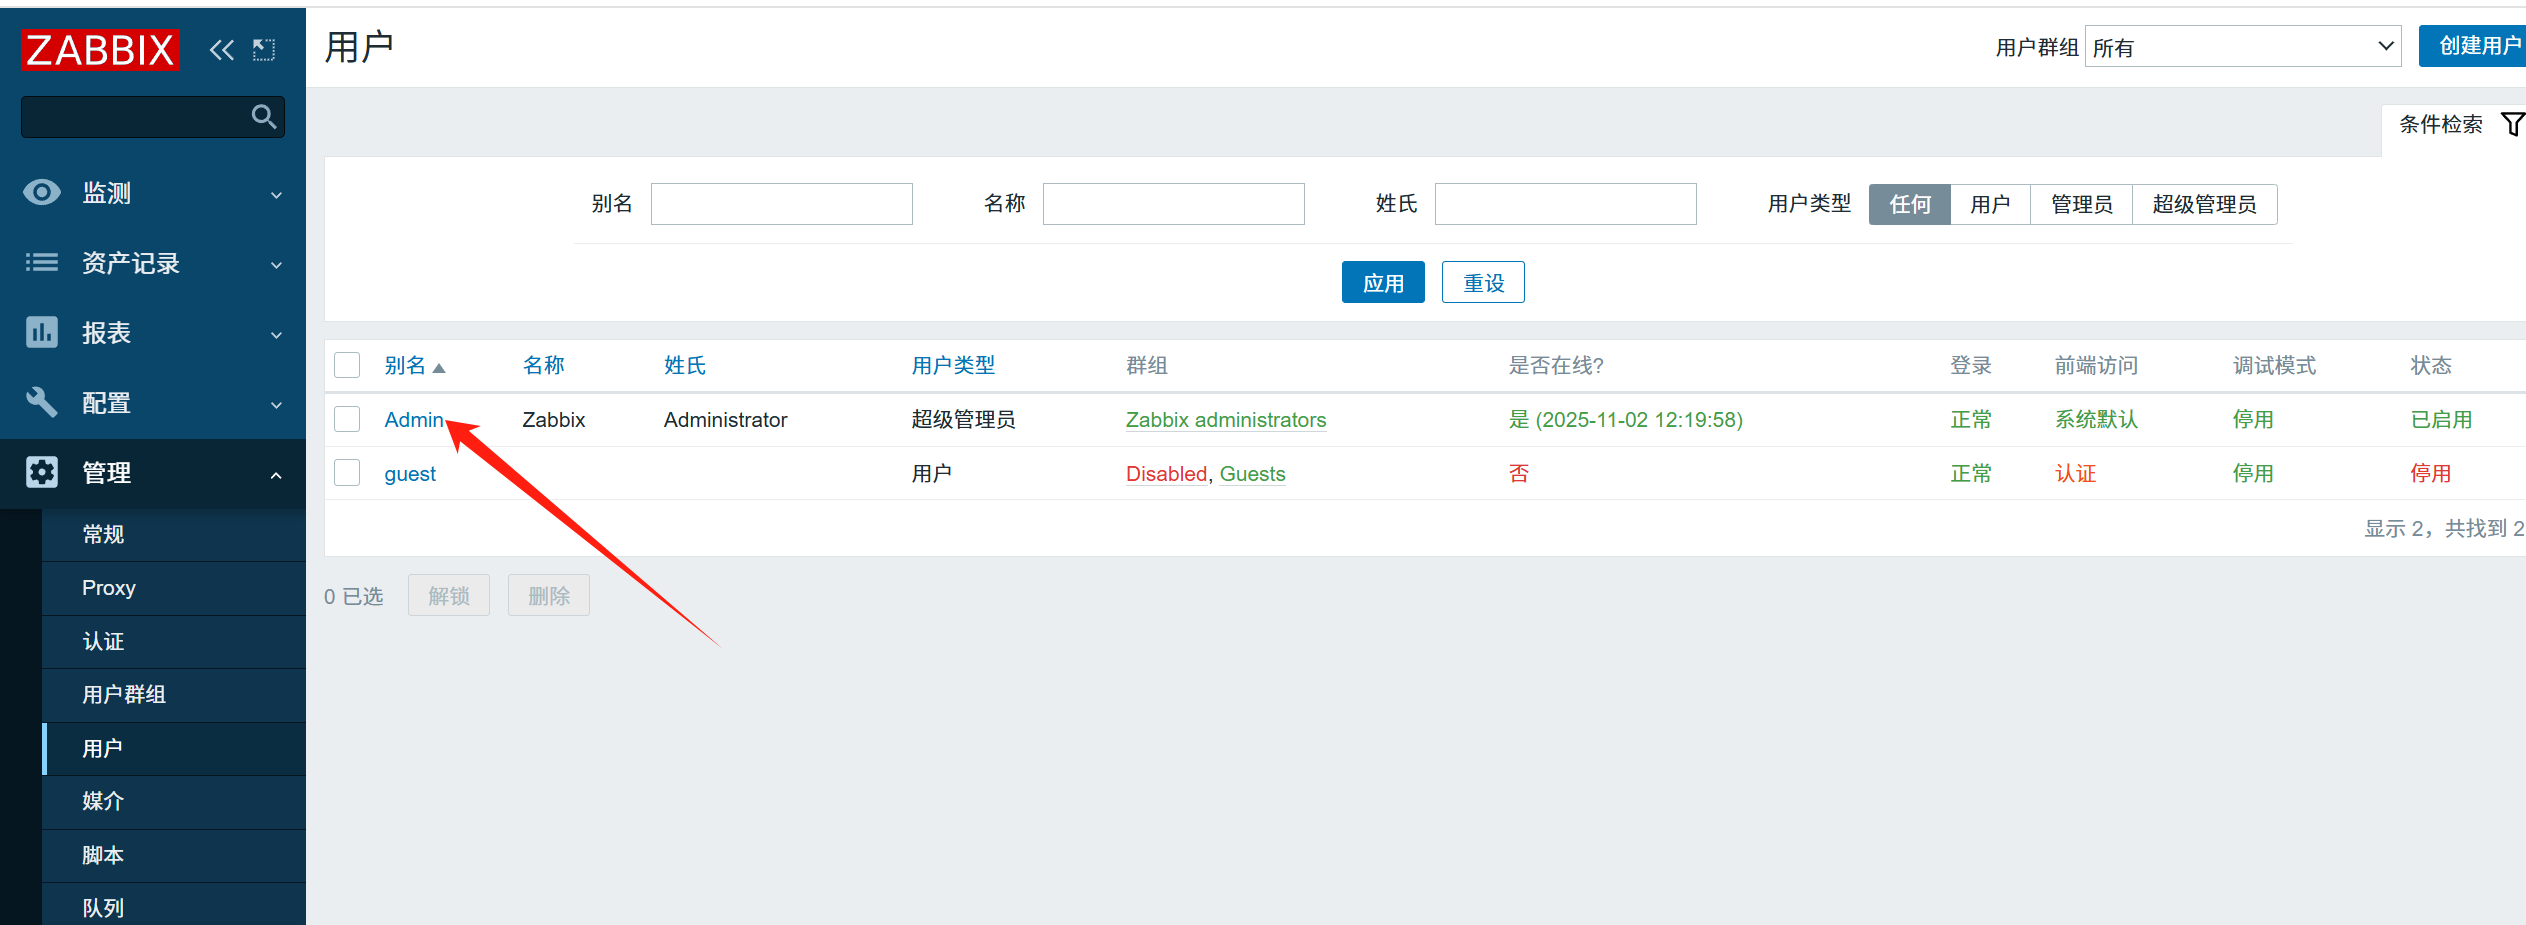
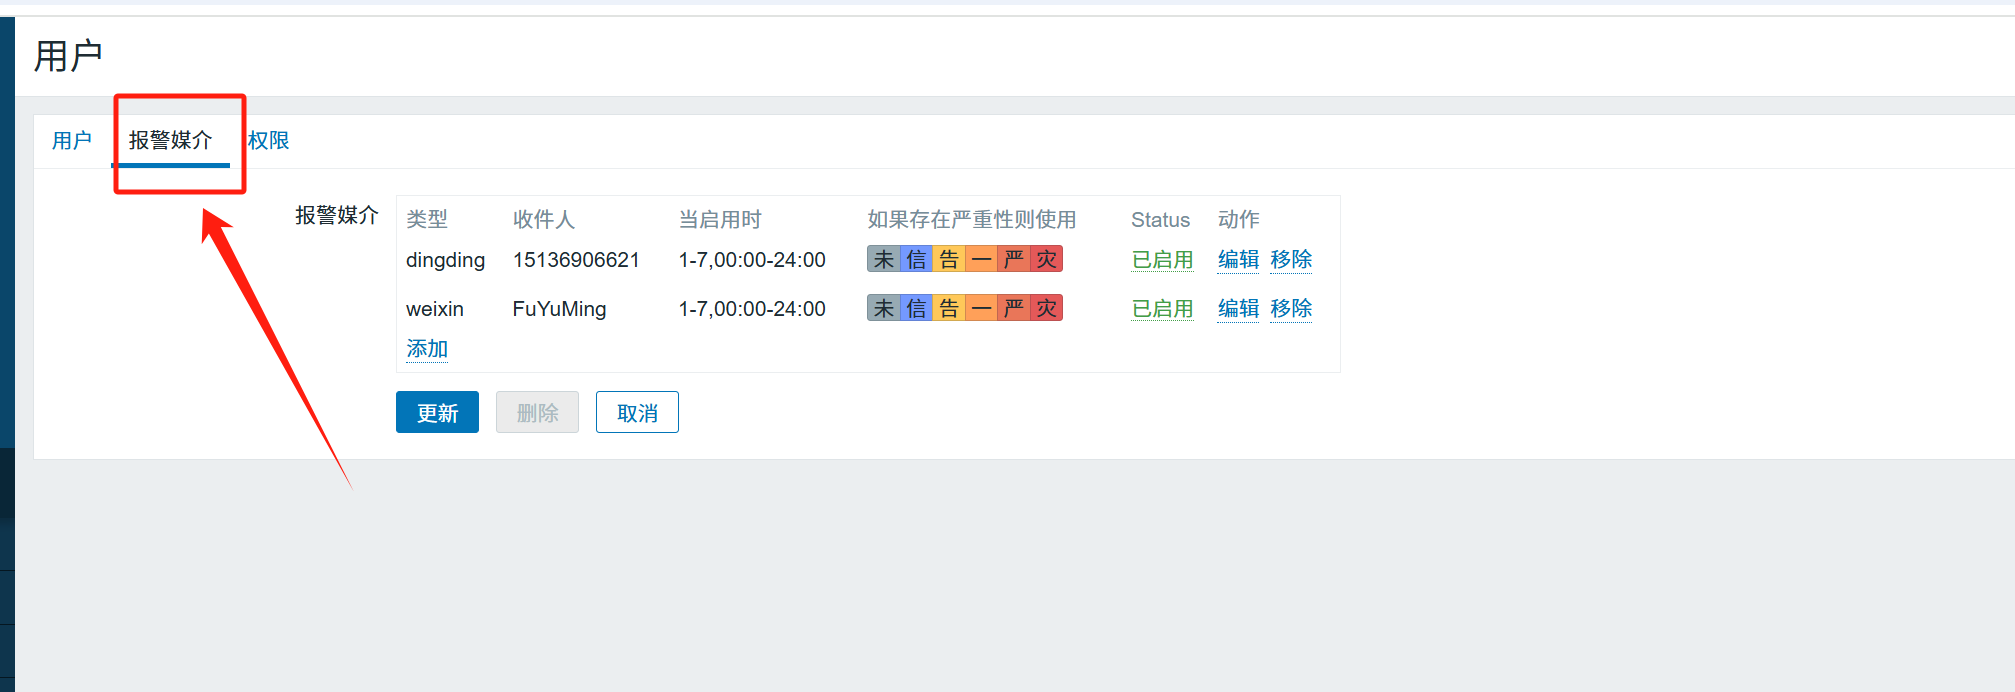
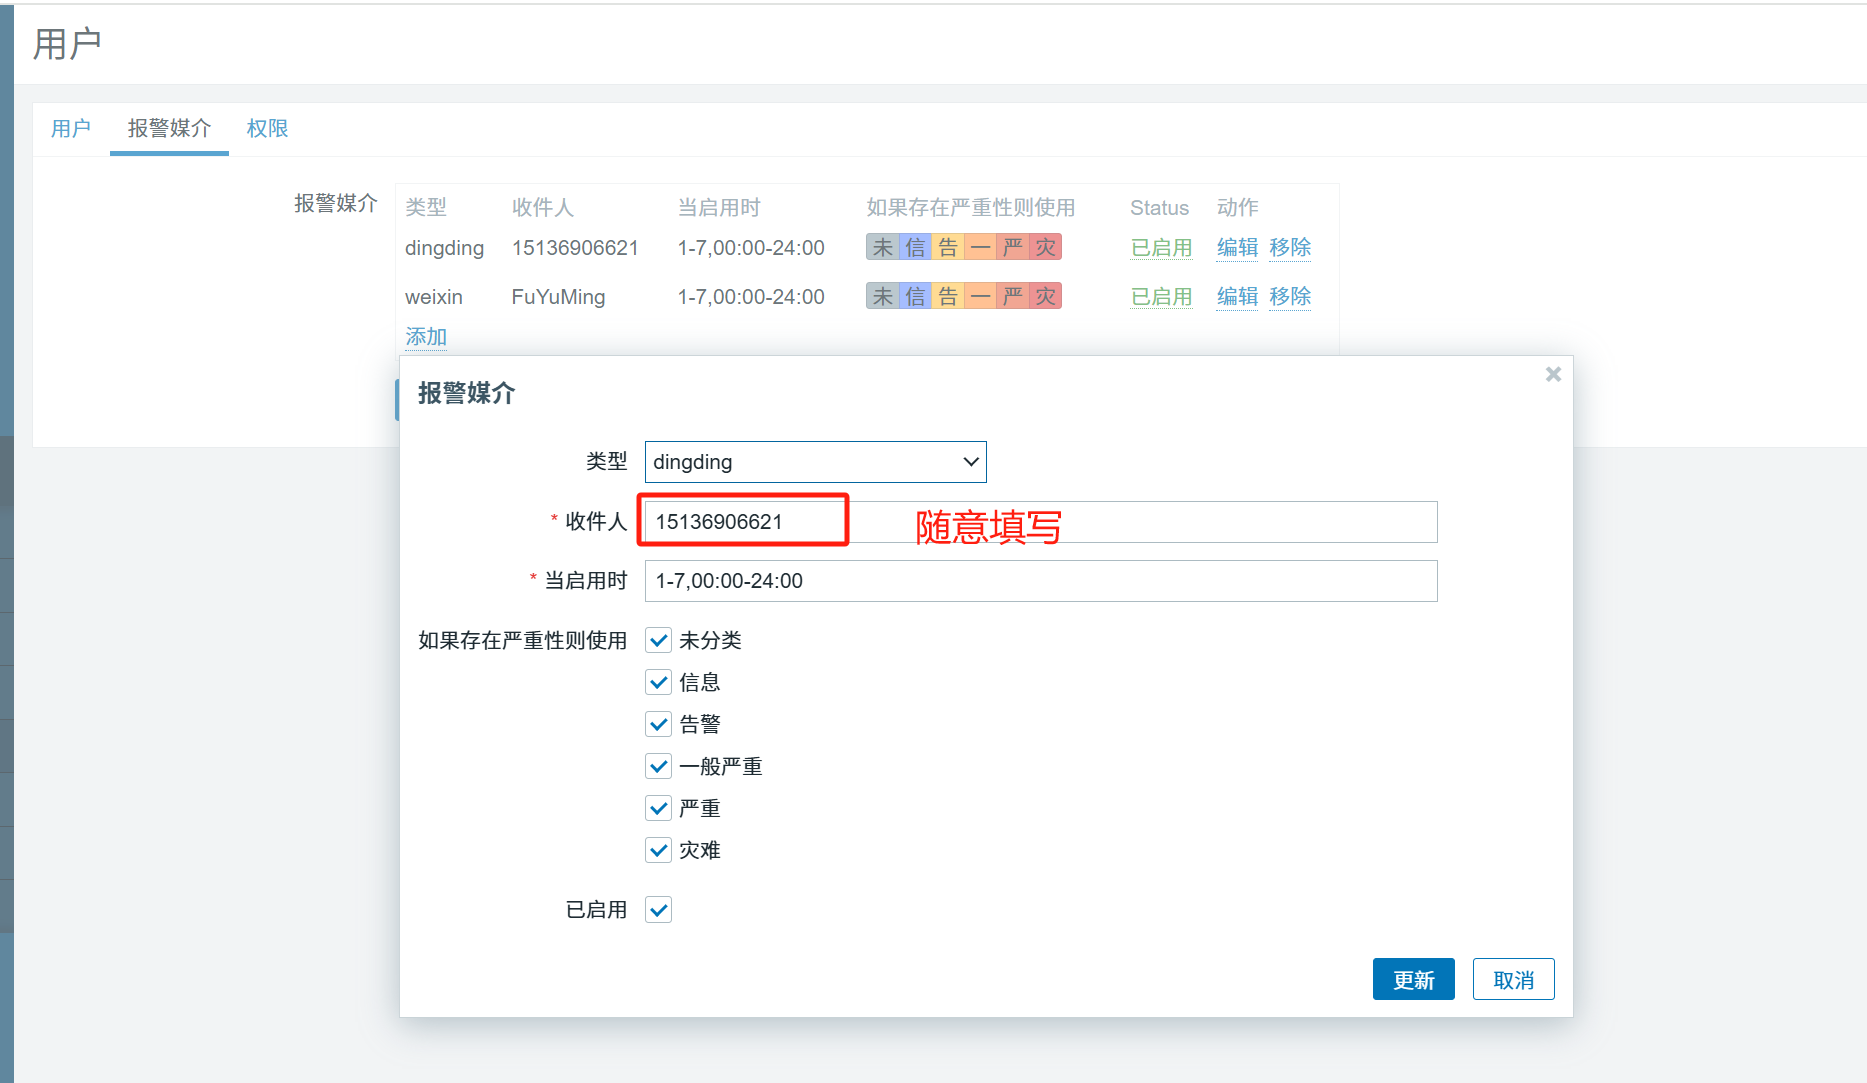
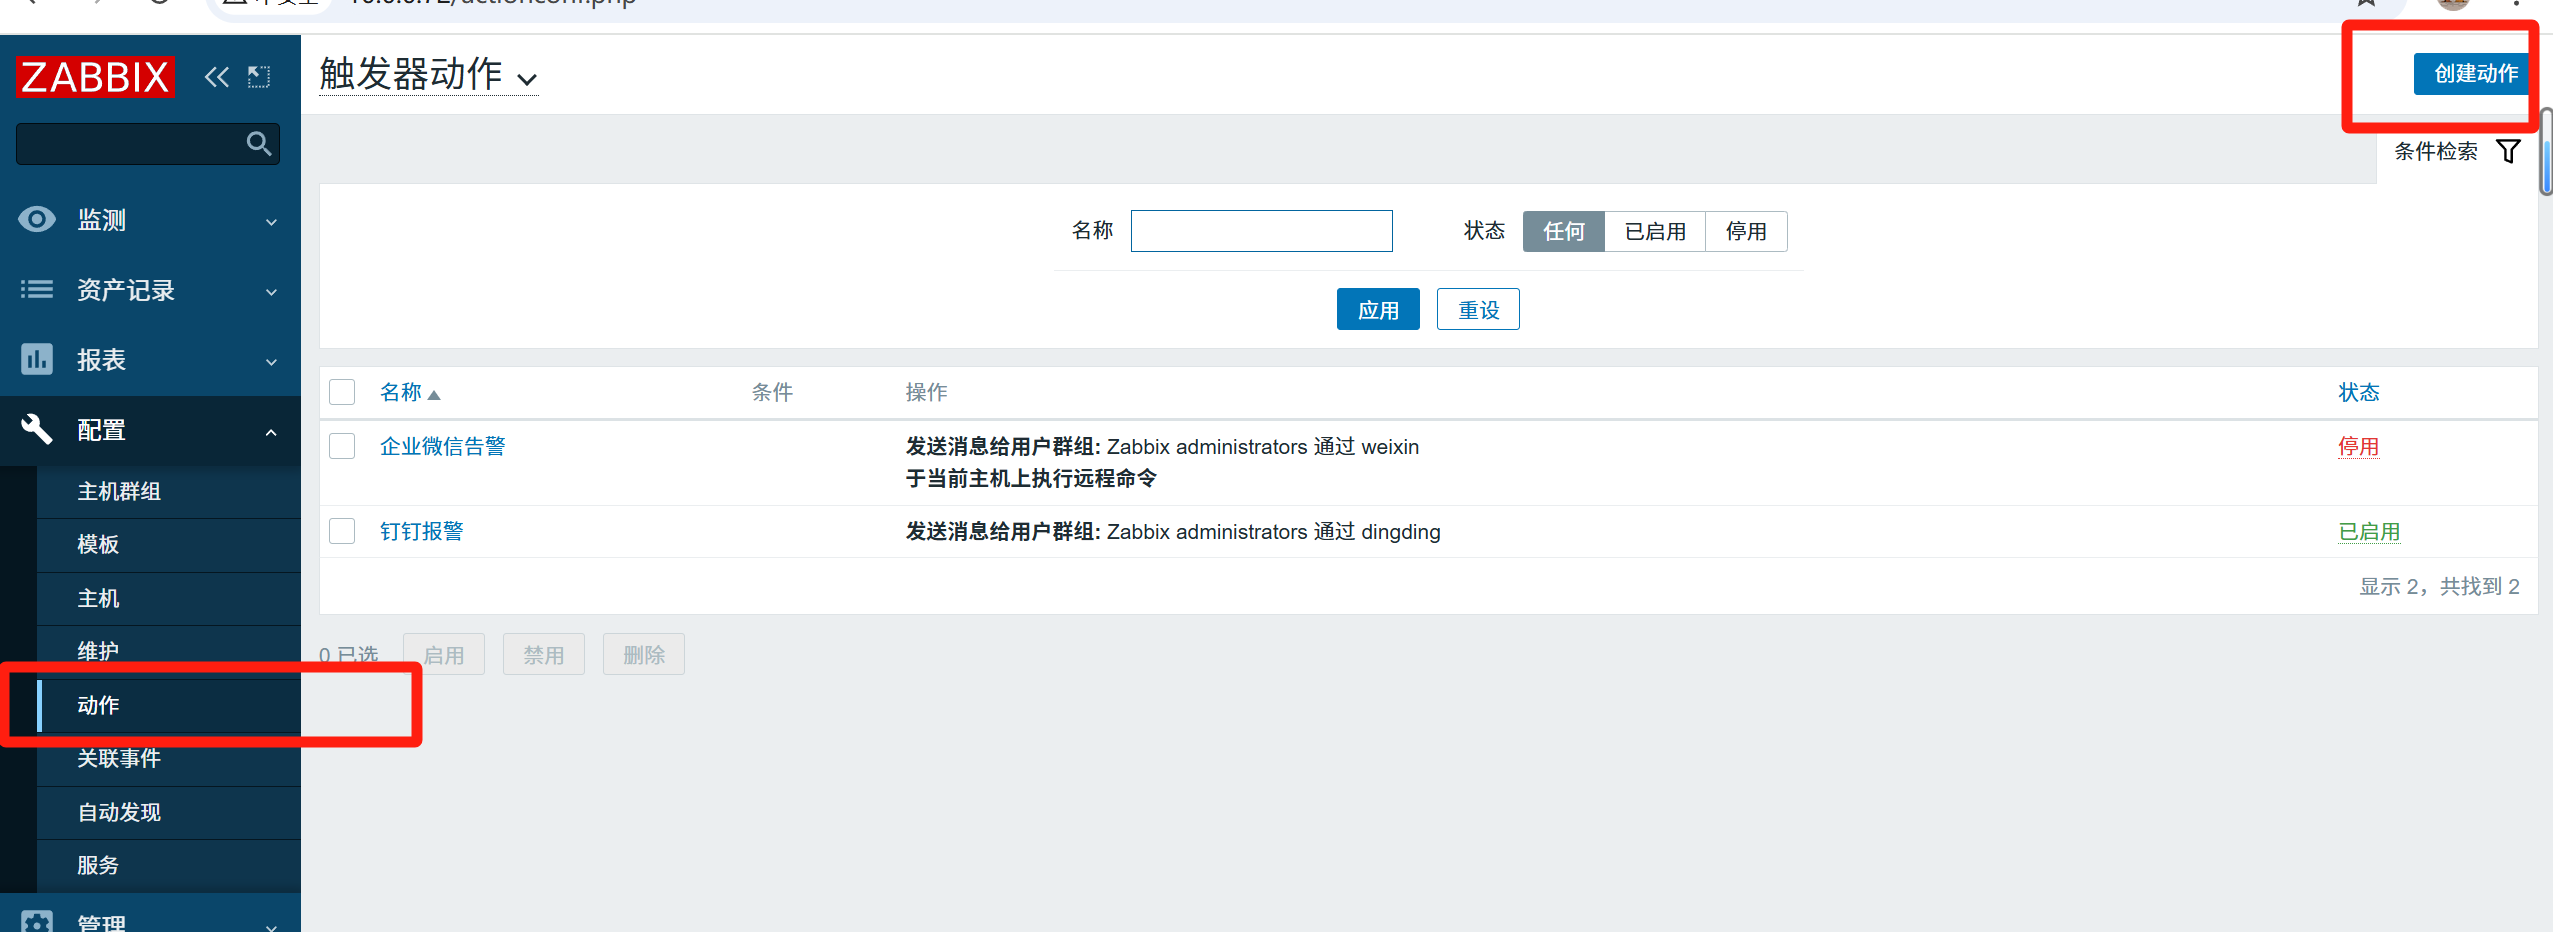
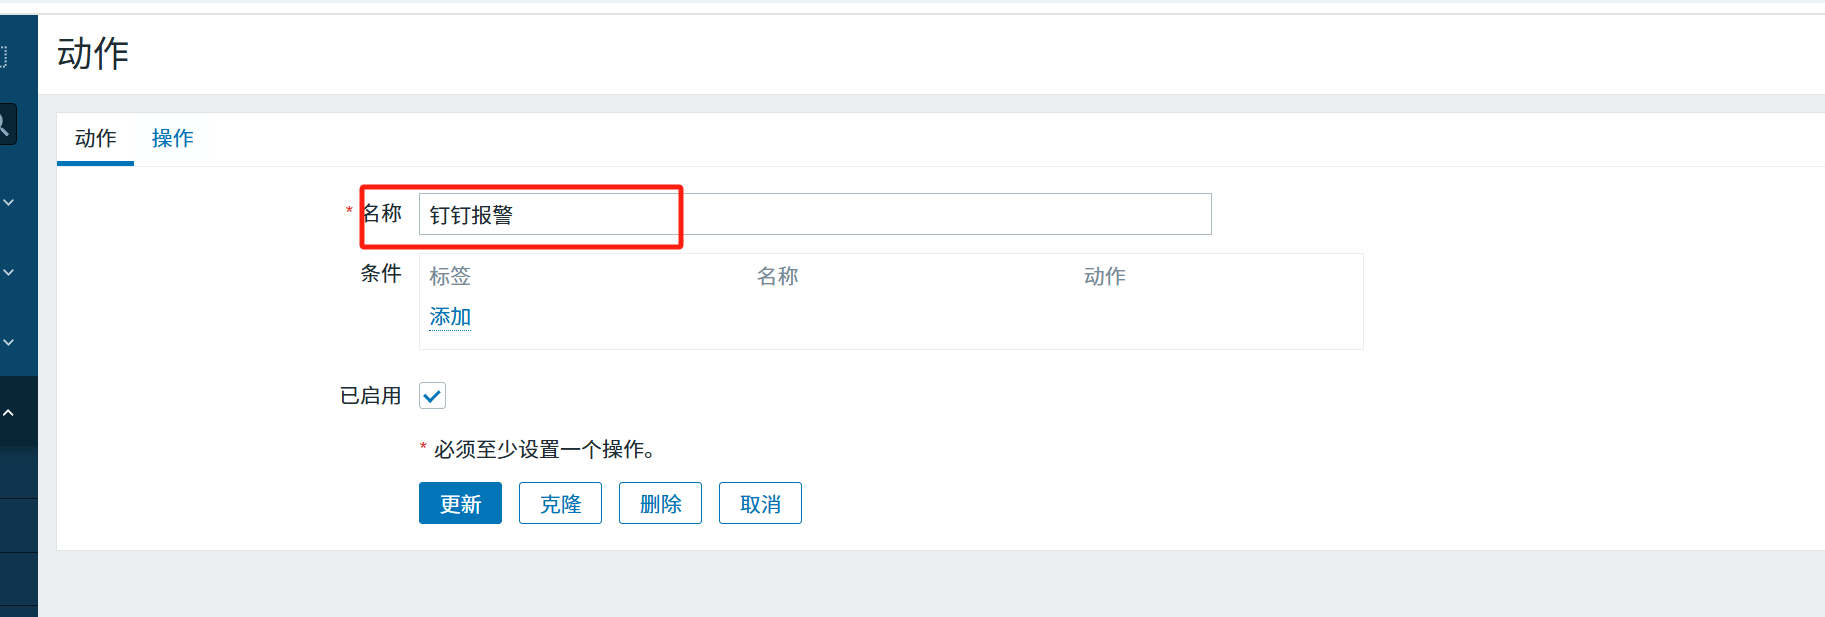
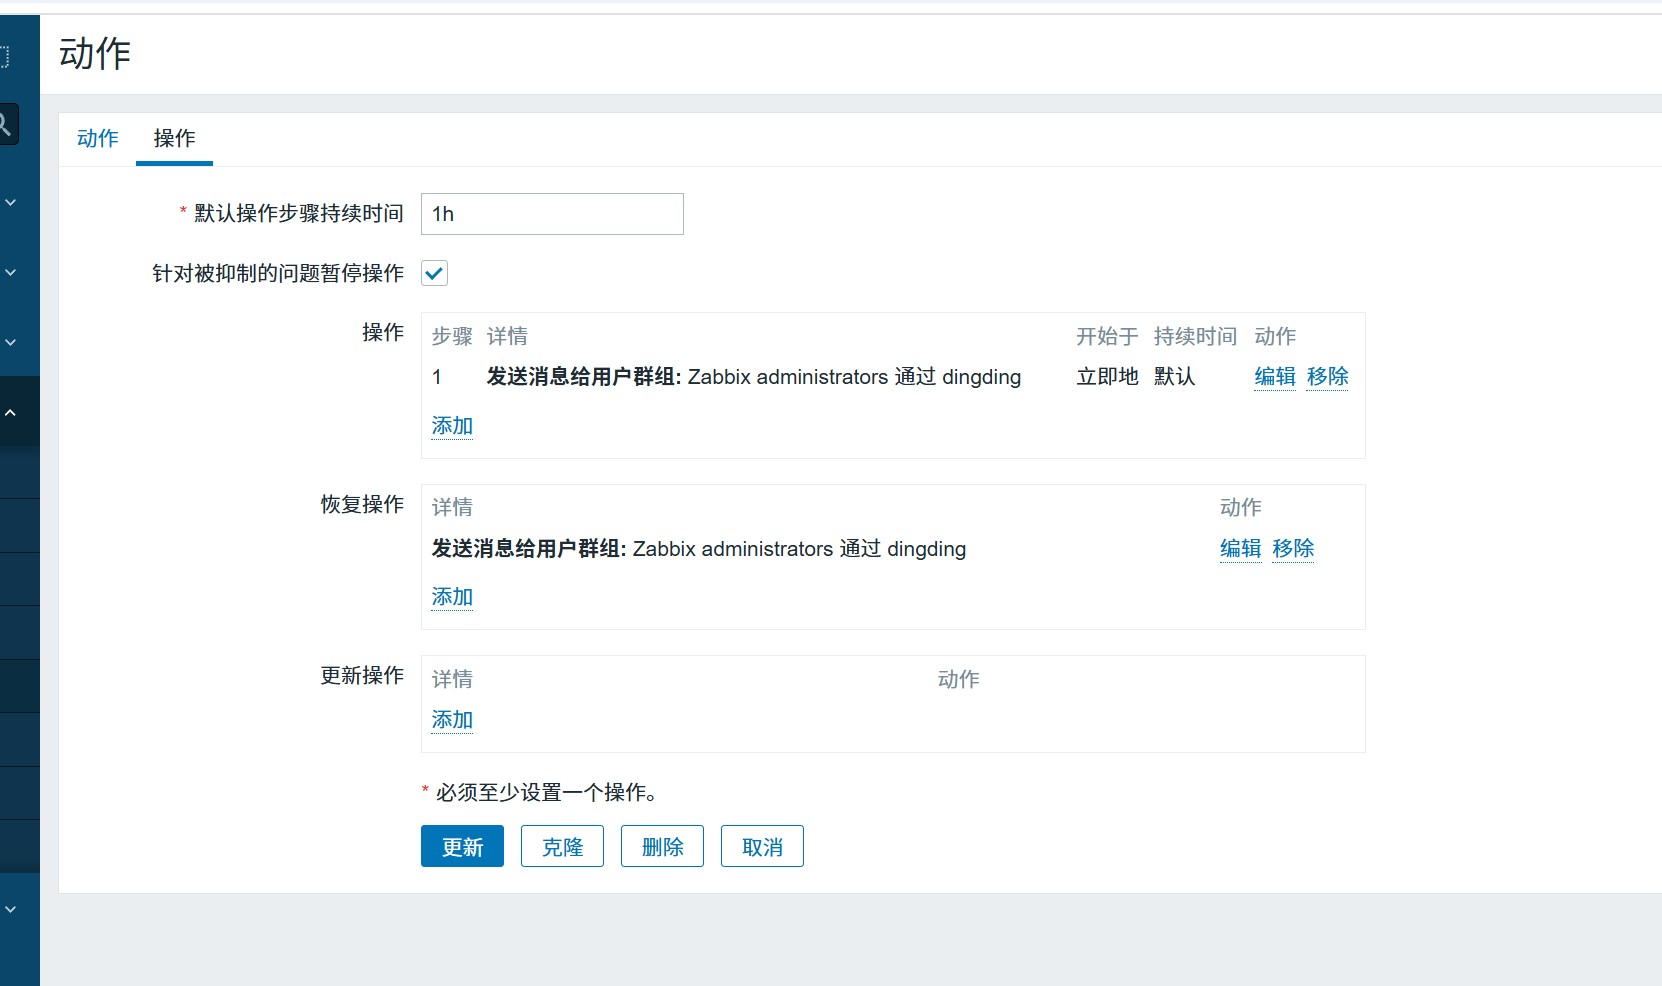
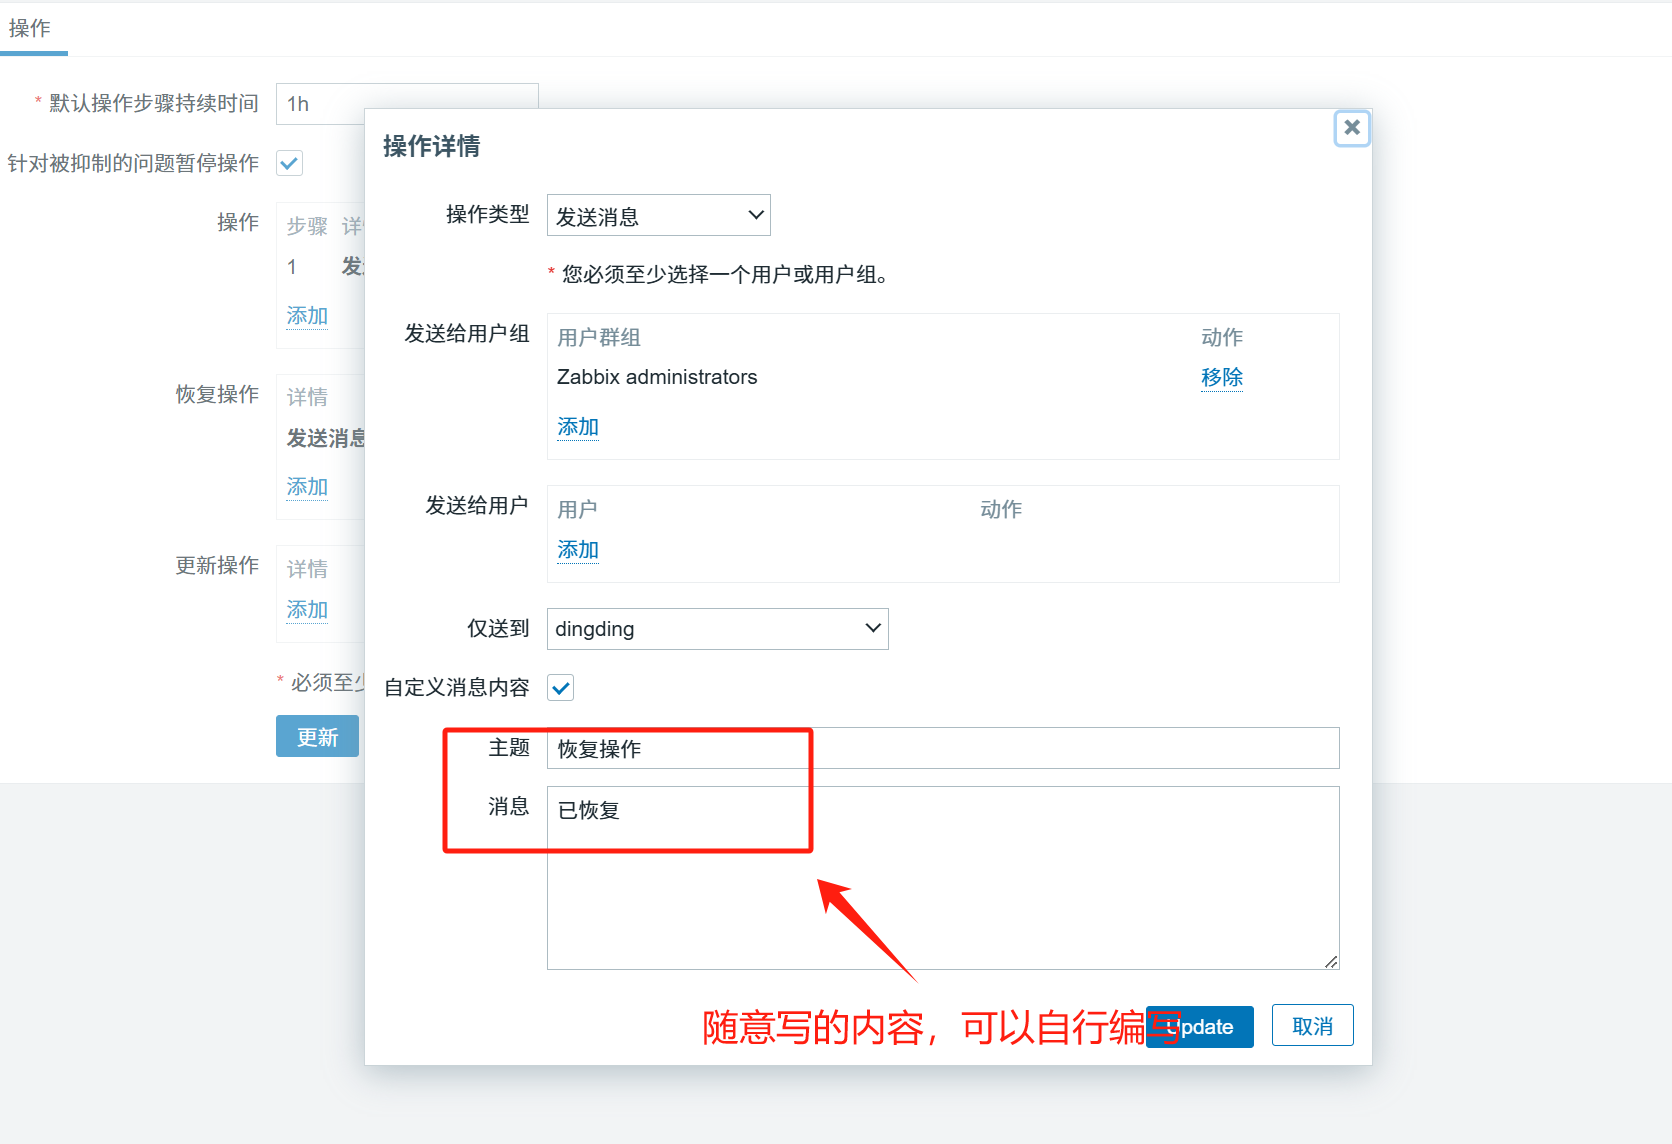
6、配置钉钉告警zabbix服务端页面设置
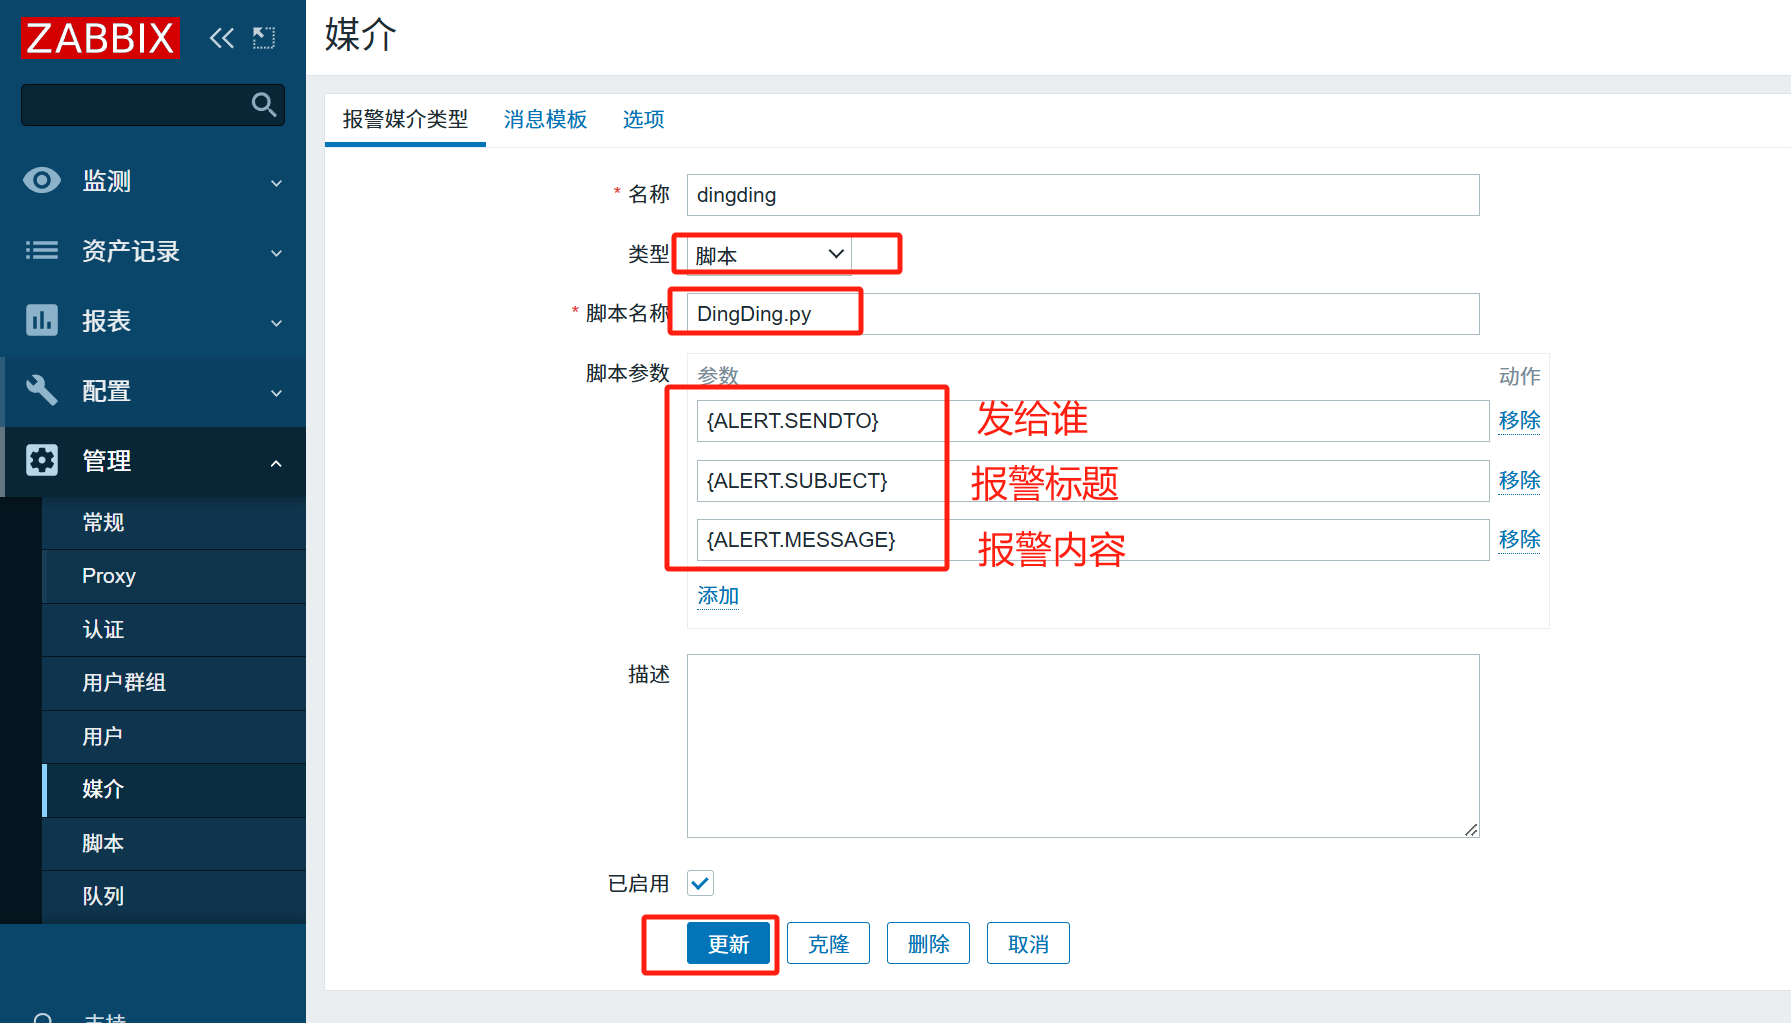

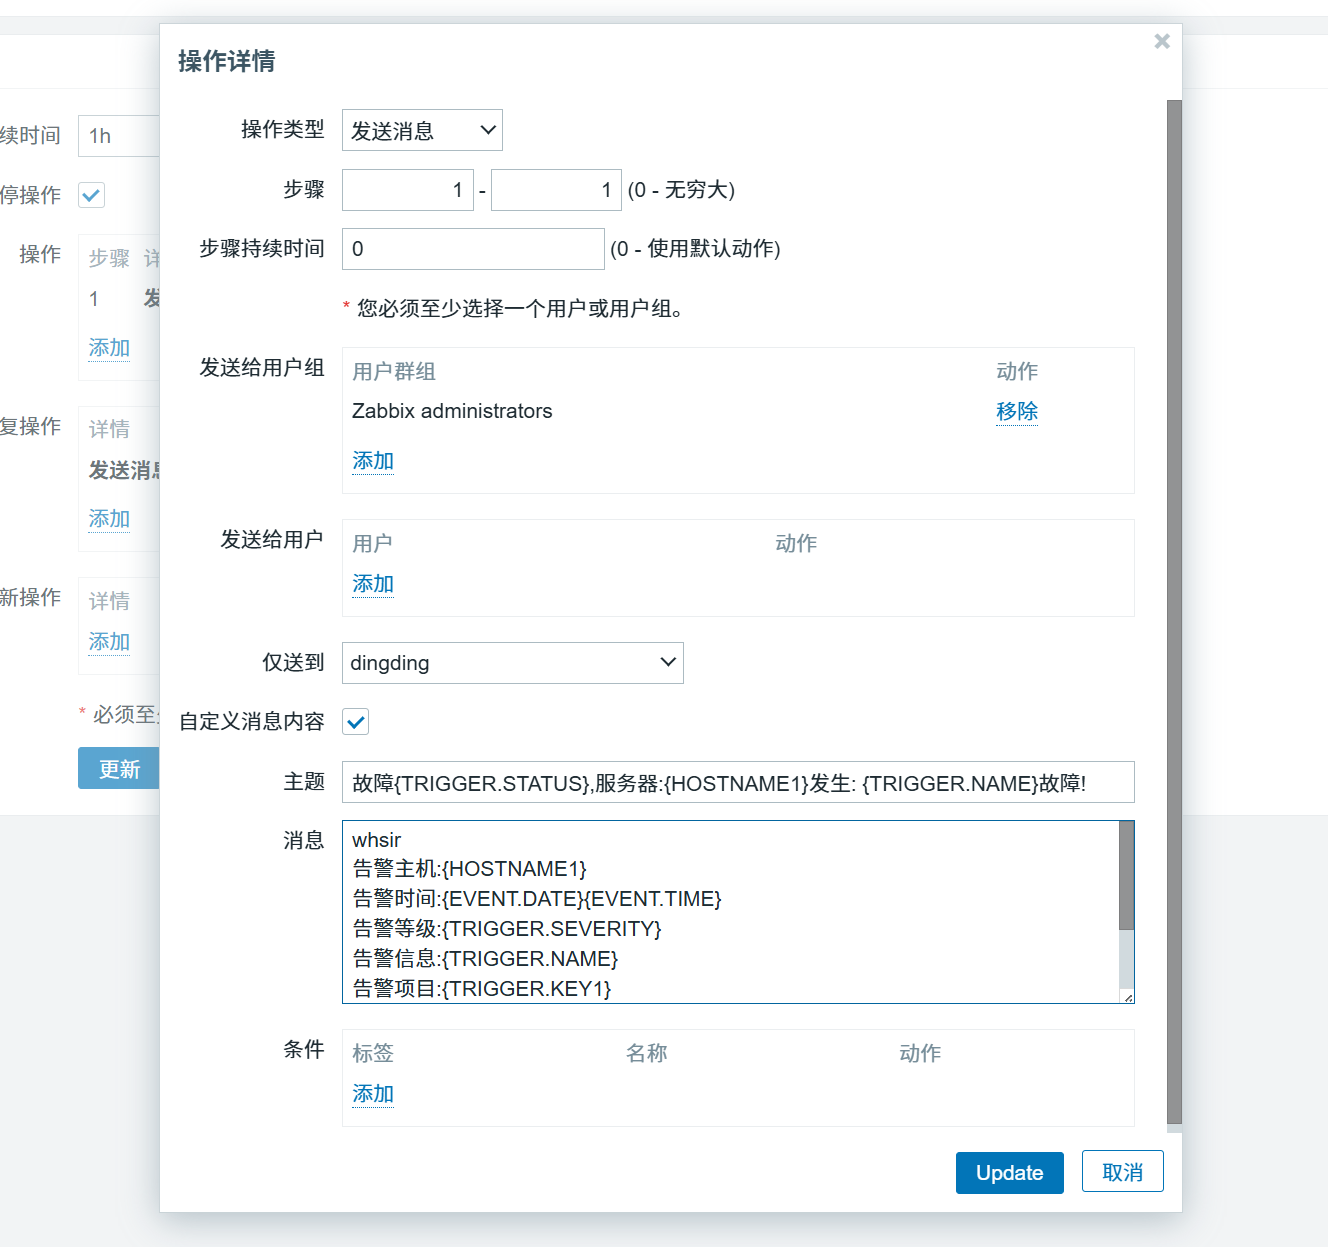
故障{TRIGGER.STATUS},服务器:{HOSTNAME1}发生: {TRIGGER.NAME}故障!
whsir
告警主机:{HOSTNAME1}
告警时间:{EVENT.DATE}{EVENT.TIME}
告警等级:{TRIGGER.SEVERITY}
告警信息:{TRIGGER.NAME}
告警项目:{TRIGGER.KEY1}
问题详情:{ITEM.NAME}:{TEM.VALUE}
当前状态:{TRIGGER.STATUS}:{ITEM.VALUE1}
事件ID:{EVENT.ID}
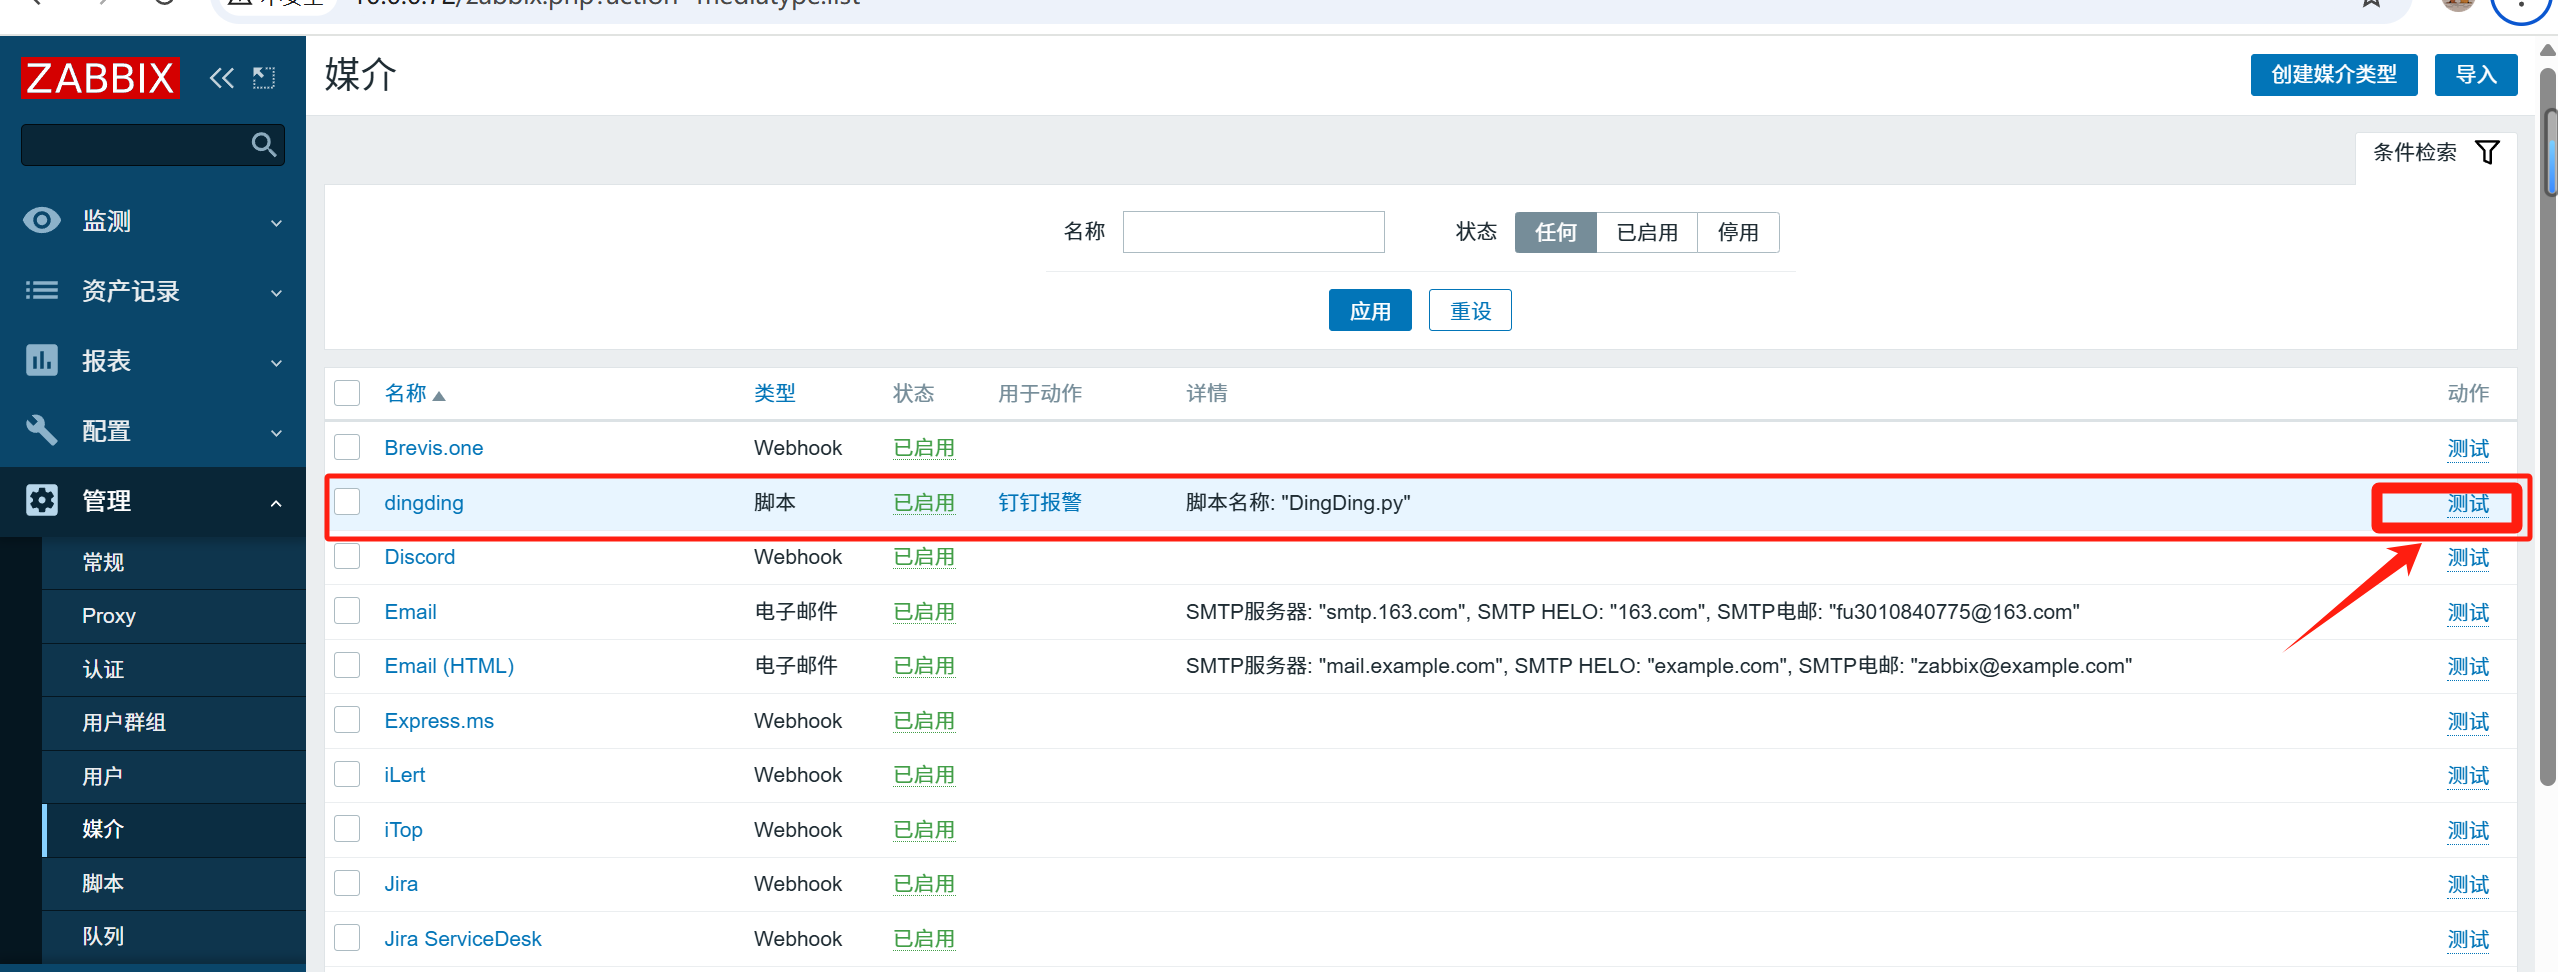
7、测试能否发送成功
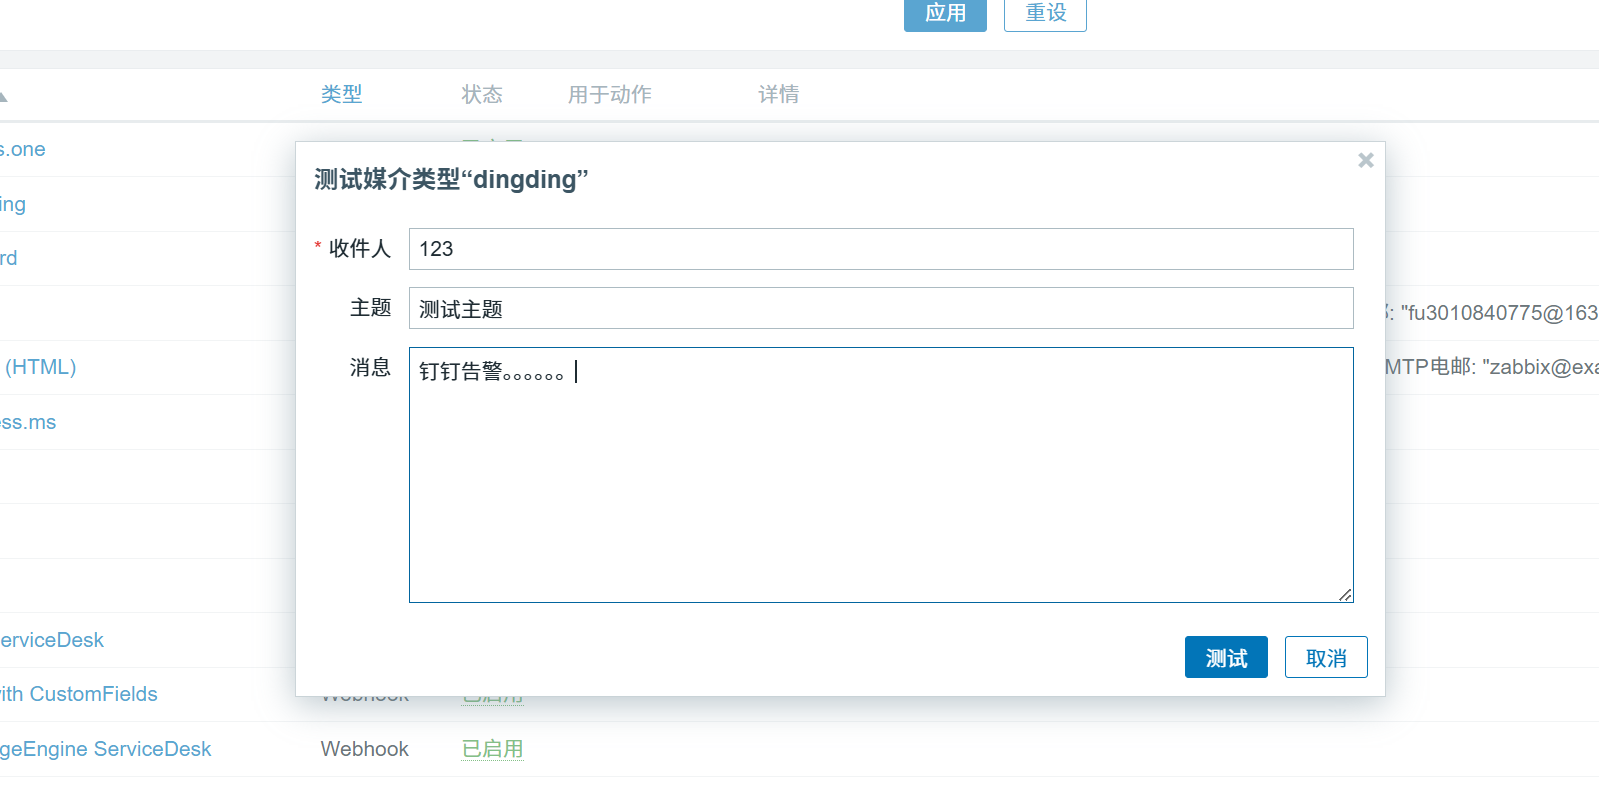
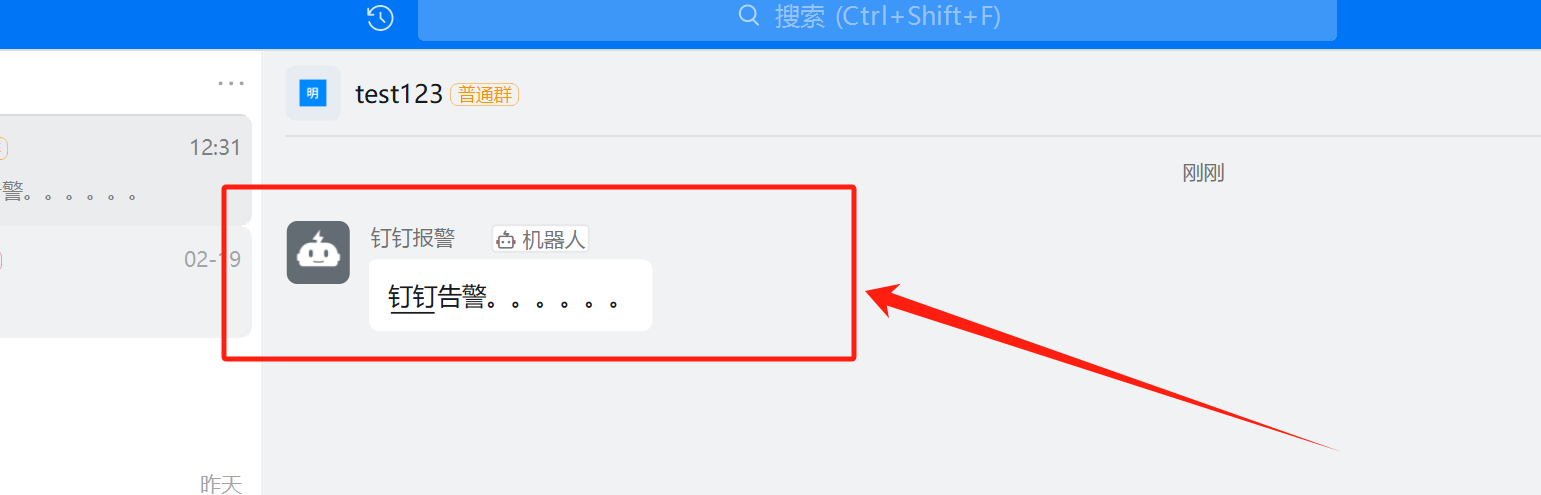
# 可以自定模拟将es集群down掉,触发钉钉告警

 浙公网安备 33010602011771号