
使用chrome tracing 可视化benchmark结果
打开chrome内核的浏览器,输入:chrome://tracing
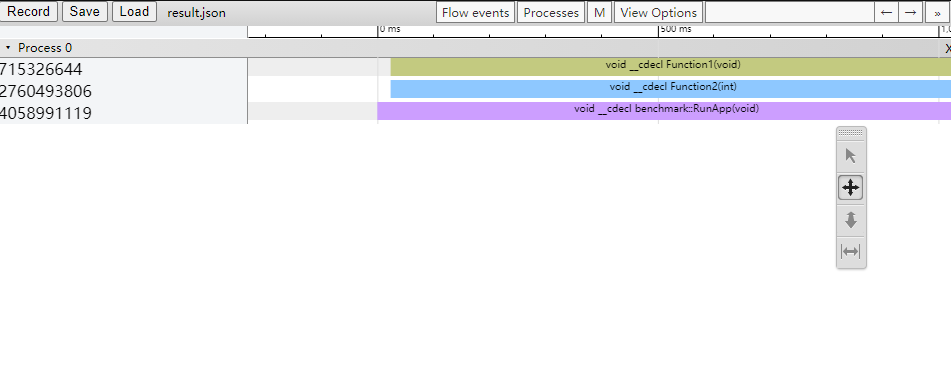
将我们benchmark结果的json文件直接拖动到浏览器中就可以看到benchmark的结果。效果图如下:
C++实现
实现计时器类,并输出调用函数相关的调用信息到文件中,具体实现如下:
#pragma once
#include <iostream>
#include <fstream>
#include <chrono>
#include <algorithm>
#include <thread>

#define PROFILING 1
#if PROFILING
#define PROFILE_SCOPE(name) InstrumentationTimer timer##__LINE__(name)
#define PROFILE_FUNCTION() PROFILE_SCOPE(__FUNCSIG__)
#else
#define PROFILE_SCORE(name)
#endif

//当前监测的会话
struct InstrumentationSession
{
	std::string name;
};

//检测结果数据
struct ProfileResult
{
	std::string name;		//调用栈函数名称
	long long start, stop;	//起止时间
	uint32_t threadID;		//线程ID
};

class Instrumentor
{
private:
	InstrumentationSession* m_CurrentSession;
	std::ofstream m_OutputStream;
	int m_ProfileCount;
public:

	Instrumentor() : m_CurrentSession(nullptr), m_ProfileCount(0)
	{

	}

	void BeginSession(const std::string& name, const std::string& filepath = "result.json")
	{
		m_OutputStream.open(filepath);
		WriteHeader();
		m_CurrentSession = new InstrumentationSession{ name };
	}

	void EndSession()
	{
		WriteFooter();
		m_OutputStream.close();
		delete m_CurrentSession;
		m_CurrentSession = nullptr;
		m_ProfileCount = 0;
	}

	void WriteProfile(const ProfileResult& result)
	{
		if (m_ProfileCount++ > 0)
		{
			m_OutputStream << ",";

		}

		std::string name = result.name;
		std::replace(name.begin(), name.end(), '"', '\'');

		m_OutputStream << "{";
		m_OutputStream << "\"cat\":\"function\",";
		m_OutputStream << "\"dur\":" << (result.stop - result.start) << ",";
		m_OutputStream << "\"name\":\"" << name << "\",";
		m_OutputStream << "\"ph\":\"X\",";
		m_OutputStream << "\"pid\": 0,";
		m_OutputStream << "\"tid\": \"" << result.threadID << "\",";
		m_OutputStream << "\"ts\": " << result.start;
		m_OutputStream << "}";

		m_OutputStream.flush();
	}

	void WriteHeader()
	{
		m_OutputStream << "{\"otherData\": {}, \"traceEvents\": [";
		m_OutputStream.flush();
	}

	void WriteFooter()
	{
		m_OutputStream << "]}";
		m_OutputStream.flush();
	}

	static Instrumentor& Get()
	{
		static Instrumentor* instance = new Instrumentor();
		return *instance;
	}
};

//计时器
class InstrumentationTimer
{
private:
	std::string title;
	std::chrono::high_resolution_clock::time_point m_start;
	bool m_stoped;
public:

	InstrumentationTimer(const std::string& title) : title(title), m_stoped(false)
	{
		m_start = std::chrono::high_resolution_clock::now();
	}

	~InstrumentationTimer()
	{
		if (!m_stoped)
		{
			stop();
		}
	}

	void stop()
	{
		auto m_stop = std::chrono::high_resolution_clock::now();

		long long start = std::chrono::time_point_cast<std::chrono::microseconds>(m_start).time_since_epoch().count();
		long long stop = std::chrono::time_point_cast<std::chrono::microseconds>(m_stop).time_since_epoch().count();

		uint32_t threadID = std::hash<std::thread::id>{}(std::this_thread::get_id());
		Instrumentor::Get().WriteProfile({ title, start, stop, threadID});
		m_stoped = true;
	}
};
测试调用:
#include <iostream>
#include <string>
#include "Timer.h"
#include <cmath>

void Function1()
{
	PROFILE_FUNCTION();
	for (int i = 0; i < 1000; i++)
	{
		std::cout << pow(i, sqrt(sqrt(i))) << " ";
	}
	std::cout << std::endl;
}

void Function2(int v)
{
	PROFILE_FUNCTION();
	for (int i = 0; i < 1000; i++)
	{
		std::cout << abs(i * v) << " ";
	}
	std::cout << std::endl;
}

namespace benchmark {
	void RunApp()
	{
		PROFILE_FUNCTION();
		std::thread a([]() {Function1(); });
		std::thread b([]() {Function2(10); });

		a.join();
		b.join();
	}
}

int main()
{
	Instrumentor::Get().BeginSession("profile");
	benchmark::RunApp();
	Instrumentor::Get().EndSession();

}
将执行结果的result.json文件拖到浏览器内:

参考:
https://www.chromium.org/developers/how-tos/trace-event-profiling-tool

 浙公网安备 33010602011771号