Prometheus之监控Mysql服务器及Grafana可视化
1. 安装配置mysql_exporter
1. 下载mysql_exporter
wget https://github.com/prometheus/mysqld_exporter/releases/download/v0.15.0-rc.0/mysqld_exporter-0.15.0-rc.0.linux-amd64.tar.gz
2. 改名并移动到指定目录
tar -zxvf mysqld_exporter-0.15.0-rc.0.linux-amd64.tar.gz
mv mysqld_exporter-0.15.0-rc.0.linux-amd64 /usr/local/mysqld_exporter
3. 创建账号并授权,直接用root
GRANT PROCESS, REPLICATION CLIENT, SELECT ON *.* TO 'exporter'@'localhost';
4. 创建一个配置文件
vi /usr/local/mysqld_exporter/my.cnf
[client]
user=root
password=123.com
5. 启动mysql_exporter
./mysqld_exporter --config.my-cnf=my.cnf
6. 添加为系统服务
vi /usr/lib/systemd/system/mysqld_exporter.service
[Unit]
Description=https://prometheus.io

[Service]
Restart=on-failure
ExecStart=/usr/local/mysqld_exporter/mysqld_exporter --config.my-cnf=/usr/local/mysqld_exporter/my.cnf

[Install]
WantedBy=multi-user.target
systemctl daemon-reload
systemctl restart mysqld_exporter.service
7. 访问一下http://172.16.1.209:9104/metrics
8. 在prometheus.yml添加对应的机器
  - job_name: 'mysql'
    static_configs:
      - targets: ['172.16.1.209:9104']
9. 检查并重启服务
promtool check config prometheus.yml
kill -HUP 5997
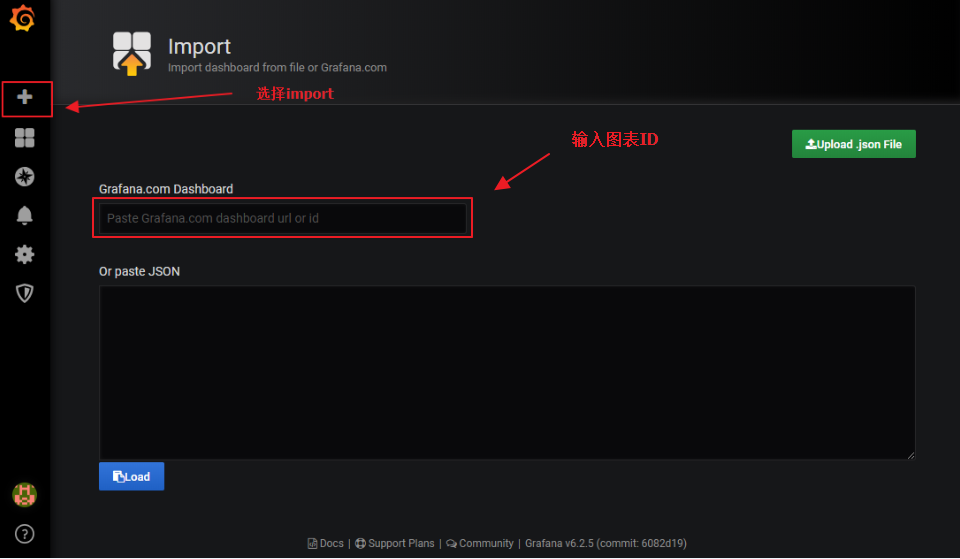
2. Grafana导入Mysql监控图
1. 使用图标ID
https://grafana.com/dashboards/7362
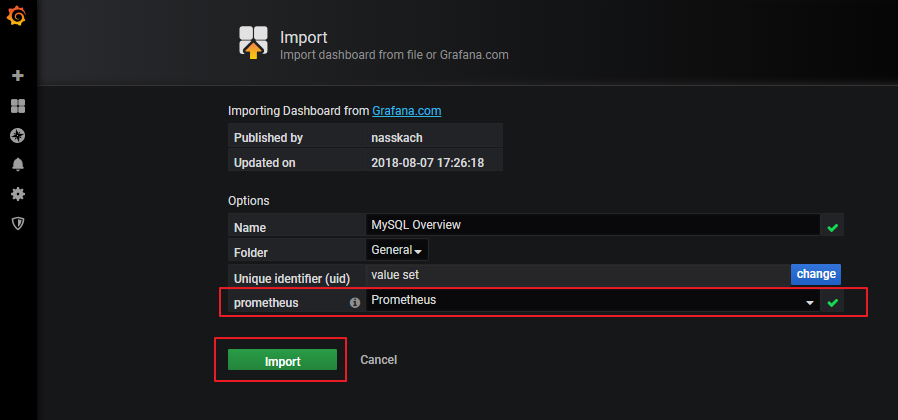
2. 导入以后,改名保存
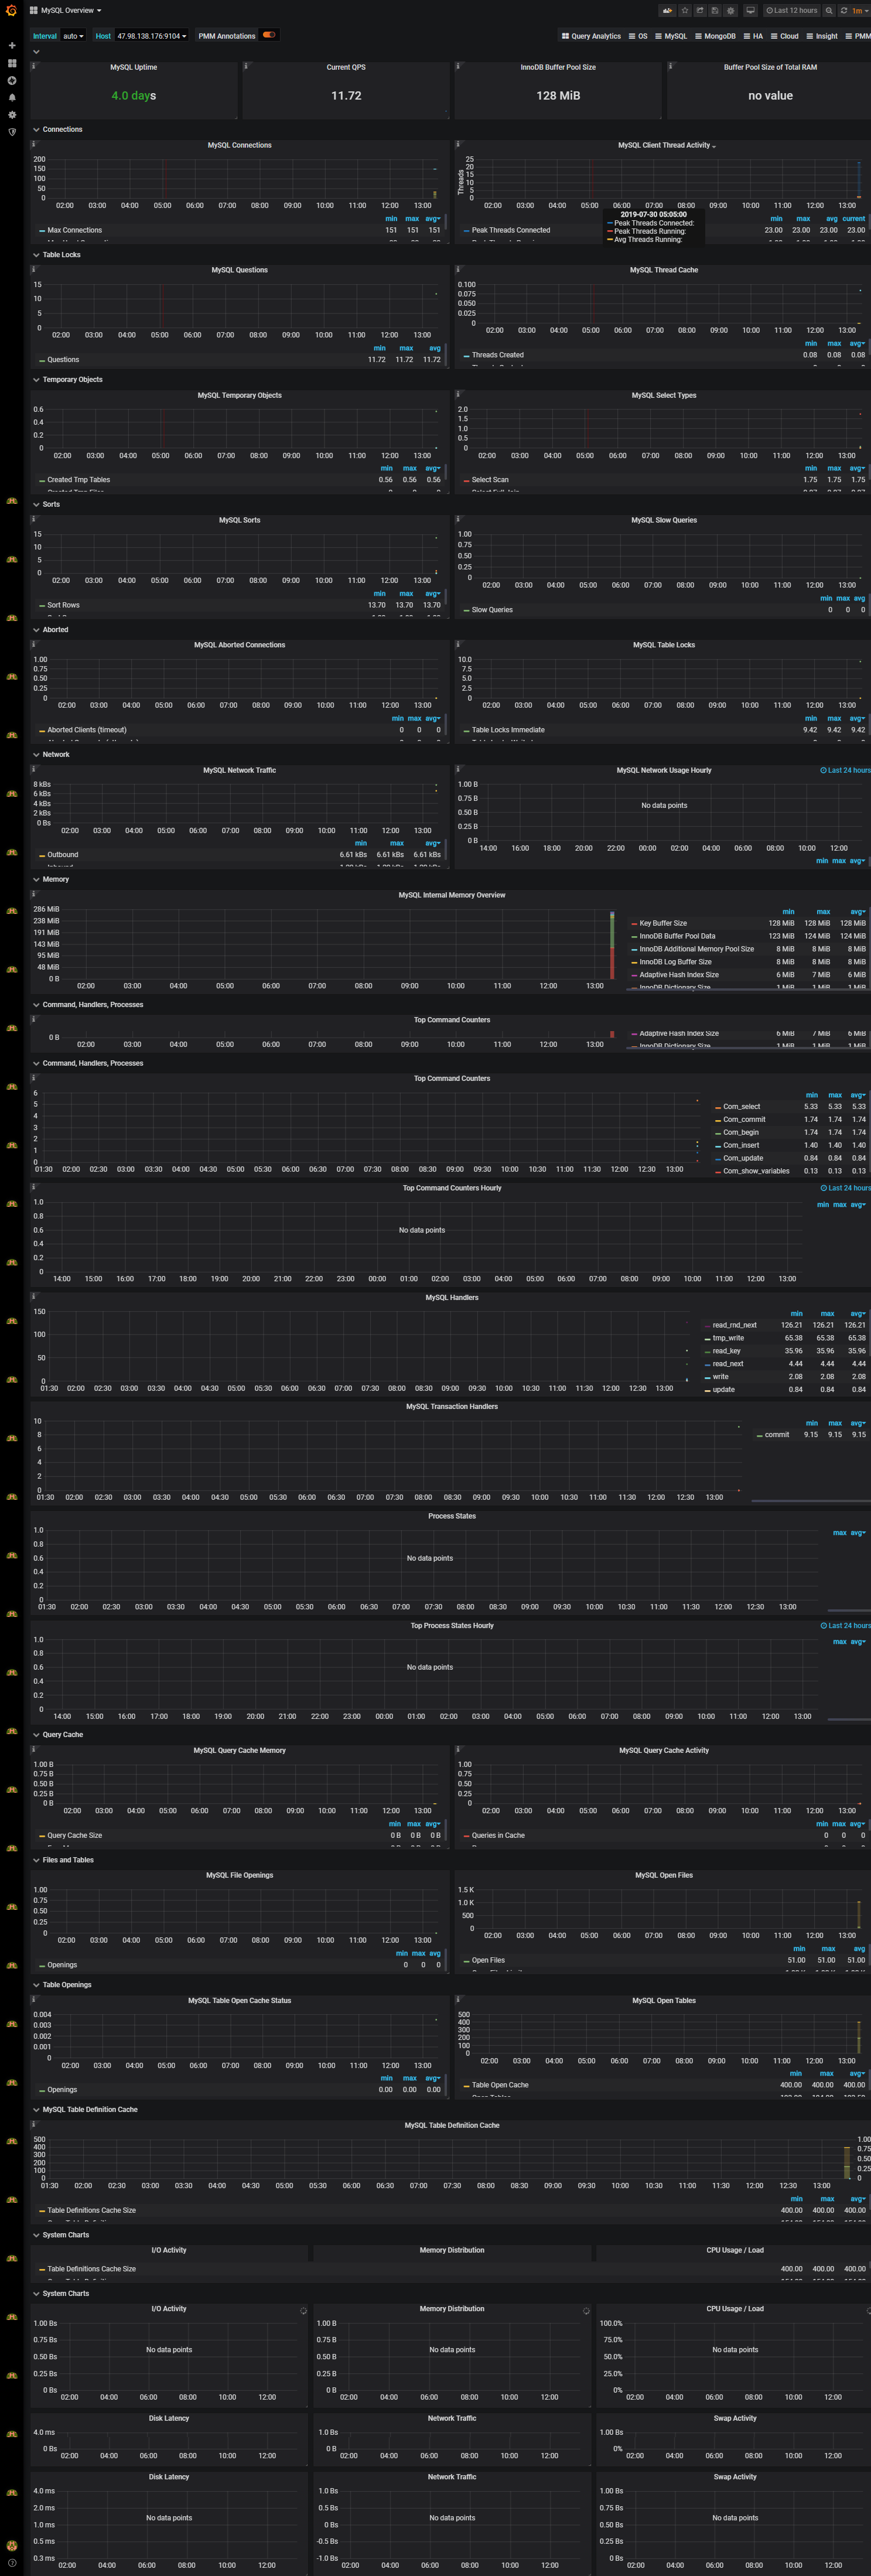
3. 展示

 浙公网安备 33010602011771号