【转载】Matplotlib 图形尺寸设置:全面掌握 Figure Size 控制技巧
原文地址:
https://geek-docs.com/matplotlib/matplotlib-ask-answer/matplotlib-figure-size_z1-2.html
Matplotlib 是 Python 中最流行的 数据可视化 库之一,它提供了丰富的绘图功能和灵活的自定义选项。在使用 Matplotlib 创建图形时,控制图形尺寸是一个非常重要的方面。适当的图形尺寸不仅能够提高可视化效果,还能确保图形在不同场景下的适用性。本文将深入探讨 Matplotlib 中的图形尺寸设置,包括基本概念、常用方法、高级技巧以及实际应用案例。
1. 图形尺寸的基本概念
在 Matplotlib 中,图形尺寸主要由 Figure 对象的 size 属性控制。Figure 是整个图形的容器,包含了所有的绘图元素。图形尺寸通常以英寸为单位,但也可以使用其他单位。
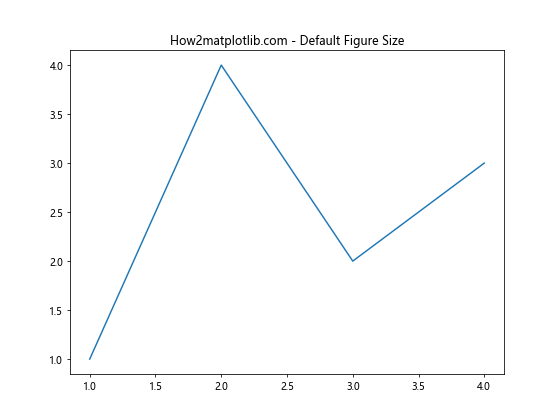
1.1 默认图形尺寸
Matplotlib 有一个默认的图形尺寸,通常为 6.4 x 4.8 英寸。这个默认值可以通过 rcParams 参数来查看或修改。
import matplotlib.pyplot as plt

# 查看默认图形尺寸
print(f"Default figure size: {plt.rcParams['figure.figsize']}")

# 修改默认图形尺寸
plt.rcParams['figure.figsize'] = [8, 6]

# 创建一个使用新默认尺寸的图形
fig, ax = plt.subplots()
ax.plot([1, 2, 3, 4], [1, 4, 2, 3])
ax.set_title("How2matplotlib.com - Default Figure Size")
plt.show()
Output:
1.2 DPI(每英寸点数)
DPI 是另一个与图形尺寸密切相关的概念。它决定了图形在屏幕上显示的大小以及保存为图片文件时的分辨率。
import matplotlib.pyplot as plt

# 创建一个指定 DPI 的图形
fig, ax = plt.subplots(figsize=(6, 4), dpi=100)
ax.plot([1, 2, 3, 4], [1, 4, 2, 3])
ax.set_title("How2matplotlib.com - Figure with Specified DPI")
plt.show()

# 保存高分辨率图片
fig.savefig('high_res_plot.png', dpi=300)
Output:

这个例子展示了如何在创建图形时指定 DPI,以及如何在保存图形时使用不同的 DPI 值。较高的 DPI 值会产生更高分辨率的图像,但文件大小也会相应增加。
2. 设置图形尺寸的常用方法
Matplotlib 提供了多种方法来设置图形尺寸,以适应不同的使用场景和个人偏好。
2.1 使用 figsize 参数
最直接的方法是在创建 Figure 对象时使用 figsize 参数。
import matplotlib.pyplot as plt

# 使用 figsize 参数创建指定尺寸的图形
fig, ax = plt.subplots(figsize=(10, 5))
ax.plot([1, 2, 3, 4], [1, 4, 2, 3])
ax.set_title("How2matplotlib.com - Custom Figure Size")
plt.show()
Output:
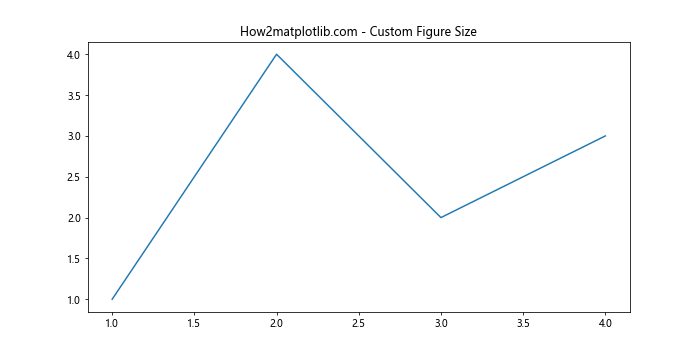
这个例子创建了一个 10×5 英寸的图形。figsize 参数接受一个包含宽度和高度的元组。
2.2 使用 set_size_inches() 方法
对于已经创建的 Figure 对象,可以使用 set_size_inches() 方法来调整其尺寸。
import matplotlib.pyplot as plt

# 创建默认尺寸的图形
fig, ax = plt.subplots()
ax.plot([1, 2, 3, 4], [1, 4, 2, 3])

# 调整图形尺寸
fig.set_size_inches(12, 6)
ax.set_title("How2matplotlib.com - Resized Figure")
plt.show()
Output:
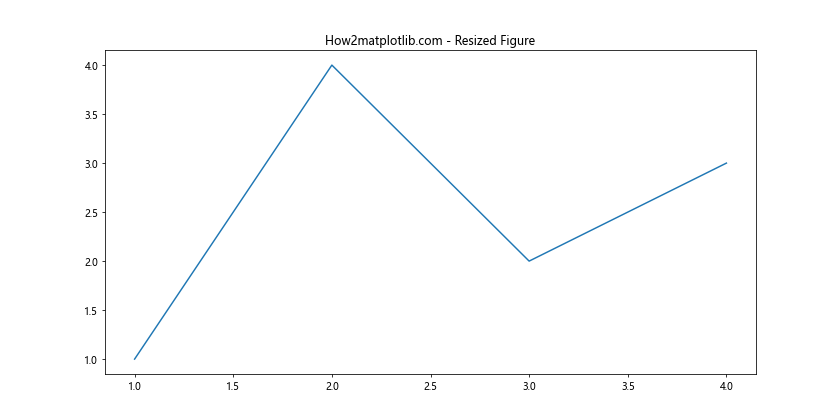
这个方法允许你在绘图过程中动态调整图形尺寸,非常灵活。
2.3 使用 tight_layout() 自动调整
tight_layout() 函数可以自动调整子图之间的间距,确保所有元素都能正确显示。
import matplotlib.pyplot as plt

fig, (ax1, ax2) = plt.subplots(1, 2, figsize=(10, 4))
ax1.plot([1, 2, 3, 4], [1, 4, 2, 3])
ax2.plot([1, 2, 3, 4], [3, 2, 4, 1])

ax1.set_title("How2matplotlib.com - Subplot 1")
ax2.set_title("How2matplotlib.com - Subplot 2")

plt.tight_layout()
plt.show()
Output:
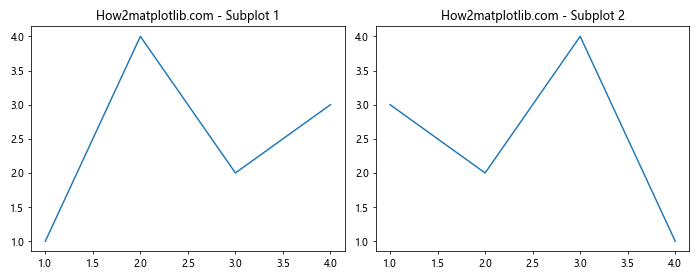
tight_layout() 特别适用于包含多个子图或有长标题的图形,它可以防止元素之间的重叠。
3. 高级图形尺寸控制技巧
除了基本的尺寸设置方法,Matplotlib 还提供了一些高级技巧来更精细地控制图形尺寸和布局。
3.1 使用 GridSpec 进行复杂布局
GridSpec 允许你创建更复杂的图形布局,并精确控制每个子图的大小和位置。
import matplotlib.pyplot as plt
import matplotlib.gridspec as gridspec

fig = plt.figure(figsize=(12, 8))
gs = gridspec.GridSpec(2, 3, height_ratios=[2, 1], width_ratios=[1, 2, 1])

ax1 = fig.add_subplot(gs[0, :2])
ax2 = fig.add_subplot(gs[0, 2])
ax3 = fig.add_subplot(gs[1, :])

ax1.plot([1, 2, 3, 4], [1, 4, 2, 3])
ax2.plot([1, 2, 3, 4], [3, 2, 4, 1])
ax3.plot([1, 2, 3, 4], [2, 3, 1, 4])

ax1.set_title("How2matplotlib.com - Main Plot")
ax2.set_title("How2matplotlib.com - Side Plot")
ax3.set_title("How2matplotlib.com - Bottom Plot")

plt.tight_layout()
plt.show()
Output:
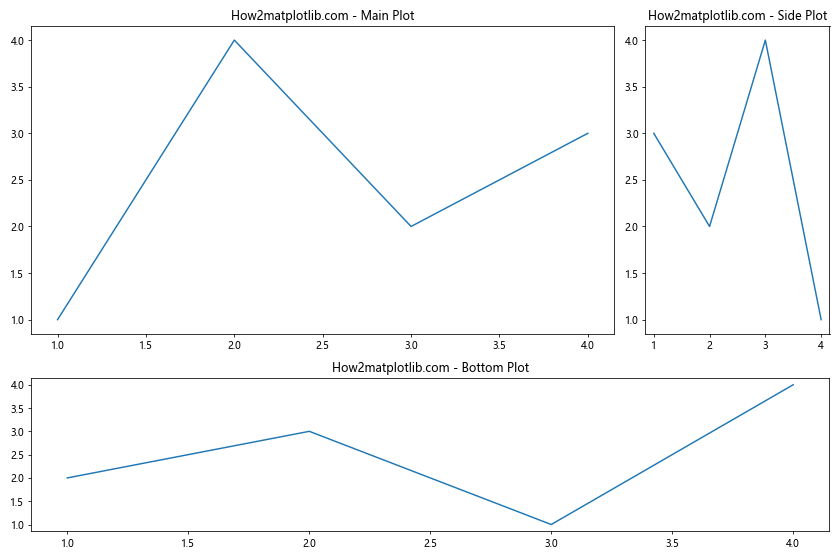
这个例子展示了如何使用 GridSpec 创建一个包含三个子图的复杂布局,每个子图的大小和位置都可以精确控制。
3.2 调整子图间距
除了使用 tight_layout(),你还可以手动调整子图之间的间距。
import matplotlib.pyplot as plt

fig, (ax1, ax2) = plt.subplots(1, 2, figsize=(12, 5))
ax1.plot([1, 2, 3, 4], [1, 4, 2, 3])
ax2.plot([1, 2, 3, 4], [3, 2, 4, 1])

ax1.set_title("How2matplotlib.com - Left Plot")
ax2.set_title("How2matplotlib.com - Right Plot")

# 调整子图间距
plt.subplots_adjust(wspace=0.5, hspace=0.5)
plt.show()
Output:

subplots_adjust() 函数允许你精细控制子图之间的间距,wspace 控制宽度方向的间距,hspace 控制高度方向的间距。
3.3 使用 constrained_layout
constrained_layout 是一个新的自动布局调整器,它可以更智能地处理复杂的布局情况。
import matplotlib.pyplot as plt

fig, axs = plt.subplots(2, 2, figsize=(10, 8), constrained_layout=True)

for ax in axs.flat:
    ax.plot([1, 2, 3, 4], [1, 4, 2, 3])
    ax.set_title("How2matplotlib.com - Subplot")

plt.show()
Output:
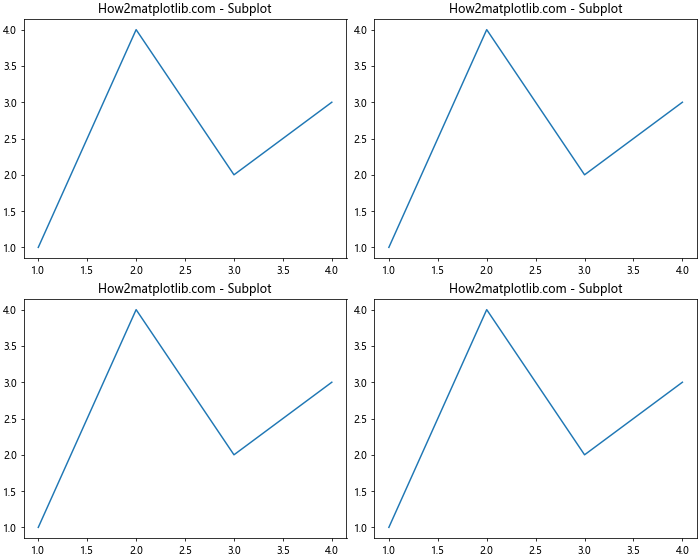
constrained_layout 可以自动调整子图的大小和位置,以确保标题、标签等元素不会重叠。
以下内容省略,请参照原文。
原文地址:
https://geek-docs.com/matplotlib/matplotlib-ask-answer/matplotlib-figure-size_z1-2.html
posted on 2025-01-31 21:16 Angry_Panda 阅读(492) 评论(0) 收藏 举报


 浙公网安备 33010602011771号