echarts 实现漏斗图中心、右侧同时显示
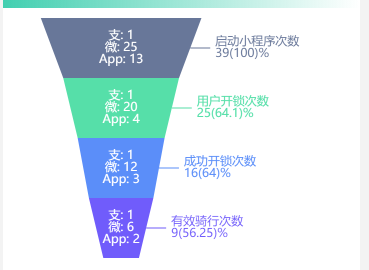
效果图:
代码实现:
let option = {
tooltip: {
trigger: 'item',
formatter: '{b} : {c}%'
},
labelLine: {
show: true
},
series: [{
name: '漏斗',
type: 'funnel',
top: 10,
bottom: 10,
left: -60,
width: '100%',
height: '80%',
min: 0,
max: 100,
minSize: '10%',
maxSize: '100%',
sort: 'descending',
gap: 0,
color: ['#705CFB', '#687799','#56DFA9', '#5B8EF9'],
label: { //设置字体放在漏斗内部
position: 'inside',
formatter: function(params) {
return (
'支: ' + params.data.name + '\n' +
'微: ' + params.data.value + '\n' +
'App: ' + params.data.app
);
},
color: '#fff',
fontStyle: 'normal',
textBorderColor: '#fff', //边框
},
data: this.dataRight,
}, {
name: '漏斗', //名字
type: 'funnel', //echarts类型
top: 10,
bottom: 10,
left: -60, // 距左侧的距离
width: '100%', //宽
height: '80%', //高
min: 0, //
max: 100,
minSize: '10%', //漏斗最小值的宽度
maxSize: '100%', //漏斗最大值的宽度
sort: 'descending', // 金字塔形:'ascending', 漏斗图形:'descending'
gap: 0, //图例之间的间隔
color: ['#705CFB', '#687799','#56DFA9', '#5B8EF9'],
label: { //漏斗外部显示的
position: 'right', //位置
formatter: function(params) {
return (
params.data.name + '\n' +
params.data.value + '(' + params.data.num + ')%'
);
},
// fontStyle: 'normal',
// textBorderColor: '#fff',
},
itemStyle: {
opacity: 1, //图形透明度
borderColor: '#fff', //图形边框颜色
borderWidth: 0 //图形边框宽度
},
data: this.dataList,
// z: 100,
},

]
};
本文来自博客园,作者:danmo_xx,转载请注明原文链接:https://www.cnblogs.com/xx321/p/18089289

 浙公网安备 33010602011771号