
SEE 03 Software Cost Estimation
Software Cost Estimation
3.1 Measurement, Measure and Metric
Measures provide data which yield information which leads to better decisions.
Measurement: A measure that assigns a scale value, which can be a number or a category, to an attribute of an entity.
Metric: A measure of the extent to which a system, component, or process holds a given property.
Subjective Measure and Objective Measure
- A subjective measure requires human judgment.
Example: defect severity, function points, readability and usability - There are precise rules for quantifying an objective measure.
Example: effort, cost and LOC
Some metrics are based on single-valued measures.
Others are derived from one or more base measures.
Levels of Measurement
- Nominal – a nominal measure maps objects to mutual exclusive, but not ordered, categories.
Example: A nominal scale only shows categories of things. - Ordinal – an ordinal measure rank orders object. An ordinal scale puts the categories into a particular order.
Example: defect severity. - Interval – an interval measure. The difference between the values has the same significance at all points on the scale.
Example: meter, centimeter. - Ratio – proportion of something compared to another thing.
Example: productivity.
Six Core Metrics of Software
-
Size (LOC, Function points, use cases, features)
-
Effort: the amount of labor required to complete a task, measured in terms of person months or person hours
-
Cost
-
Duration: the amount of calendar time or clock time to complete a project or task.
-
Productivity = size / effort, LOC or function points (or unit of product) per month or per hour.
-
Quality
- Number of defects (possibly categorized by type and severity)
- Defect density
- Defect removal efficiency
- Mean time to failure (MTTF)
- Defects per unit of testing (i.e., defects found per hour of testing)
- Code coverage during testing
- Quantification of non-functional attributes (usability, maintainability, etc.)
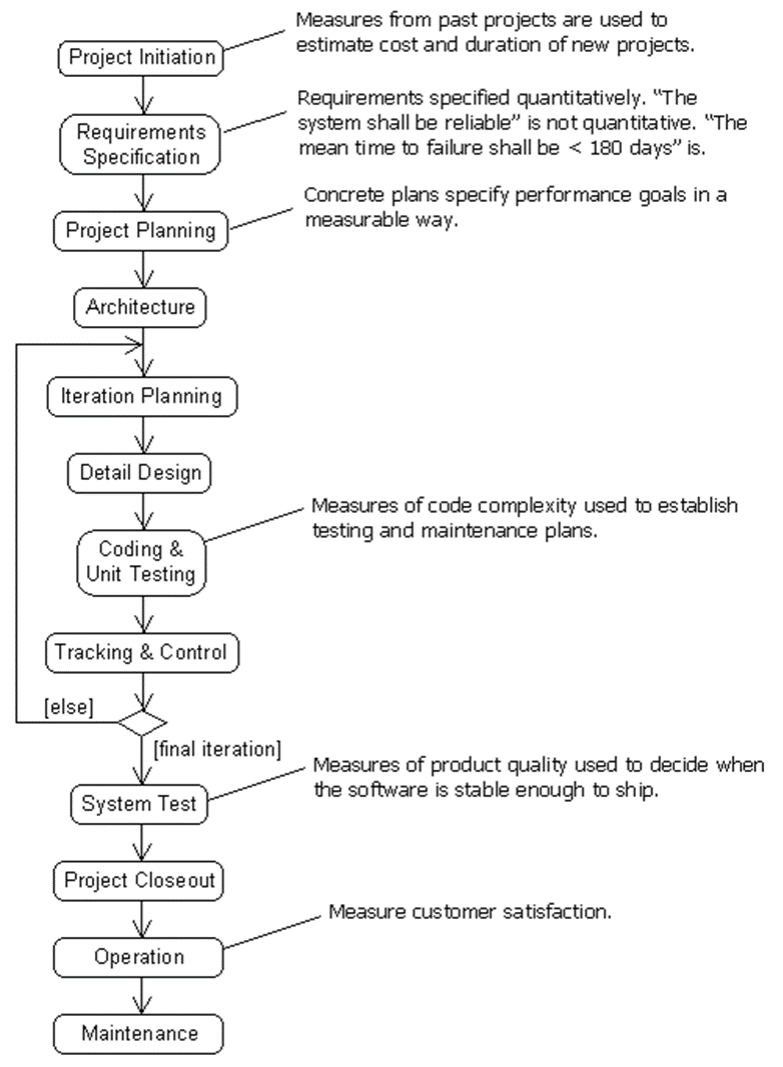
3.2 Process of Software Measurement
Opportunities for measurement during the software life cycle
Goal – Question – Metric (GQM)
proper order:
- Goal – Define the problem you are trying to solve or opportunity you want to pursue.
- Question – What questions, if answered, would likely lead to goal fulfillment?
- Metrics – What specific measures are needed to answer the questions posed?
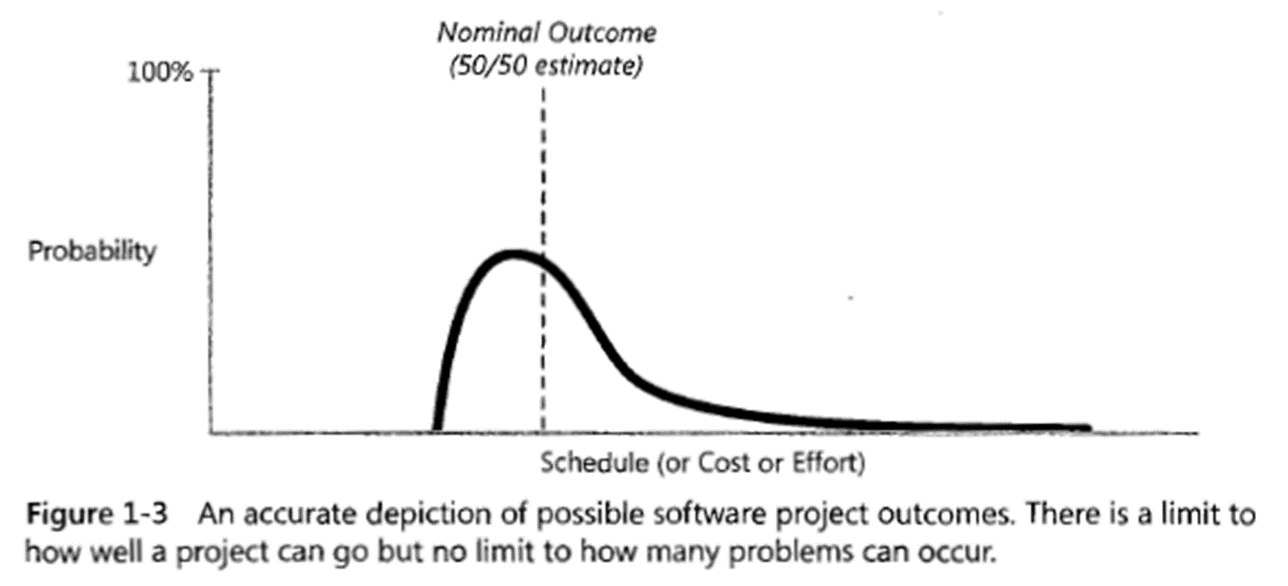
Probability distribution of an estimate
With every project estimate there is an associated probability of the estimate accurately predicting the outcome of the project.
Single-point estimates aren’t very useful.
Cone of Uncertainty– by phase
3.3 Software Size Metrics
Size Metrics
- Lines of Code (LOC).
- Function Points.
- Stories, Use cases, Features.
- Functions, subroutines.
- Database Tables.
LOC
limitations:
- need a counting standard.
- language dependent.
- hard to visualize early in a project.
- does not account for complexity or environmental factors.
- encourages verbose coding
Source Lines of Code (SLOC)
Function Points (FP)
- External Inputs (EI) and External Outputs (EO)
- User Interactions / External Query (EQ)
- External Interfaces / External Interface File (EIF)
- Files used by the system / Internal Logical File (ILF)
FP = CFP x (0.65 + 0.01 x RCAF)
FPs can be used to estimate LOC depending on the average number of LOC per FP for a given language.
3.4 Software Productivity
- Real-time embedded systems, 40~160 LOC/P-month.
- Systems programs, 150~400 LOC/P-month.
- Commercial applications, 200~900 LOC/P-month.
- In Object Points, productivity has been measured between
4 ~50 object points/month depending on tool support and developer capability.
3.5 Software Cost Estimation
- Algorithmic cost modelling
- Expert judgement
- Estimation by analogy
- Parkinson's law
- Pricing to win
Algorithmic cost modelling
Effort = A * SizeB * M
- A is an organization-dependent constant
- B reflects the disproportionate effort for large projects
- M is a multiplier reflecting product, process and people
attributes.

 浙公网安备 33010602011771号