小程序加入echart 图表
github上的地址 https://github.com/ecomfe/echarts-for-weixin
复制 到当前项目根目录下
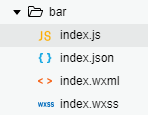
添加展示bar图表例子的文件夹
index.json 中配置使用的组件,以及组件的位置
这一配置的作用是,允许我们在 pages/bar/index.wxml 中使用 <ec-canvas> 组件。注意路径的相对位置要写对
{
  "usingComponents": {
    "ec-canvas": "../../ec-canvas/ec-canvas"
  }
}
index.wxml 使用 <ec-canvas> 组件
<view class="container">
  <ec-canvas id="mychart-dom-bar" canvas-id="mychart-bar" ec="{{ ec }}" bind:init="echartInit"></ec-canvas>
</view>
注意此处的.container,新建小程序项目后,其中app.wxss中默认自动生成的此 class ,修改成如下
.container {
  position: absolute;
  top: 0;
  bottom: 0;
  left: 0;
  right: 0;

  display: flex;
  flex-direction: column;
  align-items: center;
  justify-content: space-between;
  box-sizing: border-box;
}
在index.js中写的echartInit方法进行初始化
import * as echarts from '../../ec-canvas/echarts';
function initChart(canvas, width, height) {
  const chart = echarts.init(canvas, null, {
    width: width,
    height: height
  });
  canvas.setChart(chart);

  var option = {
    ...
  };
  chart.setOption(option);
  return chart;
}

Page({
  data: {
    ec: {
      //onInit: initChart,如果在wxml中没有写bind:init方法,就直接这样用
    }
  },
 echartInit (e) {
    initChart(e.detail.canvas, e.detail.width, e.detail.height);
  }
});
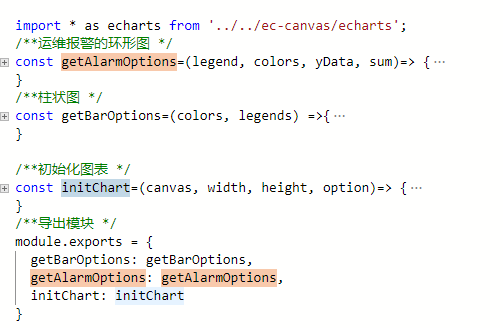
进行封装改写
在utils中封装图表的方法
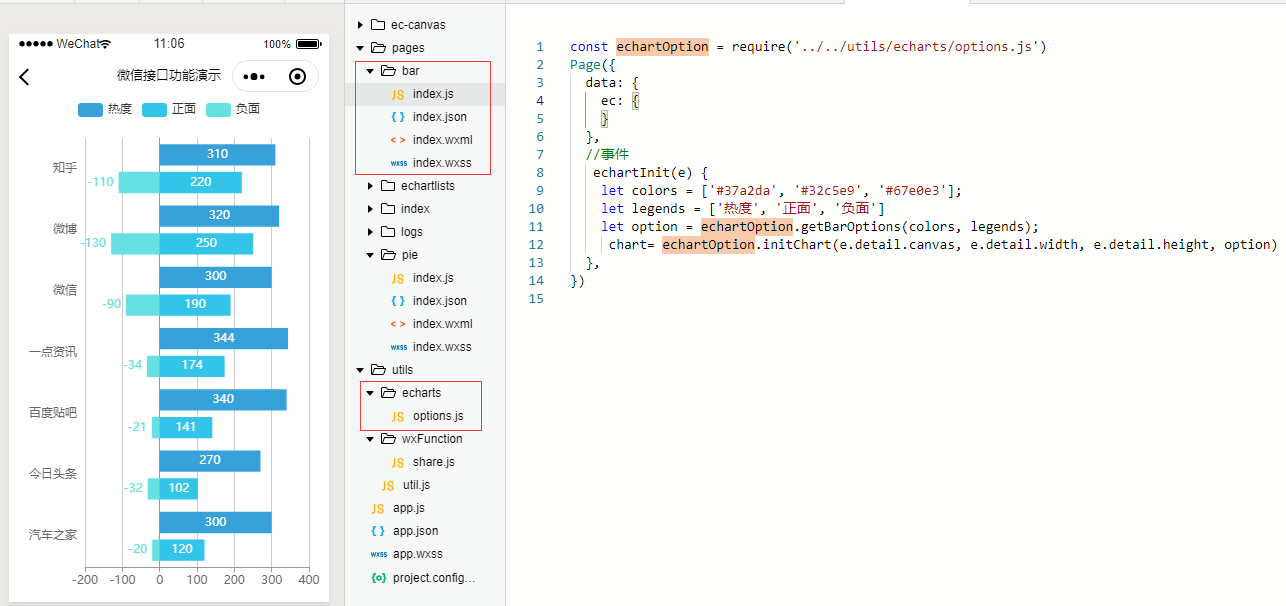
在index.js中的使用
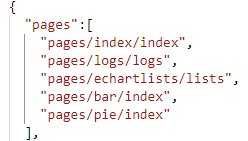
当然在使用页面前。都需要在app.json里面声明页面地址才能使用
了解到一个参数data-record="{{recordData}}",就是可以在echartInit 方法中找到data里面的recordData的数据
 echartInit(e) {
       console.log(e);
       let recordData=e.target.dataset.record;
        initChart(e.detail.canvas, e.detail.width, e.detail.height,recordData);
    },

 浙公网安备 33010602011771号