options = {
radar: {
shape: "circle",
radius: 60,
nameGap: 8,
splitNumber: 5,
indicator: [
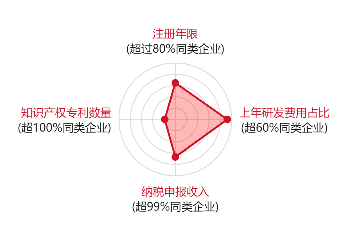
{ name: "注册年限", replenish: "超过80%同类企业", max: 6500 },
{
name: "知识产权专利数量",
replenish: "超100%同类企业",
max: 16000,
},
{ name: "纳税申报收入", replenish: "超99%同类企业", max: 30000 },
{
name: "上年研发费用占比",
replenish: "超60%同类企业",
max: 38000,
},
],
axisLine: {
lineStyle: {
color: "#DADADA",
},
},
splitLine: {
lineStyle: {
color: "#DADADA",
},
},
splitArea: {
areaStyle: {
color: [],
},
},
axisName: {
formatter: function (val, data) {
return `{a|${val}}` + "\n" + `{b|(${data.replenish})}`;
},
rich: {
a: {
// fontWeight: "bold",
color: "#ce1327",
lineHeight: 20,
},
b: {
align: "center",
// fontWeight: "bold",
color: "#151515",
},
},
},
},
series: [
{
type: "radar",
data: [
{
value: [4201, 3000, 20000, 35005],
name: "Allocated Budget",
},
],
areaStyle: {
color: "rgba(255, 0, 0, 0.4)",
},
lineStyle: {
color: "#ce1327",
width: 2,
},
itemStyle: {
normal: {
color: "#ce1327",
},
},
},
],
}


 浙公网安备 33010602011771号