ab (ApacheBench)命令
ab (ApacheBench)命令
参数
-n 在测试会话中所执行的请求个数。默认时,仅执行一个请求
-c 一次产生的请求个数。默认是一次一个
-t 测试所进行的最大秒数
-k 启用HTTP KeepAlive功能,则在一个HTTP会话中执行多个请求
-v 设置显示信息的详细程度
ab [options] [http://]hostname[:port]/path
如: ab -n 1000 -c 100 -k http://www.cnblogs.com/jincon/archive.html
Concurrency Level
并发的用户数
Time taken for tests
所有请求被处理完成所花费的时间总和
Complete requests
总请求数
Failed requests
失败的请求总数
Requests per second
吞吐率=Complete requests / Time taken for tests
Time per request
用户平均请求等待时间=Time taken for tests /(Complete requests / Concurrency Level)
Time per request
服务器平均请求处理时间=Time taken for tests / Complete requests
Transfer rate
请求单位时间内获取的数据长度
GnuPlot
安装GnuPlot
yum install GnuPlot
apt-get install GnuPlot
首先,使用ab 测试性能,并将测试结果写入ab_500_100.dat文件
ab -n 500 -c 100 -g ./ab_500_100.dat -k http://localhost/index.php
gnuplot文件内容格式如下
starttime   seconds ctime   dtime   ttime   wait

Mon Jan 27 21:03:02 2014    1390827782  89  503 592 28

Mon Jan 27 21:03:02 2014    1390827782  84  591 676 24
ctime:connection time
dtime: processing time
ttime: total time, = connection time + processing time
wait:wait time
dtime: processing time
ttime: total time, = connection time + processing time
wait:wait time
然后,根据导出的gnuplot文件绘制图表,绘制脚本如下
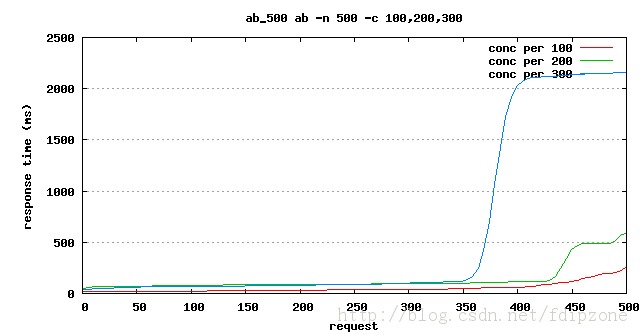
# 设定输出图片的格式
set terminal png

# 设定输出的图片文件名
set output "ab_500.png"

# 图表的标题
set title "ab_500 ab -n 500 -c 100,200,300"

# 设定图表的X轴和Y轴缩放比例(相当于调整图片的纵横比例,方形的不好看啊)
set size 1,0.7

# 设定以Y轴数据为基准绘制栅格(就是示例图表中的横向虚线)
set grid y

# X轴标题
set xlabel "request"

# Y轴标题
set ylabel "response time (ms)"

# 设定plot的数据文件,曲线风格和图例名称,以第九列数据ttime为基准数据绘图

plot "ab_500_100.dat" using 9 smooth sbezier with lines title "conc per 100",

"ab_500_200.dat" using 9 smooth sbezier with lines title "conc per 200",

"ab_500_300.dat" using 9 smooth sbezier with lines title "conc per 300"


gnuplot> plot "test.dat" u 7 with lines title "ctime",\

>"test.dat" u 8 with lines title "dtime",\

>"test.dat" u 9 with lines title "ttime",\

>"test.dat" u 10 with lines title "wait"
参数说明:
set size 1,0.7 缩放比例,前面是X轴,后面是Y轴, (0, 1]的一个浮点数,1为原始值
using 9 表示用哪一列数据绘图,数字是数据行按照空格或制表符分割的字段数字索引,从1开始
smooth sbezier plot提供的一些数据填充算法以保证线条平滑度的,包含如下选项:smooth {unique | csplines | acsplines | bezier | sbezier},更详细解释请参考官方文档
with lines title "xxx" 这个会再右上角生成一个图例,用于区分什么颜色的线条是哪一项数据
生成的图表如下:

 浙公网安备 33010602011771号