QwtPlot3D绘制三维曲线,一条多条都可
QwtPlot3D版本:0.2.7
QT版本:5.12.11
编译器:Mingw64
参考:https://www.cnblogs.com/ybqjymy/p/13395533.html
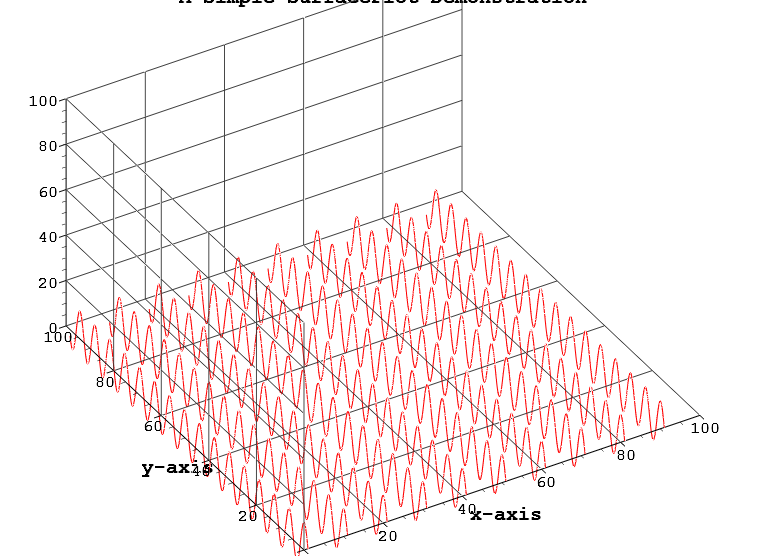
先展示一下效果吧:我在空间内绘制了多条正弦曲线
正文开始:
step1:修改qwtplot3d的源码,添加Line3D这一空间基础
首先在qwt3d_enrichment_std.h中添加如下代码段
 1 class QWT3D_EXPORT Line3D : public VertexEnrichment{
 2 public:
 3     Line3D();
 4     Line3D(double thick,bool smooth=true);
 5     Qwt3D::Enrichment* clone() const {return new Line3D(*this);}
 6
 7     void configure(double thick, bool smooth);
 8     void drawBegin();
 9     void drawBegin(int type);
10     void drawEnd();
11     virtual void draw(Qwt3D::Triple const&);
12     virtual void draw();
13
14     virtual void clear();
15     virtual void add(Qwt3D::Triple const & t);
16     virtual void setLineColor(RGBA color);
17     void setLineSize(int nLineSize);//数据的长度
18 private:
19     bool _smooth;
20     double _thick;
21     GLboolean oldstate_;
22     23     std::vector<Qwt3D::Triple> Linedata;
24     RGBA rgba;
25 };
然后在其对应的cpp内实现该类:
Qwt3D::Line3D::Line3D(){
    rgba.a = 1;
    rgba.b = 0.3;
    rgba.r = 0.6;
    rgba.g = 1;
}
Qwt3D::Line3D::Line3D(double t,bool smo){
    rgba.a = 1;
    rgba.b = 0.3;
    rgba.r = 0.6;
    rgba.g = 1;
    _thick=t;
    _smooth=smo;
}
void Qwt3D::Line3D::clear(){
    Linedata.clear();
}

void Qwt3D::Line3D::configure(double thick, bool smooth)
{
    _thick = thick;
    _smooth  = smooth;

}
void Qwt3D::Line3D::drawBegin()
{
    setDeviceLineWidth(_thick);
    oldstate_ = glIsEnabled(GL_LINE_SMOOTH);
    if (_smooth)
        glEnable(GL_LINE_SMOOTH);
    else
        glDisable(GL_LINE_SMOOTH);
    //glPointSize(10);
    glBegin( GL_LINE_STRIP);
}
void Qwt3D::Line3D::drawBegin(int type)
{
    setDeviceLineWidth(_thick);
    oldstate_ = glIsEnabled(GL_LINE_SMOOTH);
    if (_smooth)
        glEnable(GL_LINE_SMOOTH);
    else
        glDisable(GL_LINE_SMOOTH);
    //glPointSize(10);
    glBegin( type);
}
void Qwt3D::Line3D::drawEnd()
{
    glEnd();
    if (oldstate_)
        glEnable(GL_LINE_SMOOTH);
    else
        glDisable(GL_LINE_SMOOTH);
}
void Qwt3D::Line3D::draw(Qwt3D::Triple const& pos)
{
    glColor4d(rgba.r,rgba.g,rgba.b,rgba.a);
    glVertex3d(pos.x,pos.y,pos.z);
}
void Qwt3D::Line3D::draw()
{
    for (int i = 0; i < Linedata.size(); i ++)
    {
        //RGBA rgba = getColor(i);
        //glColor4d(rgba.r,rgba.g,rgba.b,rgba.a);

        draw(Linedata[i]);
    }
}

void Qwt3D::Line3D::add(const Qwt3D::Triple &t)
{
    Linedata.push_back(t);
}
void Qwt3D::Line3D::setLineColor(RGBA color)
{
   this->rgba = color;
}
随后修改qwt3d_plot.h,使之支持line3D,
//在public域内添加如下代码,重载函数,增加两种数据类型,其实只要后者即可
void updateData(Line3D& p);
void updateData(std::vector<Line3D> &data);
//在protected域内添加如下代码
virtual void createData(Line3D& p ) = 0;
virtual void createData(std::vector<Line3D> &P ) = 0;
在qwt3d_plot.cpp中添加如下代码段:
void Plot3D::updateData(Line3D& p)
{
    makeCurrent();
  GLStateBewarer dt(GL_DEPTH_TEST, true);
    GLStateBewarer ls(GL_LINE_SMOOTH, true);

    calculateHull();

    SaveGlDeleteLists(displaylists_p[DataObject], 1); // nur Daten

    displaylists_p[DataObject] = glGenLists(1);
    glNewList(displaylists_p[DataObject], GL_COMPILE);

  //this->createEnrichments();
    this->createData(p);

    glEndList();
}
void Plot3D::updateData(std::vector<Line3D> &data)
{
    makeCurrent();
  GLStateBewarer dt(GL_DEPTH_TEST, true);
    GLStateBewarer ls(GL_LINE_SMOOTH, true);

    calculateHull();

    SaveGlDeleteLists(displaylists_p[DataObject], 1); // nur Daten

    displaylists_p[DataObject] = glGenLists(1);
    glNewList(displaylists_p[DataObject], GL_COMPILE);

  //this->createEnrichments();
    this->createData(data);

    glEndList();
}
接下来在qwt3d_surfaceplot.h中添加如下代码
注:createDataG的实现在qwt3d_gridplot.cpp中
protected:
    void createLines(Line3D &p);
    virtual void createData(Line3D& p);
    virtual void createData(std::vector<Line3D> & p);
private:
    virtual void createDataG(Line3D& p);
    virtual void createDataG(std::vector<Line3D> & p);
然后在qwt3d_surfaceplot.cpp中实现:
void SurfacePlot::createData(Line3D& p)
{

    createDataG(p);
}
void SurfacePlot::createData(std::vector<Line3D>&p)
{
    createDataG(p);
}
void SurfacePlot::createLines(Line3D& p)
{
    if (!actualData_p)
        return;
    if (p.type() != Enrichment::VERTEXENRICHMENT)
        return;

    p.assign(*this);
    p.drawBegin();

    VertexEnrichment* ve = (VertexEnrichment*)&p;
    if (plotStyle() == Qwt3D::LINE3D_STYLE)
    {
        p.draw();
    }
    p.drawEnd();

}
void SurfacePlot::createDataG(std::vector<Line3D>&p){
    createFloorData();

    if (plotStyle() == NOPLOT)
          return;

      int i, j;
      RGBA col;
      int step = resolution();

    if (plotStyle() == Qwt3D::POINTS)
    {
      createPoints();
      return;
    }
    else if (plotStyle() == Qwt3D::USER)
    {
      if (userplotstyle_p)
        createEnrichment(*userplotstyle_p);
      return;
    }
    else if(plotStyle() == Qwt3D::LINE3D_STYLE)
    {
        for(auto &line :p){
        createLines(line);
        }
        return;

    }

      setDeviceLineWidth(meshLineWidth());

    GLStateBewarer sb(GL_POLYGON_OFFSET_FILL,true);
      setDevicePolygonOffset(polygonOffset(),1.0);

      GLStateBewarer sb2(GL_LINE_SMOOTH, smoothDataMesh());
      glBlendFunc(GL_SRC_ALPHA, GL_ONE_MINUS_SRC_ALPHA);


    int lastcol =  actualDataG_->columns();
    int lastrow =  actualDataG_->rows();

      if (plotStyle() != WIREFRAME)
      {
          glPolygonMode(GL_FRONT_AND_BACK, GL_QUADS);

          bool hl = (plotStyle() == HIDDENLINE);
          if (hl)
          {
              col = backgroundRGBAColor();
              glColor4d(col.r, col.g, col.b, col.a);
          }

          for (i = 0; i < lastcol - step; i += step)
          {
            glBegin(GL_TRIANGLE_STRIP);
                  setColorFromVertexG(i, 0, hl);
                  glNormal3dv(actualDataG_->normals[i][0]);
                  glVertex3dv(actualDataG_->vertices[i][0]);

                  setColorFromVertexG(i+step, 0, hl);
                  glNormal3dv(actualDataG_->normals[i+step][0]);
                  glVertex3dv(actualDataG_->vertices[i+step][0]);

                  for (j = 0; j < lastrow - step; j += step)
                  {
                      setColorFromVertexG(i,j+step, hl);
                      glNormal3dv(actualDataG_->normals[i][j+step]);
                      glVertex3dv(actualDataG_->vertices[i][j+step]);

                      setColorFromVertexG(i+step, j+step, hl);
                      glNormal3dv(actualDataG_->normals[i+step][j+step]);
                      glVertex3dv(actualDataG_->vertices[i+step][j+step]);
                  }
              glEnd();
          }
    }

      if (plotStyle() == FILLEDMESH || plotStyle() == WIREFRAME || plotStyle() == HIDDENLINE)
      {
          glColor4d(meshColor().r, meshColor().g, meshColor().b, meshColor().a);

          if (step < actualDataG_->columns() && step < actualDataG_->rows())
          {
              glBegin(GL_LINE_LOOP);
                  for (i = 0; i < actualDataG_->columns() - step; i += step)
                      glVertex3dv(actualDataG_->vertices[i][0]);
                  for (j = 0; j < actualDataG_->rows() - step; j += step)
                      glVertex3dv(actualDataG_->vertices[i][j]);
                  for (; i >= 0; i -= step)
                      glVertex3dv(actualDataG_->vertices[i][j]);
                  for (; j >= 0; j -= step)
                      glVertex3dv(actualDataG_->vertices[0][j]);
              glEnd();
          }

          // weaving
          for (i = step; i < actualDataG_->columns() - step; i += step)
          {
              glBegin(GL_LINE_STRIP);
                  for (j = 0; j < actualDataG_->rows(); j += step)
                      glVertex3dv(actualDataG_->vertices[i][j]);
              glEnd();
          }
          for (j = step; j < actualDataG_->rows() - step; j += step)
          {
              glBegin(GL_LINE_STRIP);
                  for (i = 0; i < actualDataG_->columns(); i += step)
                      glVertex3dv(actualDataG_->vertices[i][j]);
              glEnd();
          }
      }
}
void SurfacePlot::createDataG(Line3D& p)
{
  createFloorData();

  if (plotStyle() == NOPLOT)
        return;

    int i, j;
    RGBA col;
    int step = resolution();

  if (plotStyle() == Qwt3D::POINTS)
  {
    createPoints();
    return;
  }
  else if (plotStyle() == Qwt3D::USER)
  {
    if (userplotstyle_p)
      createEnrichment(*userplotstyle_p);
    return;
  }
  else if(plotStyle() == Qwt3D::LINE3D_STYLE)
  {
      createLines(p);
      return;

  }

    setDeviceLineWidth(meshLineWidth());

  GLStateBewarer sb(GL_POLYGON_OFFSET_FILL,true);
    setDevicePolygonOffset(polygonOffset(),1.0);

    GLStateBewarer sb2(GL_LINE_SMOOTH, smoothDataMesh());
    glBlendFunc(GL_SRC_ALPHA, GL_ONE_MINUS_SRC_ALPHA);


  int lastcol =  actualDataG_->columns();
  int lastrow =  actualDataG_->rows();

    if (plotStyle() != WIREFRAME)
    {
        glPolygonMode(GL_FRONT_AND_BACK, GL_QUADS);

        bool hl = (plotStyle() == HIDDENLINE);
        if (hl)
        {
            col = backgroundRGBAColor();
            glColor4d(col.r, col.g, col.b, col.a);
        }

        for (i = 0; i < lastcol - step; i += step)
        {
          glBegin(GL_TRIANGLE_STRIP);
                setColorFromVertexG(i, 0, hl);
                glNormal3dv(actualDataG_->normals[i][0]);
                glVertex3dv(actualDataG_->vertices[i][0]);

                setColorFromVertexG(i+step, 0, hl);
                glNormal3dv(actualDataG_->normals[i+step][0]);
                glVertex3dv(actualDataG_->vertices[i+step][0]);

                for (j = 0; j < lastrow - step; j += step)
                {
                    setColorFromVertexG(i,j+step, hl);
                    glNormal3dv(actualDataG_->normals[i][j+step]);
                    glVertex3dv(actualDataG_->vertices[i][j+step]);

                    setColorFromVertexG(i+step, j+step, hl);
                    glNormal3dv(actualDataG_->normals[i+step][j+step]);
                    glVertex3dv(actualDataG_->vertices[i+step][j+step]);
                }
            glEnd();
        }
  }

    if (plotStyle() == FILLEDMESH || plotStyle() == WIREFRAME || plotStyle() == HIDDENLINE)
    {
        glColor4d(meshColor().r, meshColor().g, meshColor().b, meshColor().a);

        if (step < actualDataG_->columns() && step < actualDataG_->rows())
        {
            glBegin(GL_LINE_LOOP);
                for (i = 0; i < actualDataG_->columns() - step; i += step)
                    glVertex3dv(actualDataG_->vertices[i][0]);
                for (j = 0; j < actualDataG_->rows() - step; j += step)
                    glVertex3dv(actualDataG_->vertices[i][j]);
                for (; i >= 0; i -= step)
                    glVertex3dv(actualDataG_->vertices[i][j]);
                for (; j >= 0; j -= step)
                    glVertex3dv(actualDataG_->vertices[0][j]);
            glEnd();
        }

        // weaving
        for (i = step; i < actualDataG_->columns() - step; i += step)
        {
            glBegin(GL_LINE_STRIP);
                for (j = 0; j < actualDataG_->rows(); j += step)
                    glVertex3dv(actualDataG_->vertices[i][j]);
            glEnd();
        }
        for (j = step; j < actualDataG_->rows() - step; j += step)
        {
            glBegin(GL_LINE_STRIP);
                for (i = 0; i < actualDataG_->columns(); i += step)
                    glVertex3dv(actualDataG_->vertices[i][j]);
            glEnd();
        }
    }
}
接下来我们还要在qwt3d_types.h中注册我们新加的Line3D类
//修改这个结构体即可
enum PLOTSTYLE
{
    NOPLOT     , //!< No visible data
    WIREFRAME  , //!< Wireframe style
    HIDDENLINE , //!< Hidden Line style
    FILLED     , //!< Color filled polygons w/o edges
    FILLEDMESH , //!< Color filled polygons w/ separately colored
    edges
    POINTS     , //!< User defined style (used by Enrichments)
    USER       ,  //!< User defined style (used by Enrichments)
    LINE3D_STYLE
};
到此,我们对源码的修改就完成,接下来对源码进行编译,然后配置dll和lib的过程就不再赘述。
最后贴一下demo的代码,通过修改官方示例中的simpleplot得来:
//-----------------------------------------------------------------
//              simpleplot.cpp
//
//      A simple example which shows how to use SurfacePlot
//-----------------------------------------------------------------

#include <math.h>
#include <qapplication.h>
#include <qwt3d_surfaceplot.h>
#include <qwt3d_function.h>


using namespace Qwt3D;

class Rosenbrock : public Function
{
public:

  Rosenbrock(SurfacePlot& pw)
  :Function(pw)
  {
  }

  double operator()(double x, double y)
  {
    return 2*x*y;//在画空间曲线的时候不重要,这个函数关系其实控制了空间曲面
  }
};


class Plot : public SurfacePlot
{
public:
    Plot();
};


Plot::Plot()
{
  setTitle("A Simple SurfacePlot Demonstration");
  setPlotStyle(Qwt3D::LINE3D_STYLE);
  Rosenbrock rosenbrock(*this);
  rosenbrock.setMesh(5,5);
  rosenbrock.setDomain(0,100,0,100);
  rosenbrock.setMinZ(0);
  rosenbrock.setMaxZ(100);
  rosenbrock.create();

  coordinates()->setGridLines(true,false,Qwt3D::LEFT|Qwt3D::BACK|Qwt3D::FLOOR);
  for (unsigned i=0; i!=coordinates()->axes.size(); ++i)
  {
    coordinates()->axes[i].setMajors(7);
    coordinates()->axes[i].setMinors(4);
  }


  coordinates()->axes[X1].setLabelString("x-axis");
  coordinates()->axes[Y1].setLabelString("y-axis");
  coordinates()->axes[Z1].setLabelString("z-axis"); // Omega - see http://www.unicode.org/charts/


  setCoordinateStyle(FRAME);


  Qwt3D::Line3D _l3d;
  Qwt3D::Line3D *myLine1 = dynamic_cast<Qwt3D::Line3D *>(addEnrichment(_l3d));
  myLine1->configure(1,true);
  myLine1->setLineColor(Qwt3D::RGBA(1,0,0,1));
  std::vector<Line3D> data;
  double x,y,z;
  for(int k=1;k<100;k+=10){
      x=k;
      for(float i = 0; i < 100; i+=0.1)
      {
        y=i;
        z=10*sin(i);
        myLine1->add(Qwt3D::Triple(x,y,z));
      }
      data.push_back(*myLine1);
      myLine1->clear();
  }
  updateData(data);
  updateGL();
}

int main(int argc, char **argv)
{
    QApplication a(argc, argv);
    Plot plot;
#if QT_VERSION < 0x040000
    a.setMainWidget(&plot);
#endif
    plot.resize(800,600);
    plot.show();
    return a.exec();
}

 浙公网安备 33010602011771号