

using "code coverage coloring" to help debuging
When I tried to investigate a defect, usually the first thing that I want to verify is the “runtime” execution flow. And if the “runtime” flow didn’t match the “expected” flow, I would be very close to the root cause of a defect. However, sometimes it’s not very easy to tell the “real/runtime” execution flow (especially when you can’t attach your debugger to the target assembly, or when the defect can’t be reproduced stably). I used to add more debug info output to the logs to help me out, and sometimes it could be a very tedious and time-consuming process.
So, basically I need something like the “code coverage coloring” functionality, which is supported by VS UT. I want the assemblies (deployed in integration lab) to generate the code coverage automatically when the manual or automatic test is taken, and I need a UI to load the coverage result to show me which code line is executed during the test. Then, it would be much easier for me to find the “real” execution flow. A performance profiling tool (like AQtime) could definitely make it, but they are too “huge” for my simple requirements. All I need actually is only a lightweight tool which could instrument my assemblies, and make the instrumented assembles to output coverage information of line level. And, if the coverage information has the same structure as VS UT, I could use VS to open it.
MS doesn’t disappoint me, and all what I need are included by VS’s tool box:
vsinstr.exe will help to instrument binary, and vspercmd.exe will help to start and stop the profiling process.
If you have VS installed on your test machine, you already have them under the path(for VS2010)
C:\Program Files (x86)\Microsoft Visual Studio 10.0\Team Tools\Performance Tools.
If your test environment doesn’t have VS installed (like me), copy the executables and the depended dlls to your test machine. In my test box, all I need to copy is like bellow:

If you are not sure about the dependency of the executables, windbg could help you. Below is an example of all the dlls that vsinstr.exe need. 
Now, the last thing is, how to used the tools, and it’s as easy as I expected.
1.instrument you assembly, the “/coverage” option is a must
vsinstr.exe your_assembly /Coverage
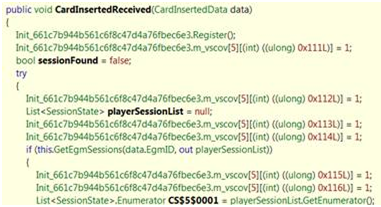
If you are interested, you can take a look at the instrumented result, like below:
3.Start the program which you want to test, and then do manual or automatic test as you need to
4.After your test is ended, shutdown the monitor
5.View the output coverage file by VS.

 浙公网安备 33010602011771号