
读书报告
numpy基本函数 scipy pandas
numpy的导入 使用用例
import numpy as np
import numpy as np
print np.random.rand(4,4)
>>> import numpy as np
#生成数据
>>> x=np.arange(10)
>>> x
array([0, 1, 2, 3, 4, 5, 6, 7, 8, 9])

#数据保存
>>> np.save('save_x',x)

#读取保存的数据
>>> np.load('save_x.npy')
array([0, 1, 2, 3, 4, 5, 6, 7, 8, 9])
scipy计算矩阵的逆
>>> arr = np.array([[1, 2], [3, 4]])
>>> iarr = linalg.inv(arr)
>>> iarr
array([[-2. ,  1. ],
       [ 1.5, -0.5]])
>>>np.allclose(np.dot(arr, iarr), np.eye(2))
pandas
import pandas as pd
import pandas

food_info = pandas.read_csv(file_name)
n_rows = food_info.head(n)
column_names = food_info.columns
dimensions = food_info.shape
数据加减乘除操作
div_1000 = food_info["Iron_(mg)"] / 1000 #对该列每一个数据进行除法操作
add_100 = food_info["Iron_(mg)"] + 100
sub_100 = food_info["Iron_(mg)"] - 100
mult_2 = food_info["Iron_(mg)"] * 2
# 两列数据对应元素做乘法
water_energy = food_info["Water_(g)"] * food_info["Energ_Kcal"]
matplotlib
抛物线y=x^2
x1=np.arange(-np.pi,np.pi,0.01)
y1=x1**2
plt.plot(x1,y1)
正弦曲线
x=np.linspace(-np.pi,np.pi,100)
y=np.sin(x)
plt.plot(x,y)
x = np.linspace(0, np.pi)
y_sin = np.sin(x)
y_cos = np.cos(x)

ax1.plot(x, y_sin)
ax2.plot(x, y_sin, 'go--', linewidth=2, markersize=12)
ax3.plot(x, y_cos, color='red', marker='+', linestyle='dashed')
#线
矩阵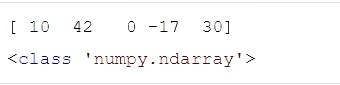
import numpy as np
ls1 = [10, 42, 0, -17, 30]
nd1 =np.array(ls1)
print(nd1)
print(type(nd1))
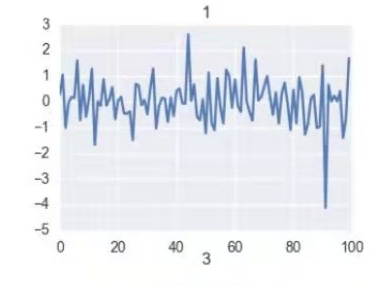
fig = plt.figure()
ax = fig.add_subplot(2, 2, 1)
y = np.random.randn(100)
plt.plot(y);
ax.set_title('1')

y = np.random.rand(5)
x = np.arange(5)
ax = fig.add_subplot(2, 2, 2)
plt.bar(x, y)
ax.set_title('2');

y = np.random.rand(5)
y = y / np.sum(y)
y[y < .05] = .05
ax = fig.add_subplot(2, 2, 3)
plt.pie(y)
ax.set_title('3')

plt.draw()
plt.show()

 浙公网安备 33010602011771号