1、kebelet日志收集配置
# 先将kubelet的日志传到文件中,这里使用创建service脚本的方式直接收集,日志按日期存储在/var/log/kubelet/下
# /etc/systemd/system/kubelet-log-collector.service
[Unit]
Description=Real-time collection of kubelet logs into daily files
After=network.target

[Service]
Type=simple
ExecStart=/bin/bash -c '\
  LOG_DIR="/var/log/kubelet"; \
  mkdir -p "$LOG_DIR"; \
  LOG_FILE="$LOG_DIR/kubelet-$(date +%%Y-%%m-%%d).log"; \
  HOSTNAME=$(hostname); \
  echo "Writing kubelet logs to $LOG_FILE"; \
  journalctl -u k8s-kubelet.service -f | while read line; do \
    echo "$HOSTNAME $line" >> "$LOG_FILE"; \
  done \
'
Restart=always
RestartSec=5

[Install]
WantedBy=multi-user.target


# 启动服务
systemctl daemon-reload
systemctl restart kubelet-log-collector.service
systemctl enable kubelet-log-collector.service
ls /var/log/kubelet/            # 看看有没有日志
# 日志格式
[root@beagle-01 beagle-log]# tail -n 5 /var/log/kubelet/kubelet-2025-12-12.log
beagle-01 Dec 12 19:06:10 beagle-01 kubelet[8979]: E1212 19:06:10.439540    8979 nestedpendingoperations.go:348] Operation for "{volumeName:kubernetes.io/nfs/3c9070cc-7676-4480-84ea-d1cb94b8d7e6-pvc-abac690a-b24c-4020-8427-02e258b6ffd4 podName:3c9070cc-7676-4480-84ea-d1cb94b8d7e6 nodeName:}" failed. No retries permitted until 2025-12-12 19:08:12.439523907 +0800 CST m=+29060.600625837 (durationBeforeRetry 2m2s). Error: MountVolume.SetUp failed for volume "pvc-abac690a-b24c-4020-8427-02e258b6ffd4" (UniqueName: "kubernetes.io/nfs/3c9070cc-7676-4480-84ea-d1cb94b8d7e6-pvc-abac690a-b24c-4020-8427-02e258b6ffd4") pod "dm-7b7747cfdf-wm24b" (UID: "3c9070cc-7676-4480-84ea-d1cb94b8d7e6") : mount failed: exit status 32
beagle-01 Dec 12 19:06:10 beagle-01 kubelet[8979]: Mounting command: mount
beagle-01 Dec 12 19:06:10 beagle-01 kubelet[8979]: Mounting arguments: -t nfs 10.0.0.105:/nfs/default-dm-pvc-pvc-abac690a-b24c-4020-8427-02e258b6ffd4 /var/lib/kubelet/pods/3c9070cc-7676-4480-84ea-d1cb94b8d7e6/volumes/kubernetes.io~nfs/pvc-abac690a-b24c-4020-8427-02e258b6ffd4
beagle-01 Dec 12 19:06:10 beagle-01 kubelet[8979]: Output: mount.nfs: mounting 10.0.0.105:/nfs/default-dm-pvc-pvc-abac690a-b24c-4020-8427-02e258b6ffd4 failed, reason given by server: No such file or directory
beagle-01 Dec 12 19:06:13 beagle-01 kubelet[8979]: E1212 19:06:13.896286    8979 pod_workers.go:1298] "Error syncing pod, skipping" err="unmounted volumes=[dm-pvc], unattached volumes=[], failed to process volumes=[]: context deadline exceeded" pod="default/dm-7b7747cfdf-wm24b" podUID="3c9070cc-7676-4480-84ea-d1cb94b8d7e6"


# kubelet-log.yaml  配置文件
apiVersion: loggie.io/v1beta1
kind: ClusterLogConfig
metadata:
  name: kubelet-log
spec:
  selector:
    type: node

  pipeline:
    name: kubelet-log
    sources: |
      - type: file
        name: kubelet
        paths:
          # 日志路径
          - /var/log/kubelet/*.log

    interceptors: |
      - type: transformer
        actions:
          # 提取主要字段
          - action: regex(body)
            # 下面这一条里面是正则,确认一下你的日志和这条正则是否能对应上,对不上的稍做修改就行,不要写的太复杂,很容易匹配不上
            pattern: '^(?P<nodeName>\S+)\s+(?P<logtime>\w{3}\s+\d{1,2}\s+\d{2}:\d{2}:\d{2})\s+(?P<host>\S+)\s+(?P<program>\S+)(?:\[(?P<pid>\d+)\])?:\s+(?P<raw>.*)$'
            ignoreError: true
          - action: regex(raw)
            pattern: '^\S+\s+\S+\s+\d+\s+(?P<info>.*)$'
            ignoreError: true

    sink: |
      type: elasticsearch
      hosts:
        - http://opensearch-cluster-master.beagle-monitoring:9200           # 填你的opensearch的svc地址
      index: "kubelet-log-${+YYYY.MM.DD}"

# 先不要apply文件,将opensearch-dashboard的Dev Tools打开
# 此处logtime提取的时间是默认的text类型,需要先将字段转换成时间类型,opensearch-dashboard才能将他作为时间轴使用,将下面配置粘贴到Dev Tools中
# 这个配置是将所有的kubelet-*的索引@timestamp字段映射为date类型
PUT _index_template/kubelet-template
{
  "index_patterns": ["kubelet-*"],                 # kubelet-*索引
  "template": {
    "settings": {
      "index.default_pipeline": "kubelet-ts"       # pipeline名称
    },
    "mappings": {
      "properties": {
        "@timestamp": { "type": "date" }           # 类型
      }
    }
  },
  "priority": 200
}
# 这个配置是自动将提取出来的logtime字段转换为opensearch能识别的时间字段,没有年份没有关系,会自动补上去
PUT _ingest/pipeline/kubelet-ts           # 绑定上面的pipeline
{
  "description": "Parse kubelet.log logtime -> @timestamp",
  "processors": [
    {
      "date": {
        "field": "logtime",                                       # 提取字段名
        "target_field": "@timestamp",                             # 转换的字段名
        "formats": ["MMM dd HH:mm:ss", "MMM  d HH:mm:ss"],        # 转换成的格式
        "timezone": "Asia/Shanghai",
        "on_failure": [
          { "set": { "field": "ts_parse_failed", "value": true } }
        ]
      }
    }
  ]
}

# 将上面的操作进行完后kubectl apply -f kubelet-log.yaml
# GET /kubelet-log-2025.12.12/_mapping         这个kubelet-log-2025.12.12是我自动生成的索引名,把日期改为你的,执行命令后能看见所有字段的类型,去确认@timestamp字段生成且时间类型为date

# 常用命令
GET /_cat/indices?v
GET /kubelet-log-2025.12.12
GET /kubelet-log-2025.12.12/_search?size=10
DELETE /kubelet*
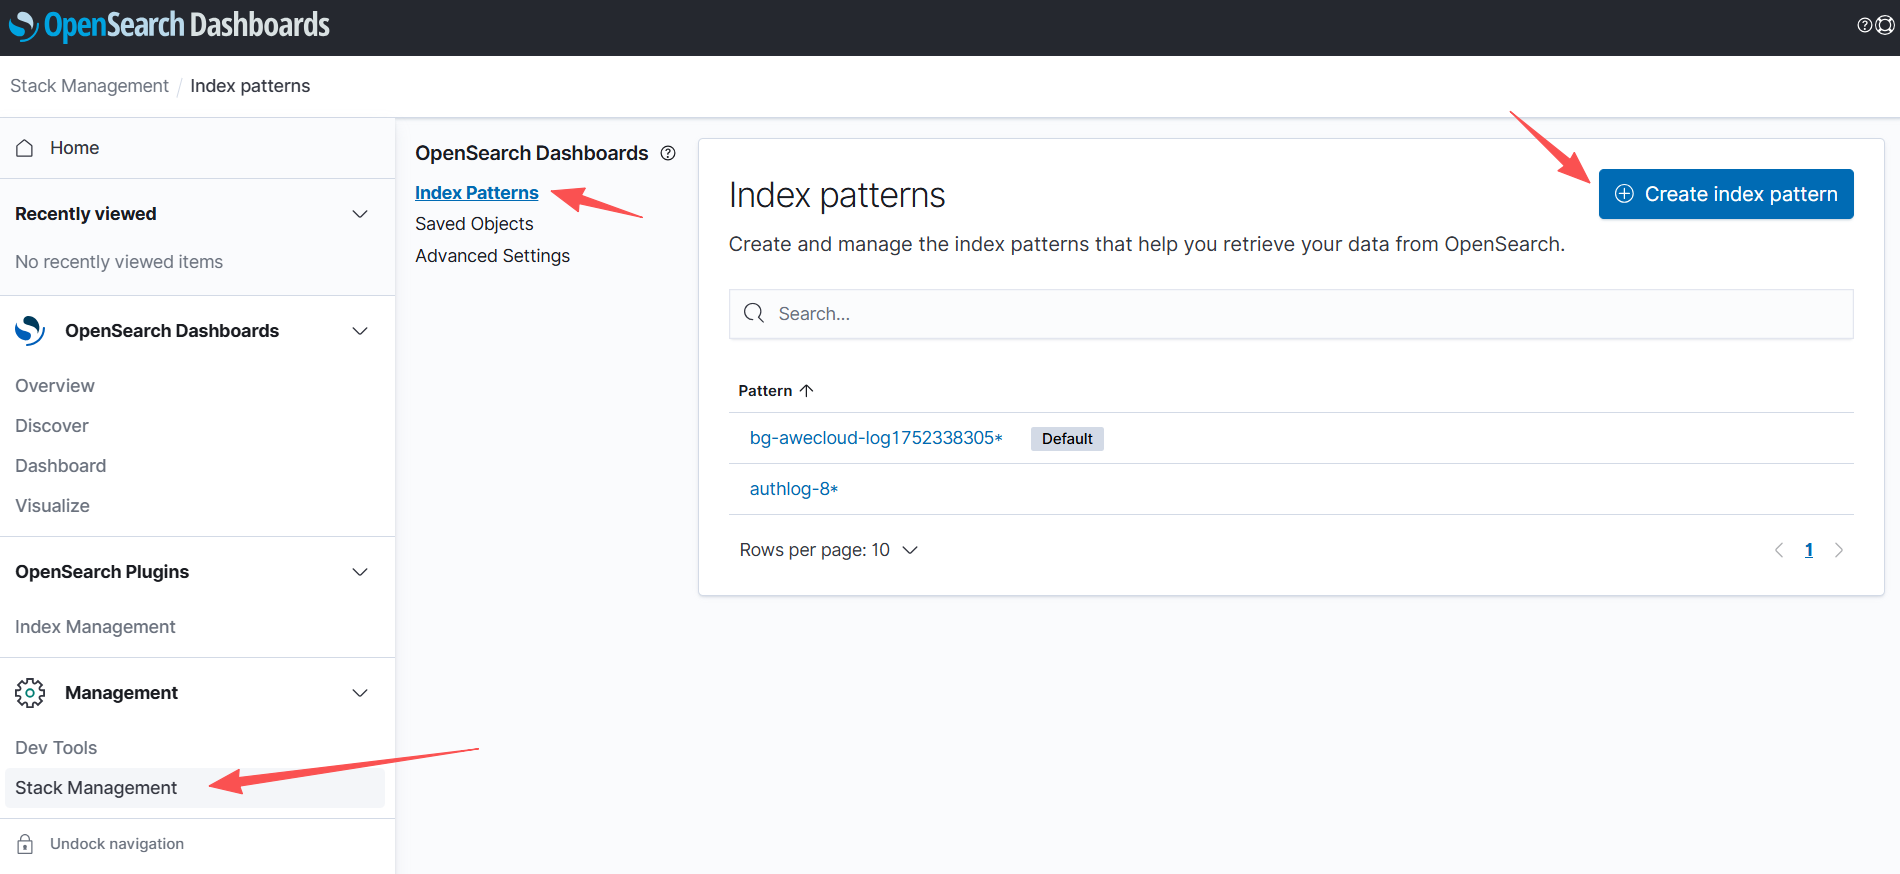
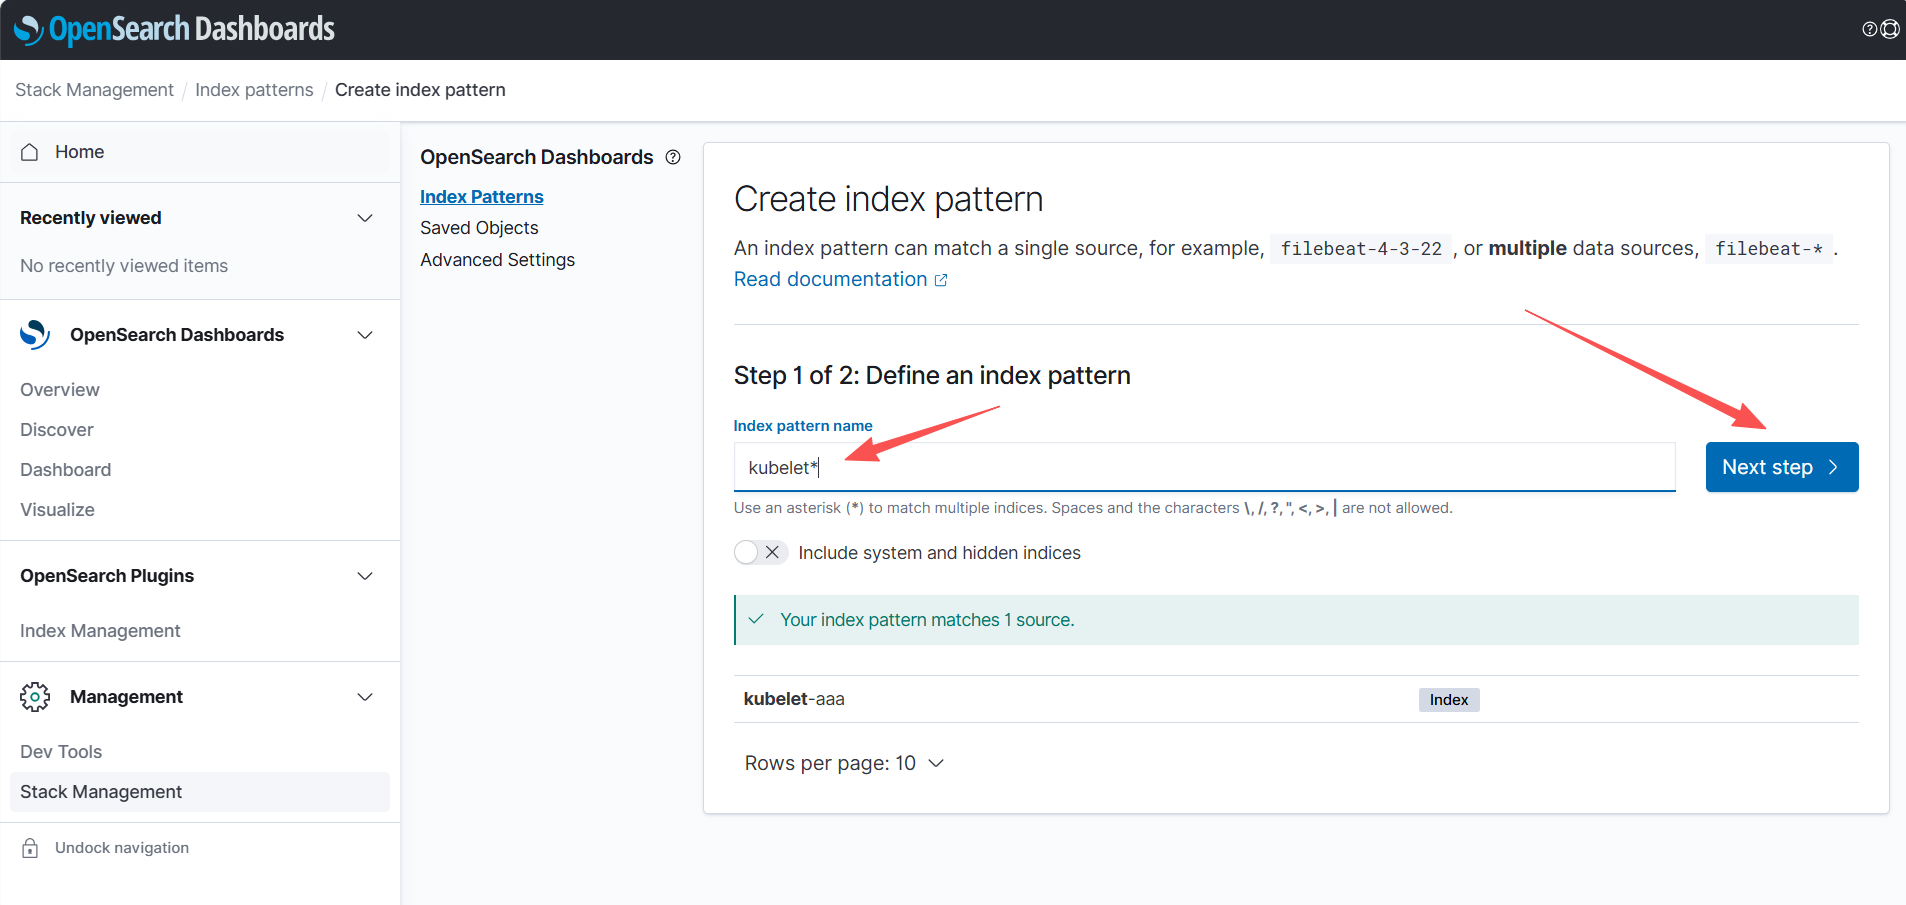
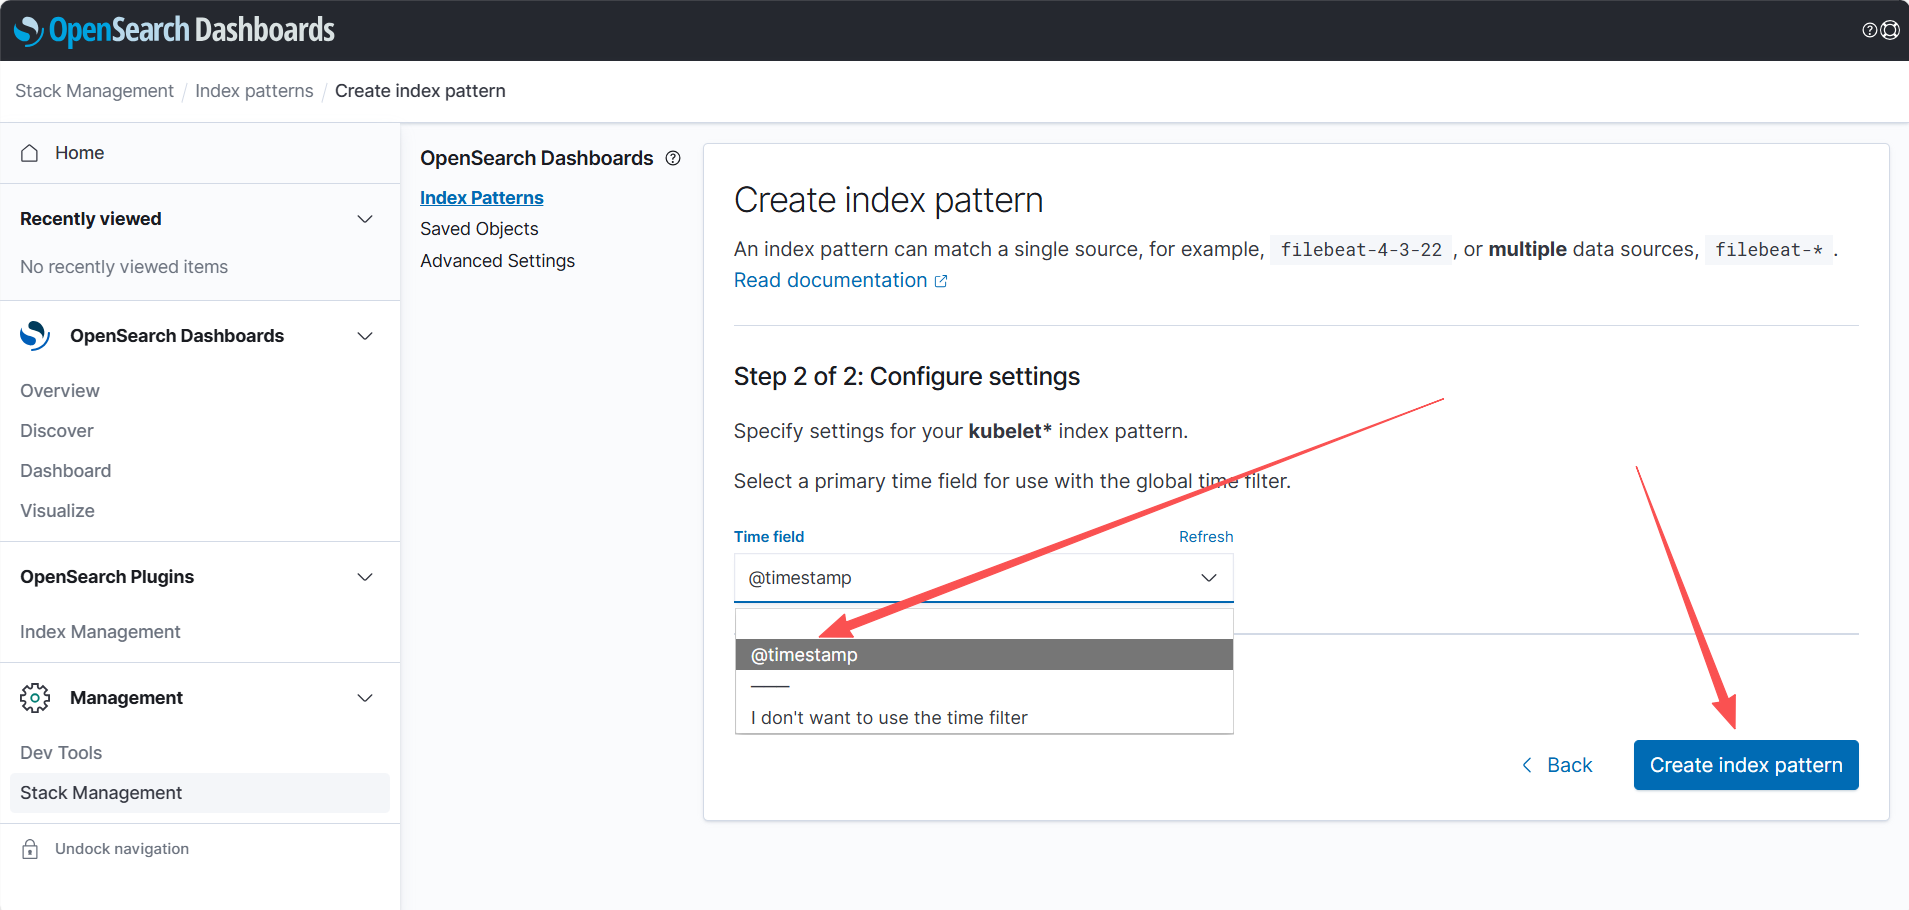
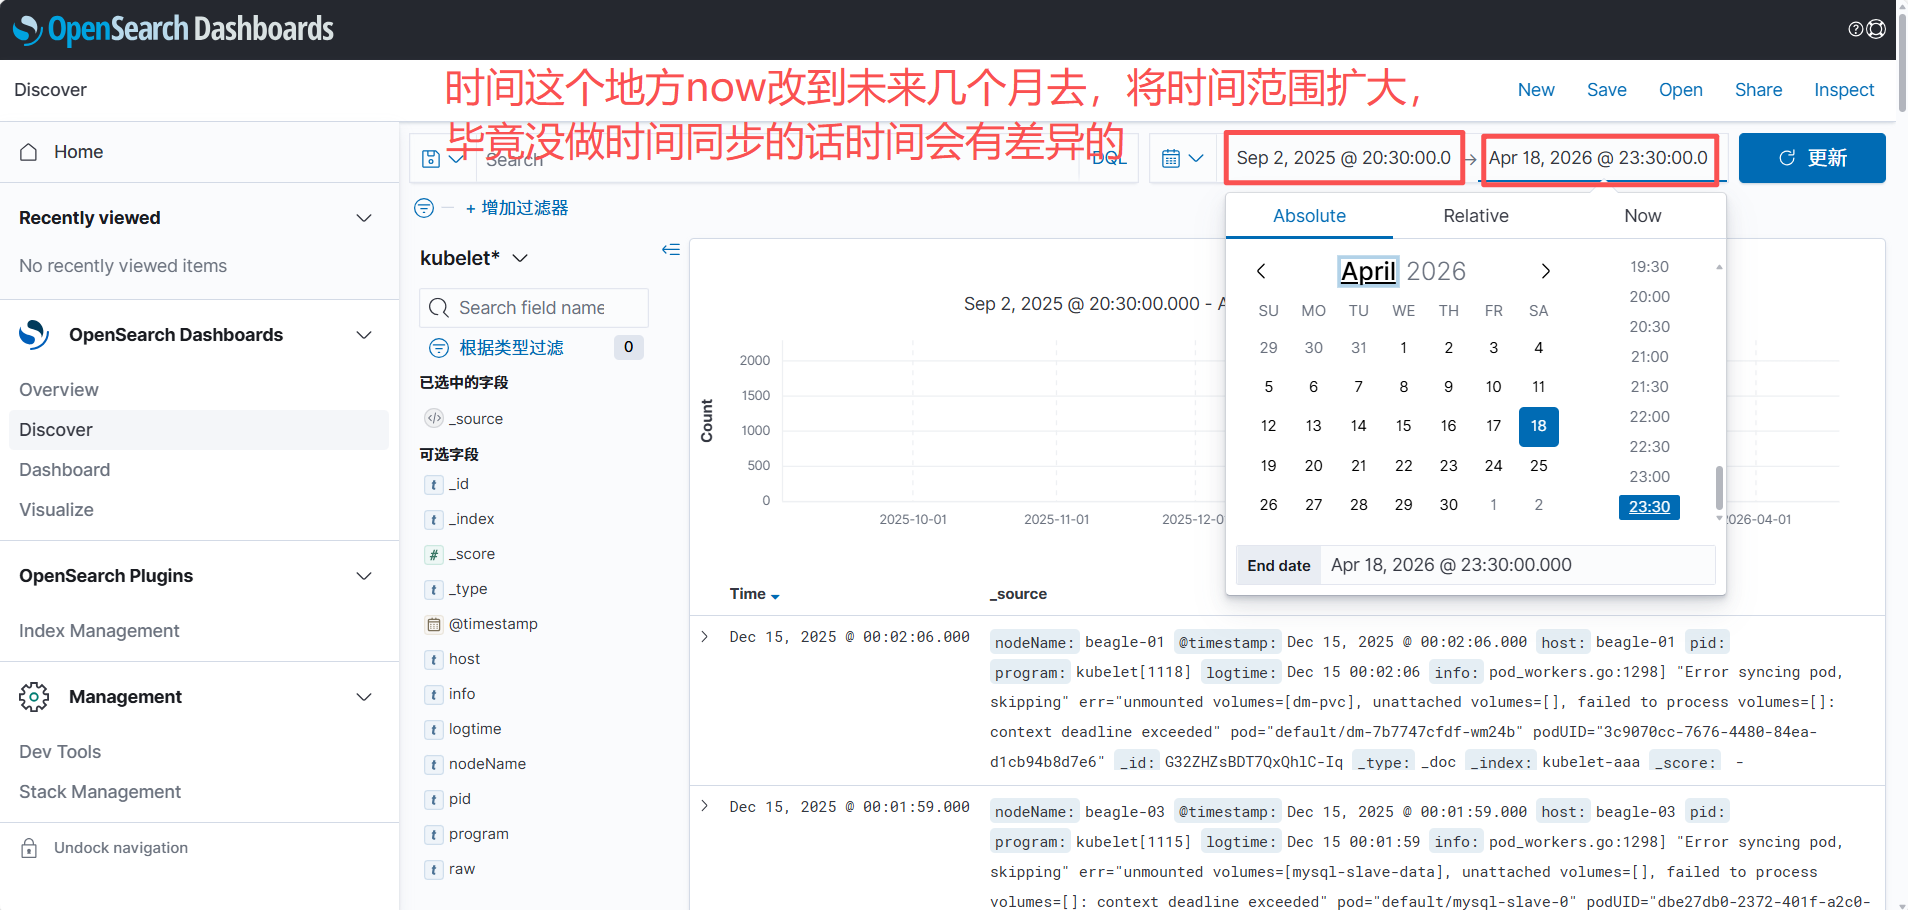
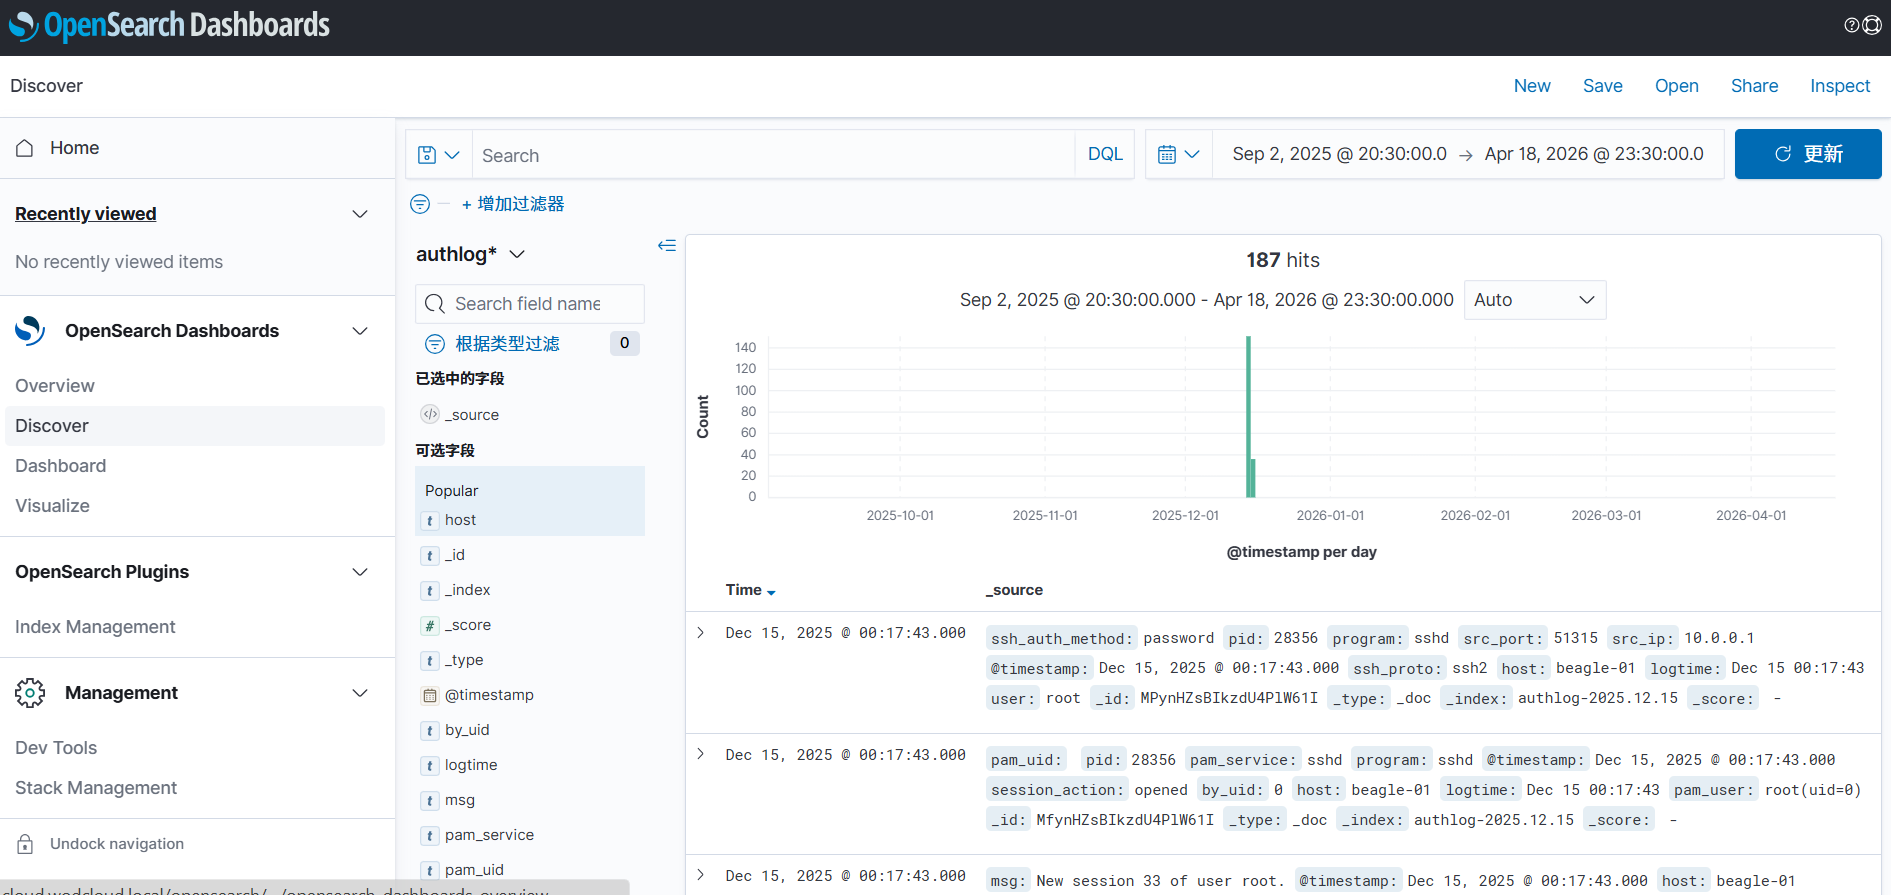
创建视图
2、auth登录日志收集配置
# auth.yaml
apiVersion: loggie.io/v1beta1
kind: ClusterLogConfig
metadata:
  name: authlog
spec:
  selector:
    type: node

  pipeline:
    name: authlog
    sources: |
      - type: file
        name: authlog
        paths:
          - /var/log/auth.log

    interceptors: |
      - type: transformer
        actions:
          # 1) 解析 syslog 头:Dec 10 17:00:52 ubt-server sshd[2252]: ...
          - action: regex(body)
            pattern: '^(?P<logtime>\w{3}\s+\d{1,2}\s+\d{2}:\d{2}:\d{2})\s+(?P<host>\S+)\s+(?P<program>[^\[:]+)(?:\[(?P<pid>\d+)\])?:\s+(?P<msg>.*)$'
            ignoreError: true

          # 2) 解析 sshd 登录成功:Accepted password for root from 10.0.0.1 port 59042 ssh2
          - action: regex(msg)
            pattern: '^Accepted\s+(?P<ssh_auth_method>\S+)\s+for\s+(?P<user>\S+)\s+from\s+(?P<src_ip>\d{1,3}(?:\.\d{1,3}){3})\s+port\s+(?P<src_port>\d+)\s+(?P<ssh_proto>\S+)$'
            ignoreError: true

          # 3) 解析 pam_unix session opened/closed(cron/sshd/systemd-user 都能匹配)
          - action: regex(msg)
            pattern: '^pam_unix\((?P<pam_service>[^:]+):session\):\s+session\s+(?P<session_action>opened|closed)\s+for\s+user\s+(?P<pam_user>\S+)(?:\(uid=(?P<pam_uid>\d+)\))?(?:\s+by\s+\(uid=(?P<by_uid>\d+)\))?.*$'
            ignoreError: true

    sink: |
      type: elasticsearch
      hosts:
        - http://opensearch-cluster-master.beagle-monitoring:9200
      index: "authlog-${+YYYY.MM.DD}"


# Dev Tools,和kubelet的配置查不多,都是为了转换时间字段
PUT _index_template/authlog-template
{
  "index_patterns": ["authlog-*"],
  "template": {
    "settings": {
      "index.default_pipeline": "authlog-ts"
    },
    "mappings": {
      "properties": {
        "@timestamp": { "type": "date" }
      }
    }
  },
  "priority": 200
}
PUT _ingest/pipeline/authlog-ts
{
  "description": "Parse authlog.log logtime -> @timestamp",
  "processors": [
    {
      "date": {
        "field": "logtime",
        "target_field": "@timestamp",
        "formats": ["MMM dd HH:mm:ss", "MMM  d HH:mm:ss"],
        "timezone": "Asia/Shanghai",
        "on_failure": [
          { "set": { "field": "ts_parse_failed", "value": true } }
        ]
      }
    }
  ]
}


# kubectl apply -f auth.yaml
# GET /authlog-2025.12.15/_mapping 和kubelet一样的检查方式,看@timestamp有没有变成时间类型,有的话再照着kubelet创建视图的步骤走一遍
3、syslog系统日志全收集配置
# syslog.yaml
apiVersion: loggie.io/v1beta1
kind: ClusterLogConfig
metadata:
  name: syslog
spec:
  selector:
    type: node

  pipeline:
    name: syslog
    sources: |
      - type: file
        name: syslog
        paths:
          - /var/log/syslog
          - /var/log/kern.log
          - /var/log/message
        ignoreOlder: 48h

    interceptors: |
      - type: rateLimit
        qps: 500
      - type: transformer
        actions:
          - action: regex(body)
            sys的日志很大,只取错误信息就行了
            pattern: '(?i)^(?P<logtime>\w{3}\s+\d{1,2}\s+\d{2}:\d{2}:\d{2})\s+(?P<host>\S+)\s+(?P<raw>.*error.*|.*errors.*|.*fail.*|.*failed.*|.*panic.*|.*oom.*|.*oom-kill.*|.*watchdog.*|.*soft lockup.*|.*i/o error.*|.*acpi.*)$'
            ignoreError: true

    sink: |
      type: elasticsearch
      hosts:
        - http://opensearch-cluster-master.beagle-monitoring:9200
      index: "syslog-${+YYYY.MM.DD}"

# dev tools还是差不多的配置
PUT _index_template/syslog-template
{
  "index_patterns": ["syslog*"],
  "template": {
    "settings": {
      "index.default_pipeline": "syslog-ts"
    },
    "mappings": {
      "properties": {
        "@timestamp": { "type": "date" }
      }
    }
  },
  "priority": 200
}
PUT _ingest/pipeline/syslog-ts
{
  "description": "Parse syslog.log logtime -> @timestamp",
  "processors": [
    {
      "date": {
        "field": "logtime",
        "target_field": "@timestamp",
        "formats": ["MMM dd HH:mm:ss", "MMM  d HH:mm:ss"],
        "timezone": "Asia/Shanghai",
        "on_failure": [
          { "set": { "field": "ts_parse_failed", "value": true } }
        ]
      }
    }
  ]
}


# 部署完确认一次,再做按照上面步骤制作视图
4、收集容器的日志
# 以etcd为例
# etcd-log.yaml
apiVersion: loggie.io/v1beta1
kind: ClusterLogConfig
metadata:
  name: etcd
spec:
  selector:
    type: node

  pipeline:
    name: etcd
    sources: |
      - type: file
        name: etcd
        paths:
          - /var/log/containers/etcd*.log            # 找到日志所在目录,看对应的日志是否存在

    interceptors: |
      - type: transformer
        actions:
          - action: regex(body)                      # 如果要收集其他的容器日志只需要将几段日志发给ai来生成正则就行,无非就是改正则,改pipeline,步骤都是一样的
            pattern: '^(?P<logtime>\d{4}-\d{2}-\d{2}T\d{2}:\d{2}:\d{2}\.\d+(?:Z|[+-]\d{2}:\d{2}))\s+(?P<stream>stdout|stderr)\s+(?P<flag>[FP])\s+(?P<raw>\{.*\}|.*)$'
            ignoreError: true

    sink: |
      type: elasticsearch
      hosts:
        - http://opensearch-cluster-master.beagle-monitoring:9200
      index: "etcd-log-${+YYYY.MM.DD}"

# dev tools
PUT _index_template/etcd-log-template
{
  "index_patterns": ["etcd-log*"],
  "template": {
    "settings": {
      "index.default_pipeline": "etcd-log-ts"
    },
    "mappings": {
      "properties": {
        "@timestamp": { "type": "date" }
      }
    }
  },
  "priority": 200
}
PUT _ingest/pipeline/etcd-log-ts
{
  "description": "Parse etcd-log.log logtime -> @timestamp",
  "processors": [
    {
      "date": {
        "field": "logtime",
        "target_field": "@timestamp",
        "formats": ["MMM dd HH:mm:ss", "MMM  d HH:mm:ss"],
        "timezone": "Asia/Shanghai",
        "on_failure": [
          { "set": { "field": "ts_parse_failed", "value": true } }
        ]
      }
    }
  ]
}

 浙公网安备 33010602011771号