Centos7.9安装普罗米修斯+grafana
一、基本概念
1、之间的关系
prometheus与grafana之间是相辅相成的关系。作为完美的分布式监控系统的Prometheus,就想布加迪威龙一样示例和动力强劲。在猛的车也少不了仪表盘来观察。于是优雅的可视化平台Grafana出现了。
简而言之Grafana作为可视化的平台,平台的数据从Prometheus中取到来进行仪表盘的展示。而Prometheus这源源不断的给Grafana提供数据的支持。
2、基本工作原理
- Exporter 监控工具,获取数据
- Prometheus 普罗米修斯时序数据库,用来存储和查询你的监控数据
- Grafana 仪表盘

二、了解概念之- Prometheus
Prometheus是一个开源的系统监控和报警系统,由Google BorgMon监控系统的开源版本发展而来。它使用Go语言开发,能够监控和告警各种系统,包括网络、存储、服务器和应用等。Prometheus通过采集大量监控数据并存储到时间序列数据库中,然后通过查询语言PromQL进行数据查询和可视化。它已经成为继k8s之后第二大在CNCF托管的项目,被广泛应用于各种数据中心环境的监控。
三、了解概念之—Grafana
Grafana是一个开源的度量分析和可视化套件,常被用于数据分析和监控。它支持多种不同的数据源,包括Graphite、Elasticsearch、InfluxDB、Prometheus等,并能够将数据以各种图形的方式展示出来,比如折线图、柱状图、热图等。Grafana的仪表盘可以用来展示各种信息,比如系统性能、网络延迟、用户行为等。Grafana还支持自定义查询和可视化的功能,可以根据不同的需求来定制数据展示。
环境准备
| 系统 | 配置 | IP | 角色 | ||
|---|---|---|---|---|---|
| centos7.9 | 2c4g | 192.168.8.174 | prometheus | ||
| centos7.9 | 2c4g | 192.168.8.180 | granfan,node_exporter |
1、安装普罗米修斯
prometheus-2.33.3.linux-amd64.tar.gz
#关闭防火墙,内核
[root@localhost ~]# systemctl stop firewalld
[root@localhost ~]# systemctl disable firewalld
[root@localhost ~]# setenforce 0
[root@localhost ~]# sed -i 's/SELINUX=enforcing/SELINUX=disabled/g' /etc/selinux/config


#创建prometheus程序存放目录
[root@localhost ~]# mkdir /app/
[root@localhost ~]# tar zxvf prometheus-2.33.3.linux-amd64.tar.gz -C /app/
2、启动prometheus
[root@localhost ~]# cd /app/prometheus-2.33.3.linux-amd64/
[root@localhost prometheus-2.33.3.linux-amd64]# ./prometheus

#后台启动
[root@localhost prometheus-2.33.3.linux-amd64]# nohup /app/prometheus-2.33.3.linux-amd64/prometheus &>> /var/log/prometheus.log &


#查看端口
[root@localhost prometheus-2.33.3.linux-amd64]# netstat -anpt |grep 9090
tcp6       0      0 :::9090                 :::*                    LISTEN      11953/./prometheus
tcp6       0      0 192.168.8.174:9090      192.168.8.208:13204     ESTABLISHED 11953/./prometheus
tcp6       0      0 ::1:58432               ::1:9090                ESTABLISHED 11953/./prometheus
tcp6       0      0 ::1:9090                ::1:58432               ESTABLISHED 11953/./prometheus
[root@localhost prometheus-2.33.3.linux-amd64]#
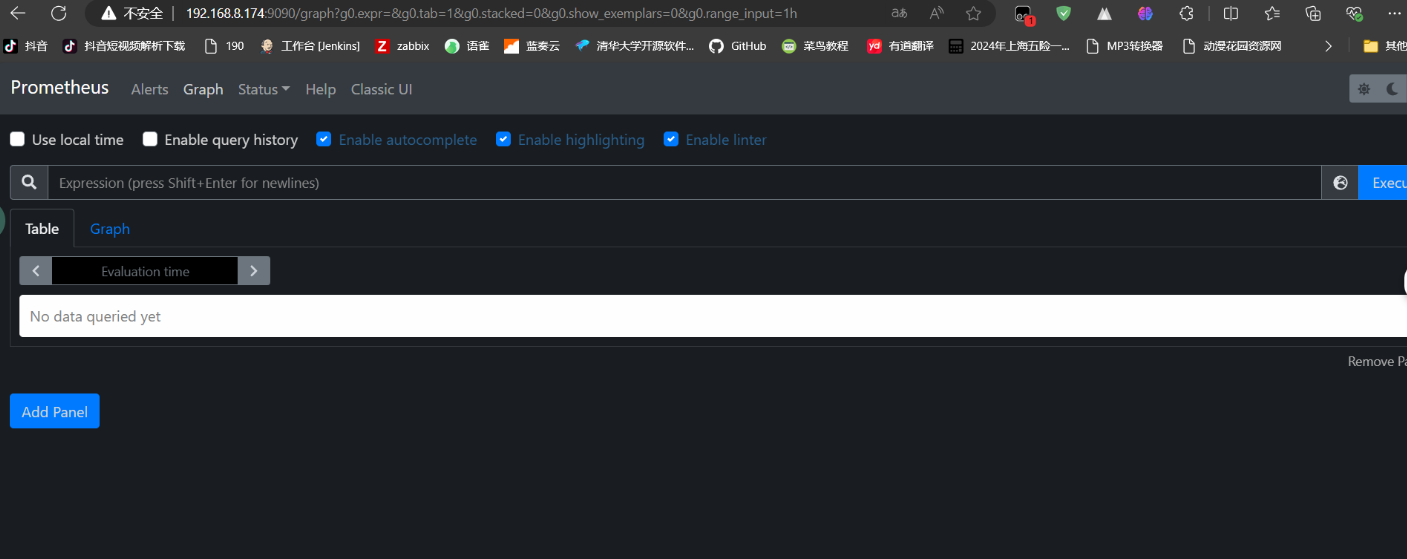
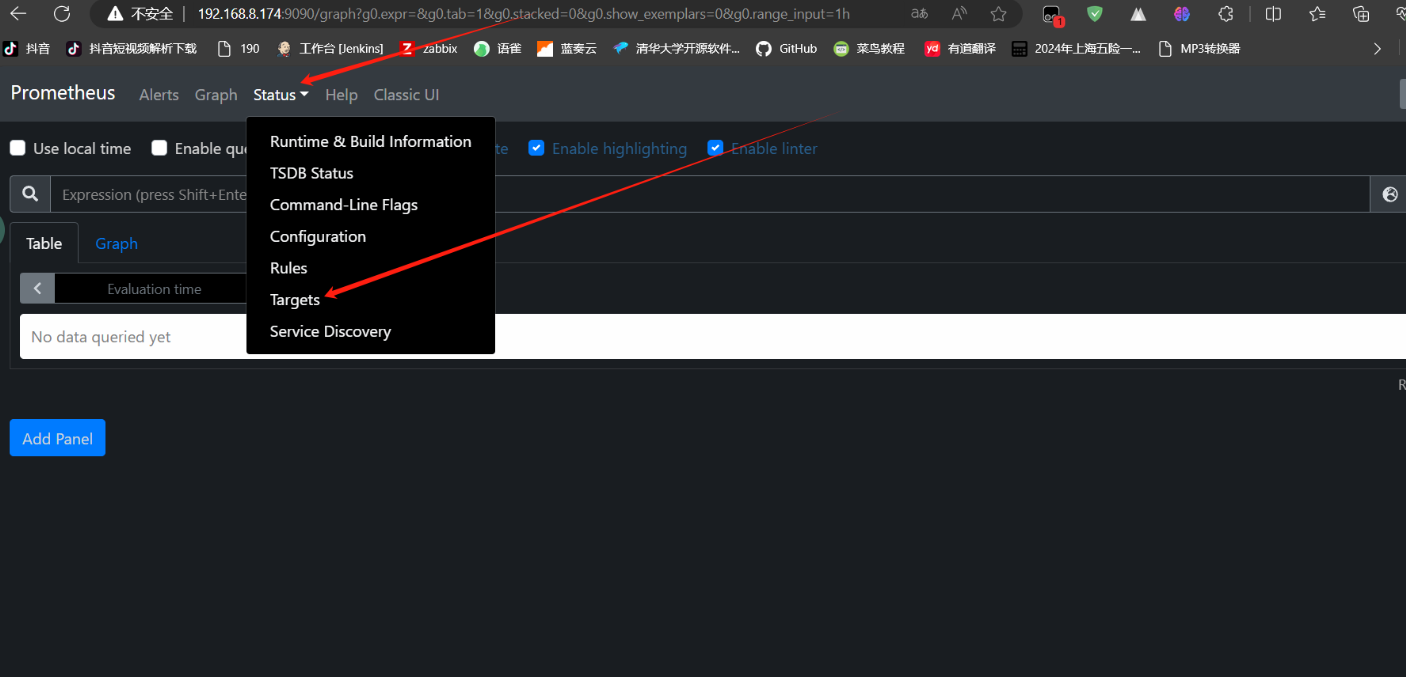
3、访问prometheus
4、在180上部署node_exporter
node_exporter-1.3.1.linux-amd64.tar.gz
[root@localhost ~]# tar zxvf node_exporter-1.3.1.linux-amd64.tar.gz
[root@localhost ~]# cd node_exporter-1.3.1.linux-amd64/


#后台启动node_exporter

[root@localhost node_exporter-1.3.1.linux-amd64]# nohup /root/node_exporter-1.3.1.linux-amd64/node_exporter &>> /var/log/node_exporter.log &
[root@localhost node_exporter-1.3.1.linux-amd64]# netstat -anpt |grep 9100
tcp6       0      0 :::9100                 :::*                    LISTEN      15329/node_exporter
[root@localhost node_exporter-1.3.1.linux-amd64]#
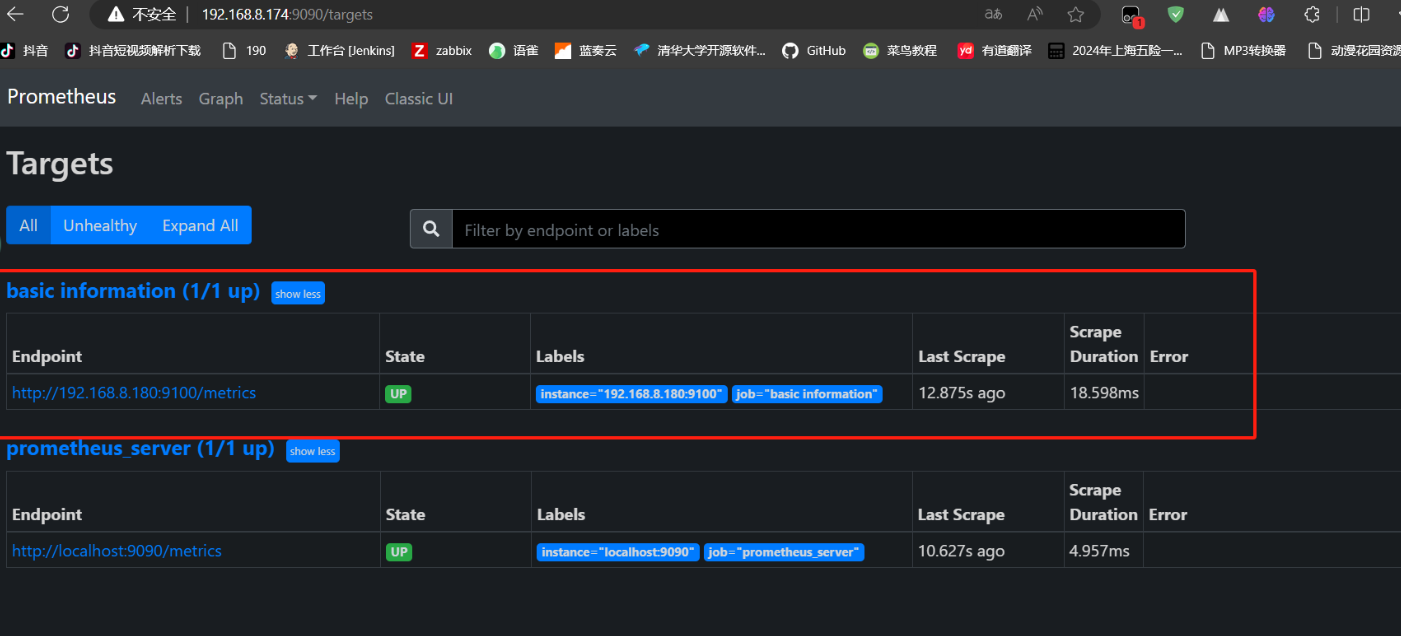
修改配置文件,并重启prometheus
[root@localhost prometheus-2.33.3.linux-amd64]# vim prometheus.yml
global:
scrape_interval: 15s
evaluation_interval: 15s
alerting:
alertmanagers:
- static_configs:
- targets:
rule_files:
scrape_configs:
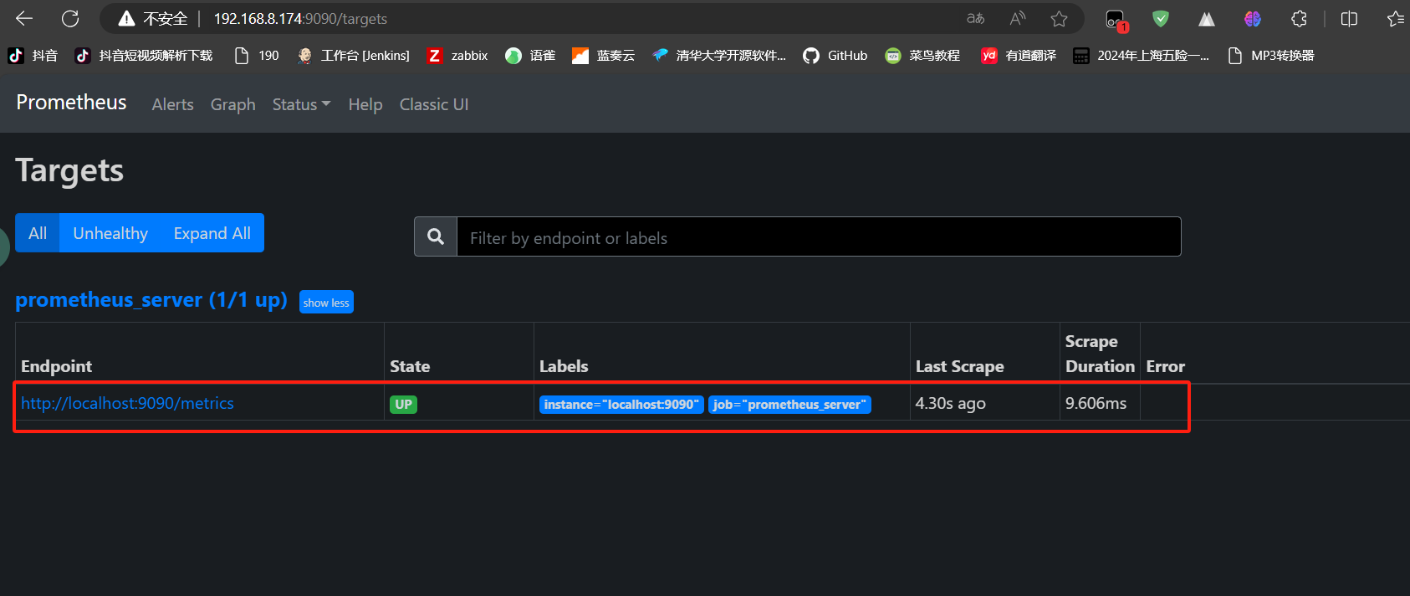
- job_name: "prometheus_server"
static_configs:
- targets: ["localhost:9090"]
- job_name: "basic information"
static_configs:
- targets: ["192.168.8.180:9100"]
[root@localhost ~]# killall prometheus
[root@localhost ~]# nohup /app/prometheus-2.33.3.linux-amd64/prometheus &>> /var/log/prometheus.log &
[root@localhost prometheus-2.33.3.linux-amd64]# ps -ef |grep prometheus
root 31400 11965 11 10:06 pts/2 00:00:00 /app/prometheus-2.33.3.linux-amd64/prometheus
root 31413 11965 0 10:06 pts/2 00:00:00 grep --color=auto prometheus
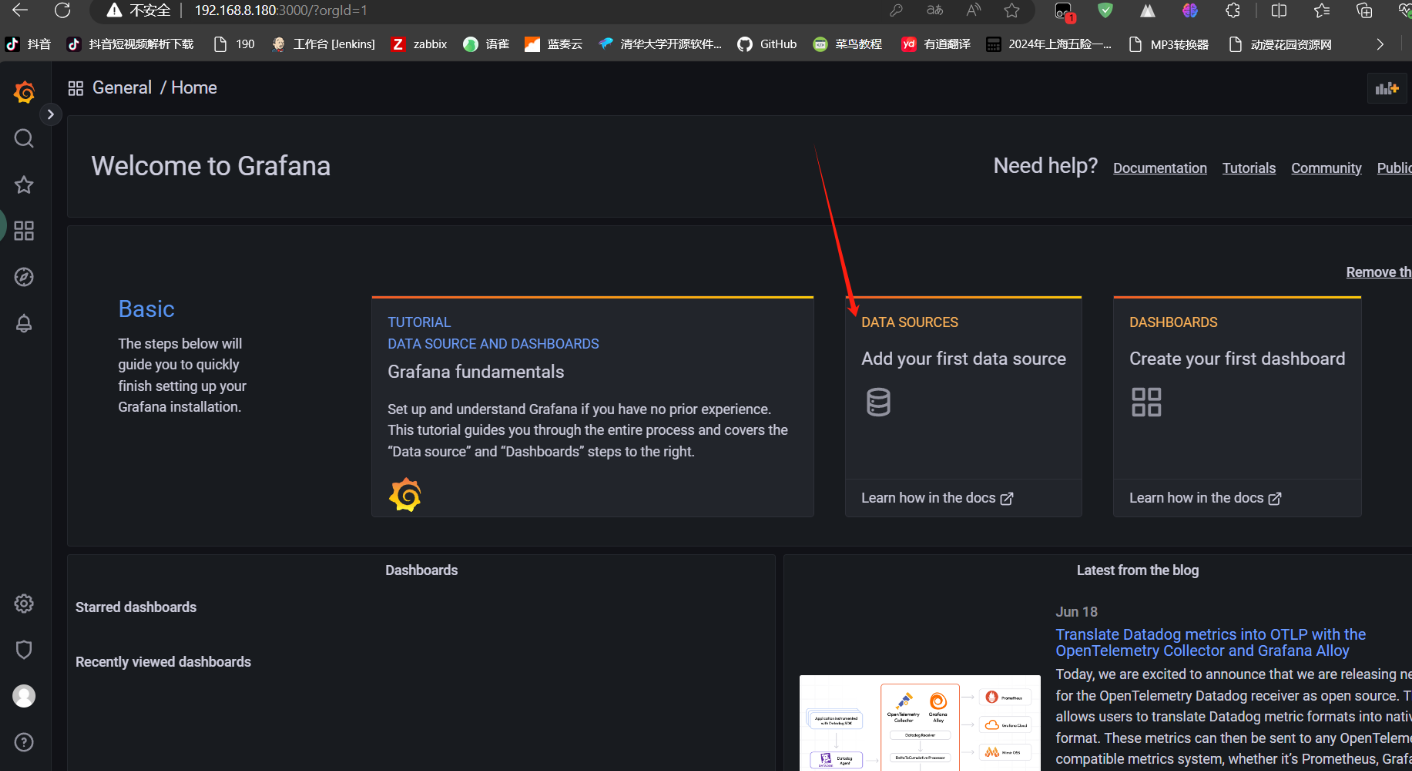
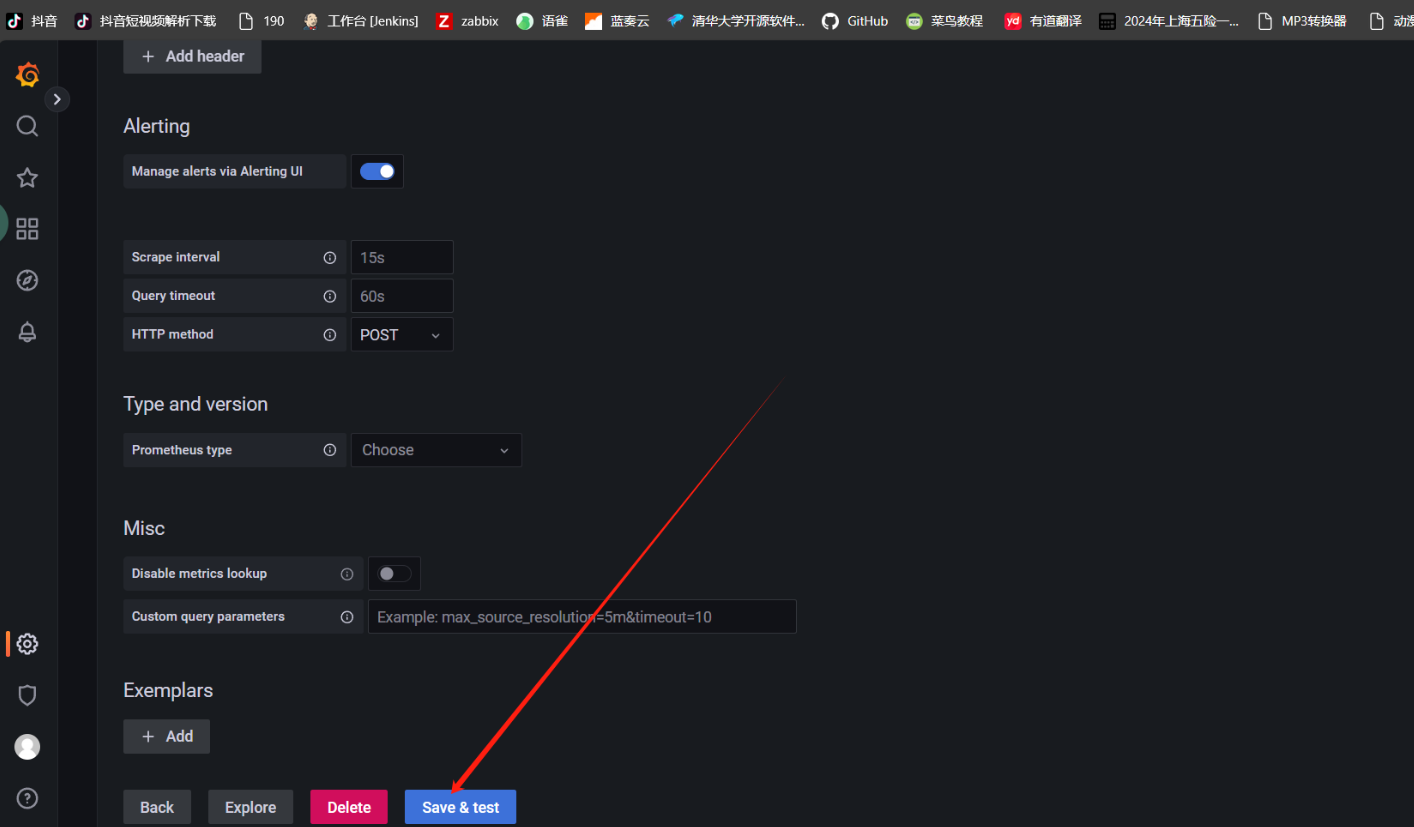
5、部署grafana
上传grafana-9.3.6-1.x86_64.rpm
[root@localhost ~]# rpm -ivh grafana-9.3.6-1.x86_64.rpm
[root@localhost ~]# systemctl start grafana-server.service
[root@zbx-server ~]# netstat -anpt |grep 3000
tcp6       0      0 :::3000                 :::*                    LISTEN      16602/grafana-serve
[root@zbx-server ~]#
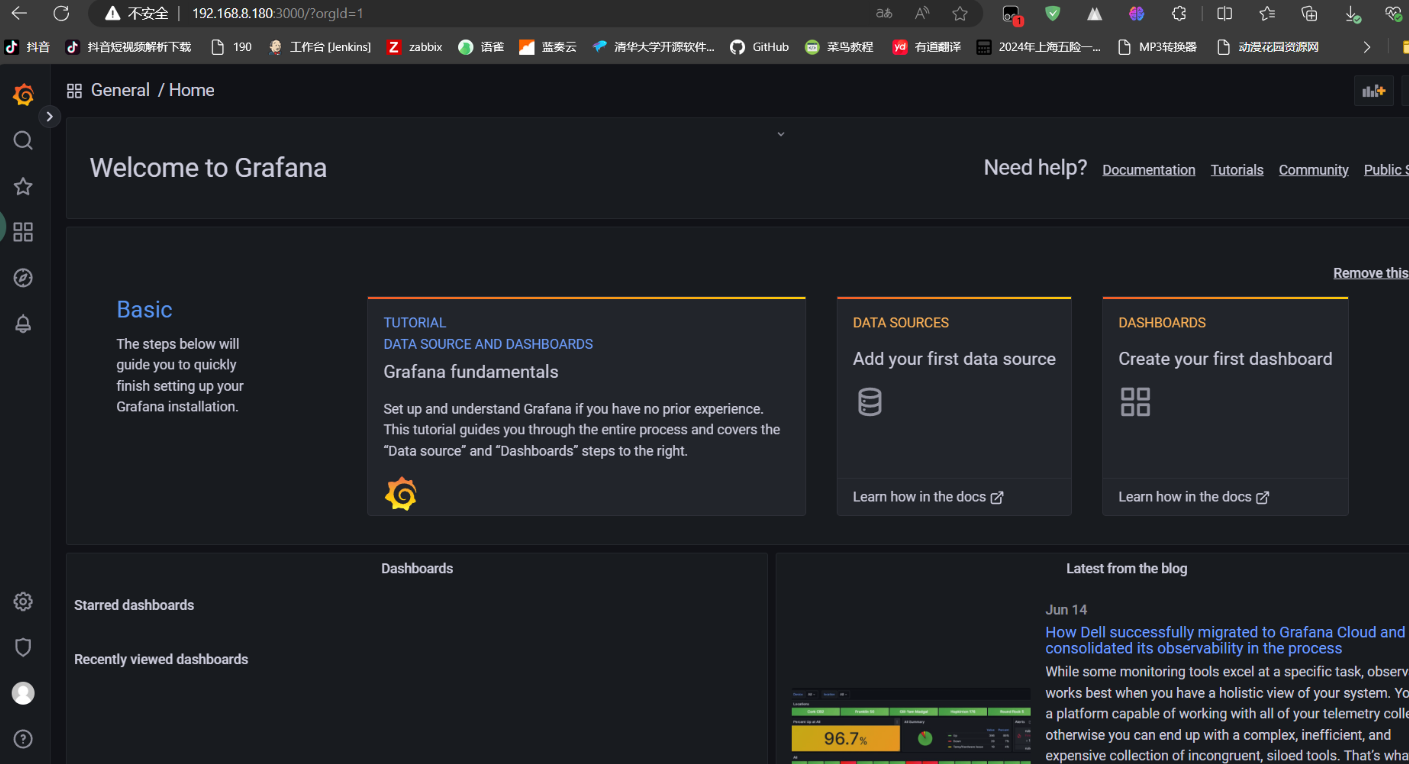
访问granfan
用户名:admin
密码:admin
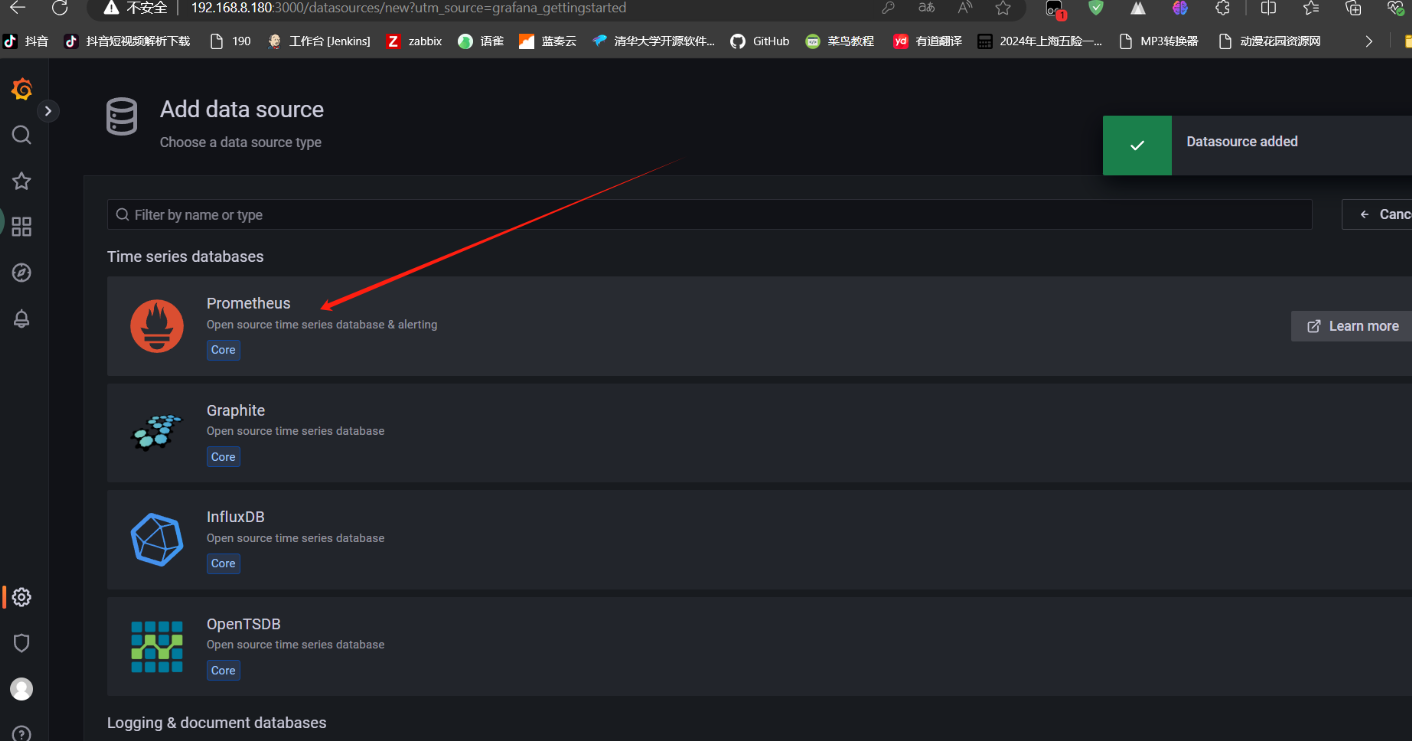
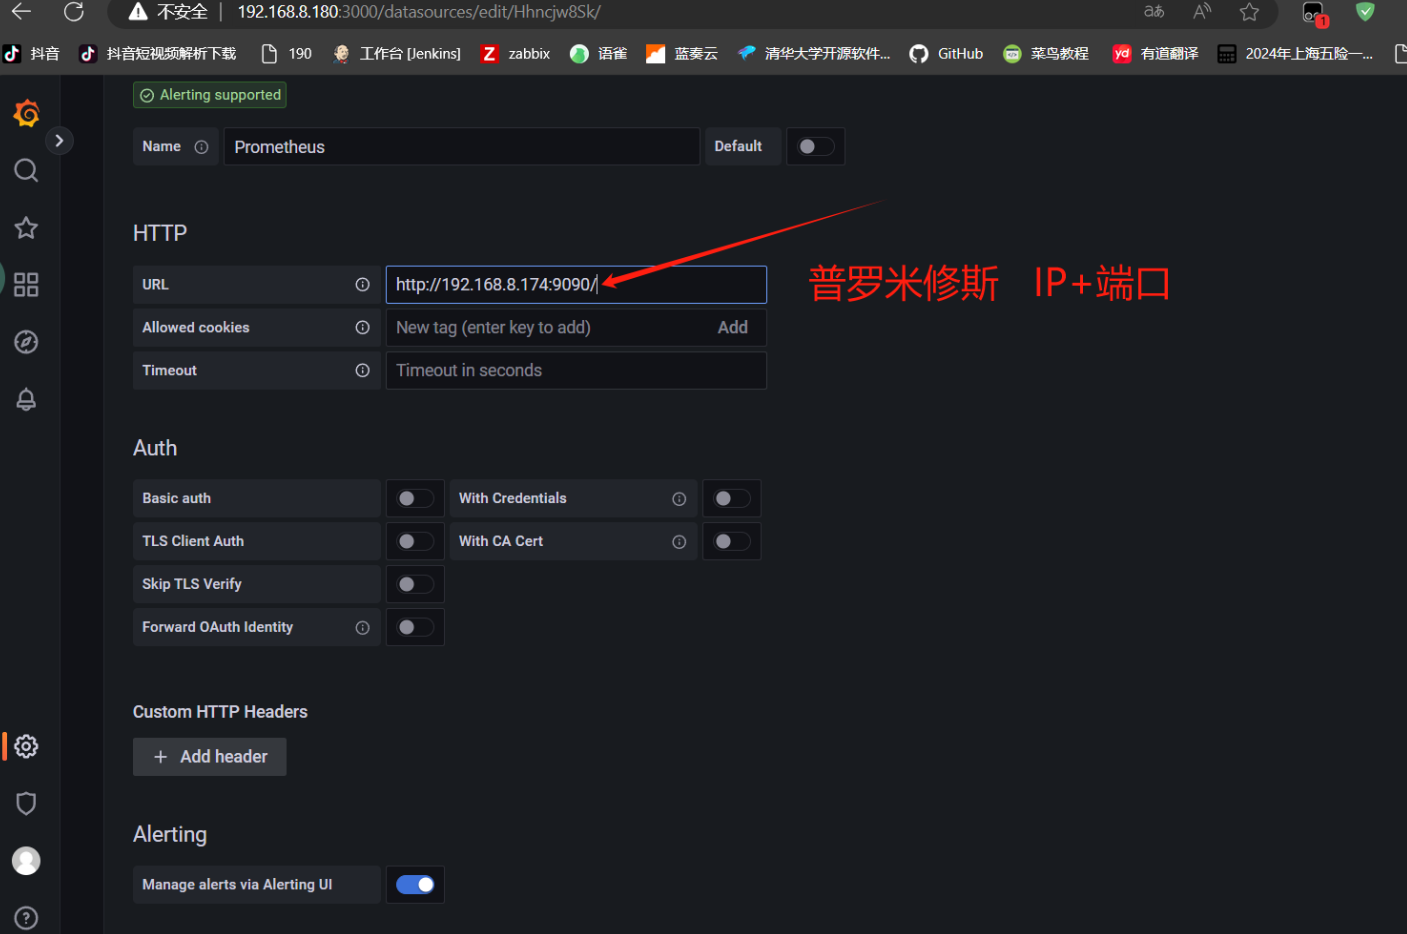
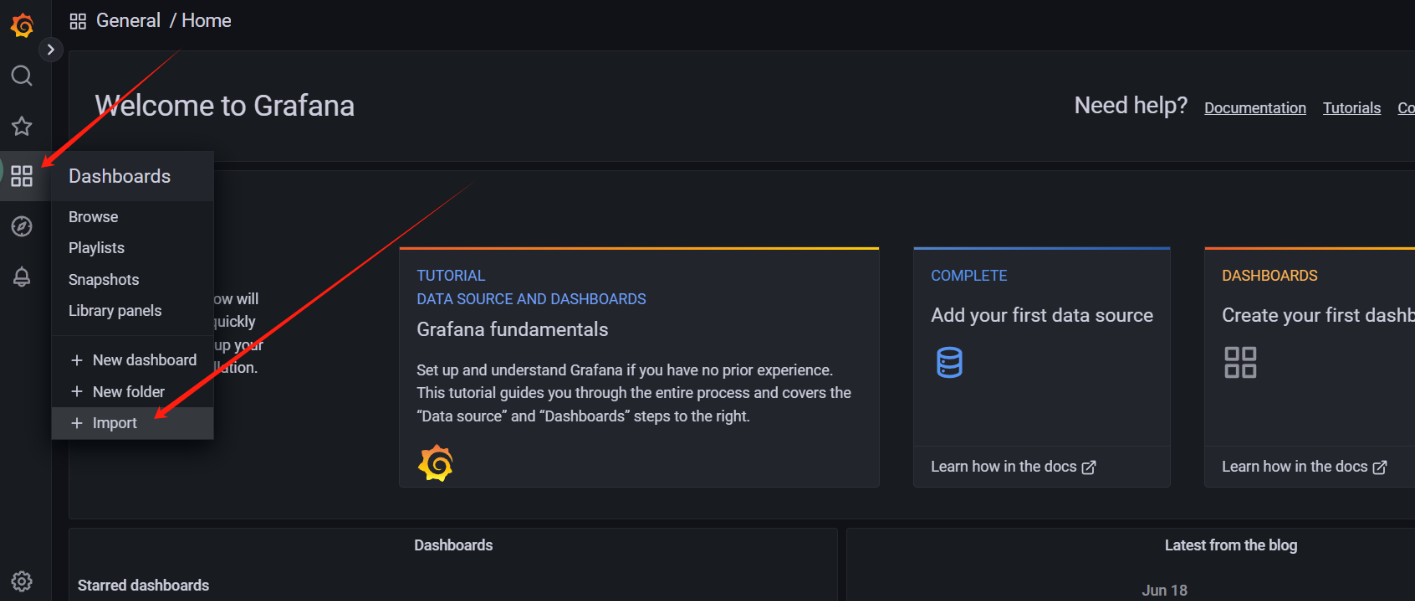
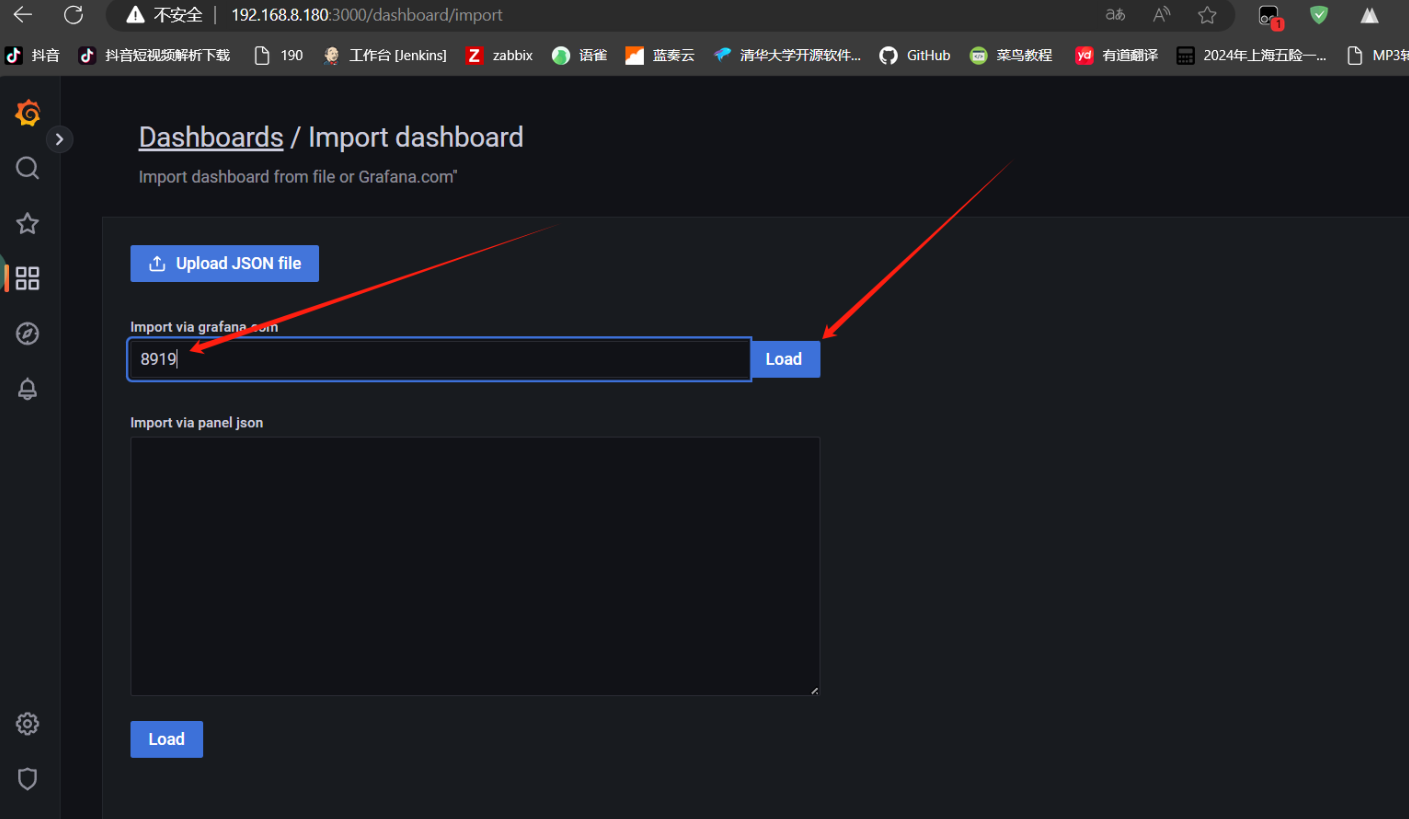
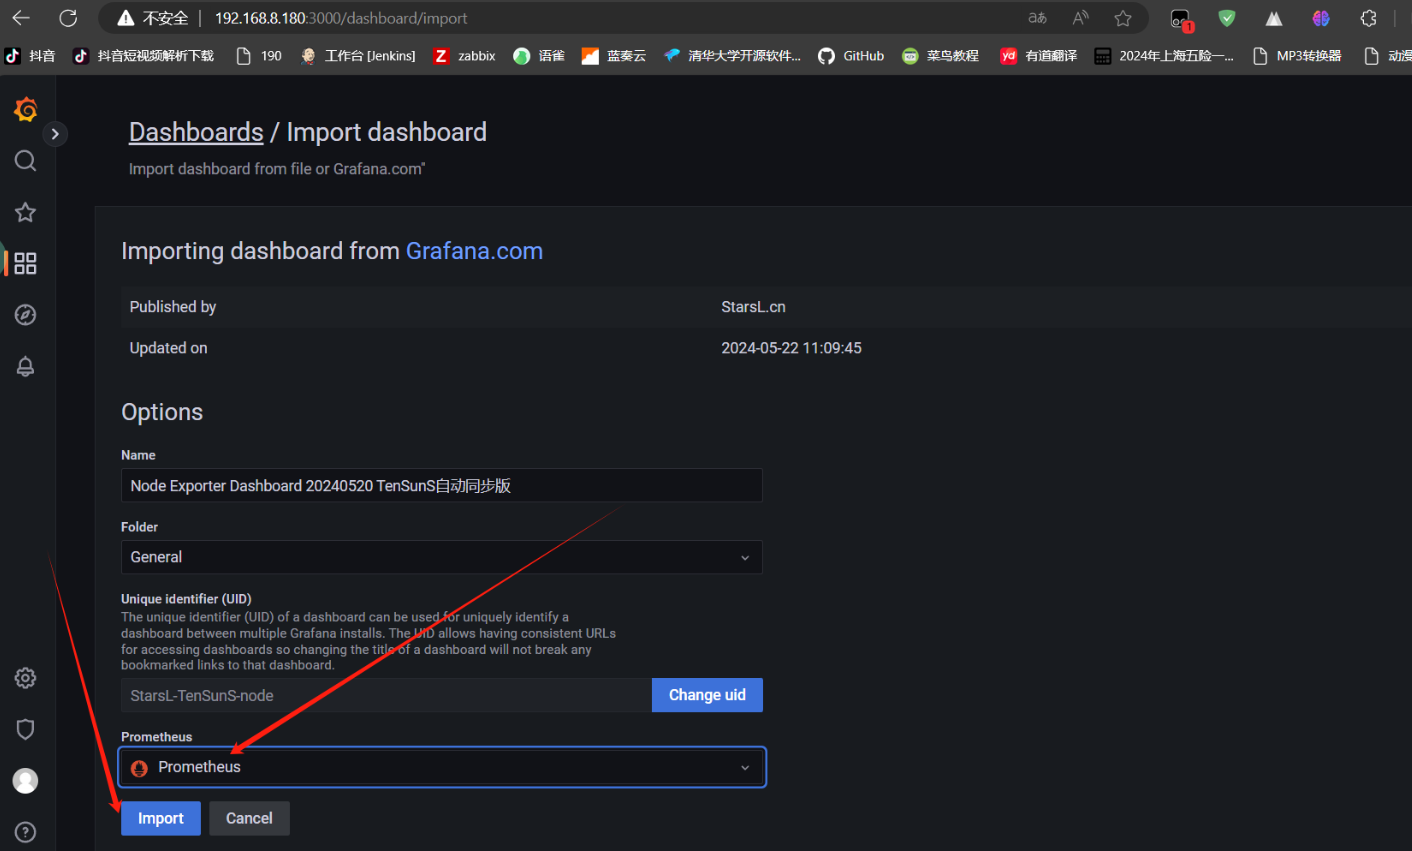
导入监控模板
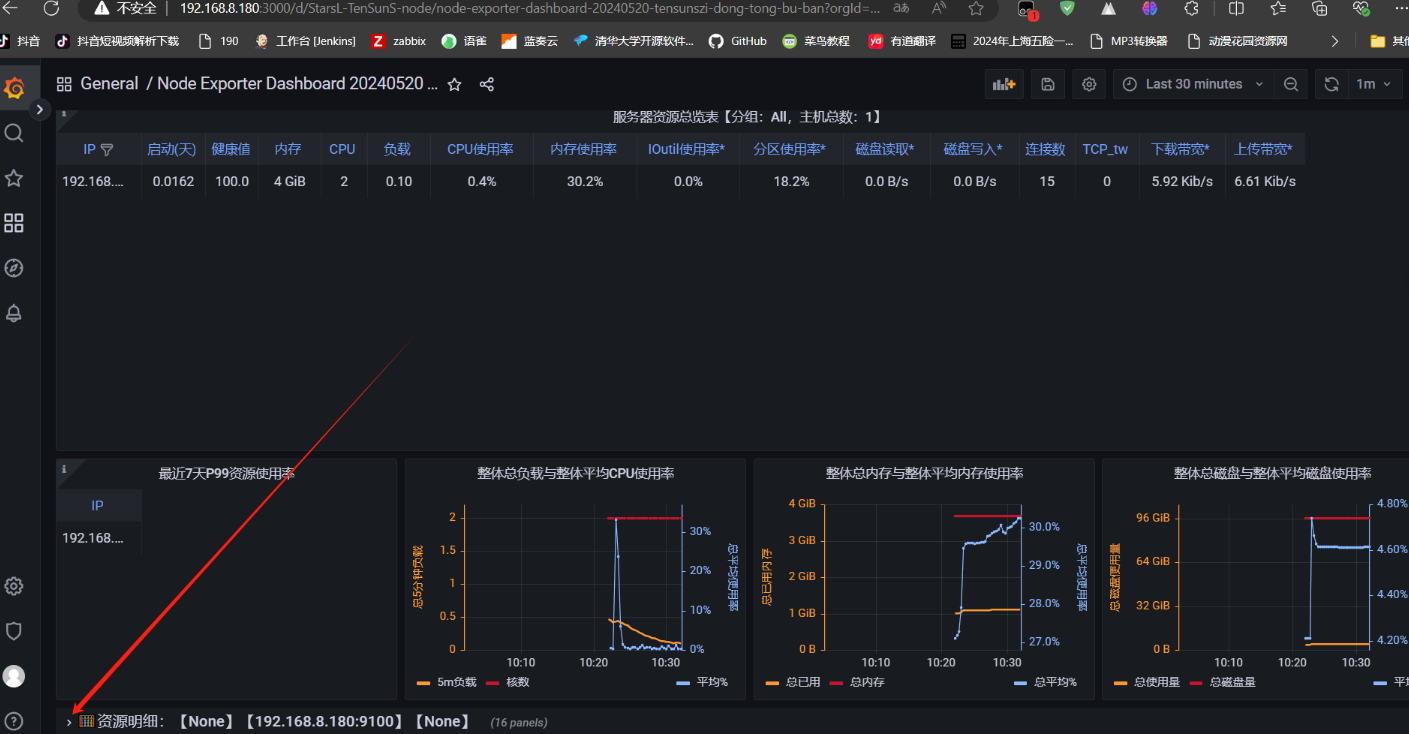
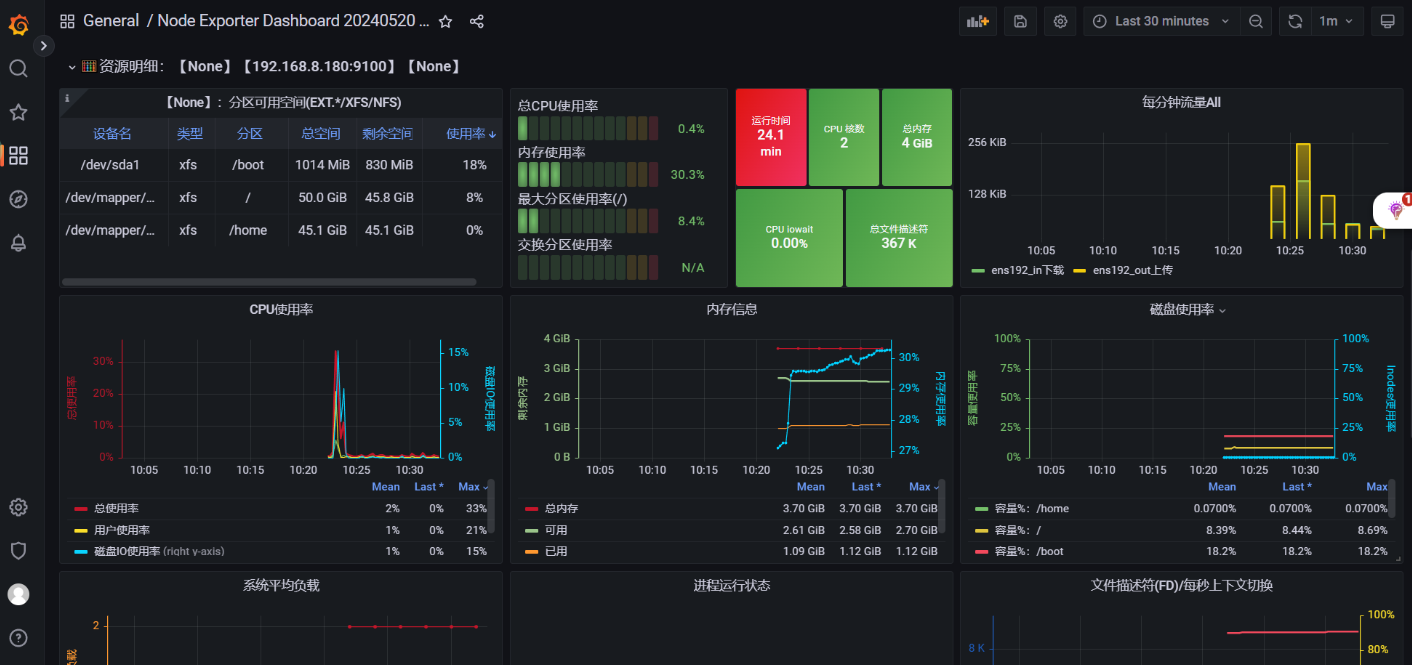
部署完毕


 浙公网安备 33010602011771号