

SpringBoot集成prometheus
1、Prometheus
1)介绍
Prometheus是一套开源的监控&报警&时间序列数据库的组合,基于应用的metrics来进行监控的开源工具 。
架构图:

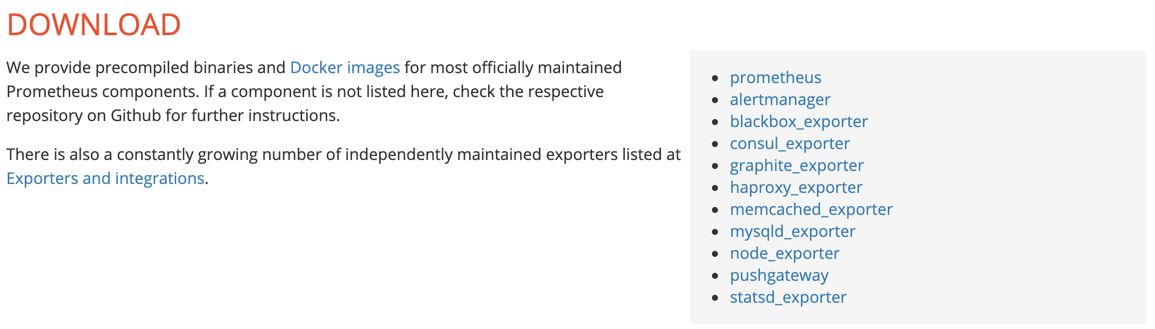
2)下载
https://prometheus.io/download/
3)安装
tar -xvzf  prometheus-2.1.0.linux-amd64.tar.gz
ln -s  prometheus-2.1.0.linux-amd64  prometheus
./prometheus --config.file=prometheus.yml  &
ps -ef|grep prometheus |grep -v grep
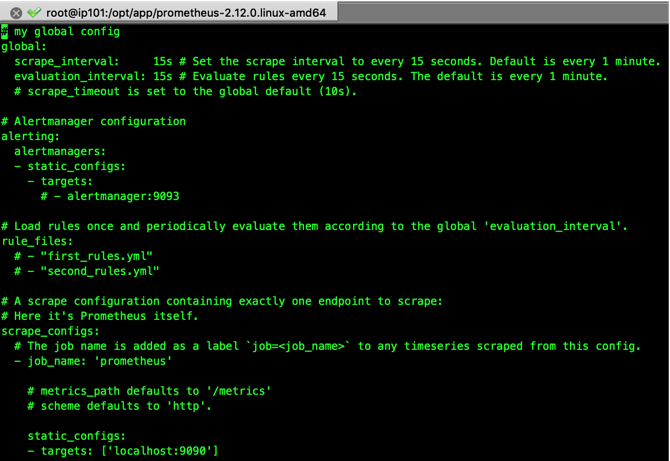
通过指定配置文件prometheus.yml启动Prometheus
配置文件官方说明: https://prometheus.io/docs/prometheus/latest/configuration/configuration/
默认情况下,Prometheus会监控自己本身。
4)prometheus自身metrics
http://192.168.8.101:9090/metrics
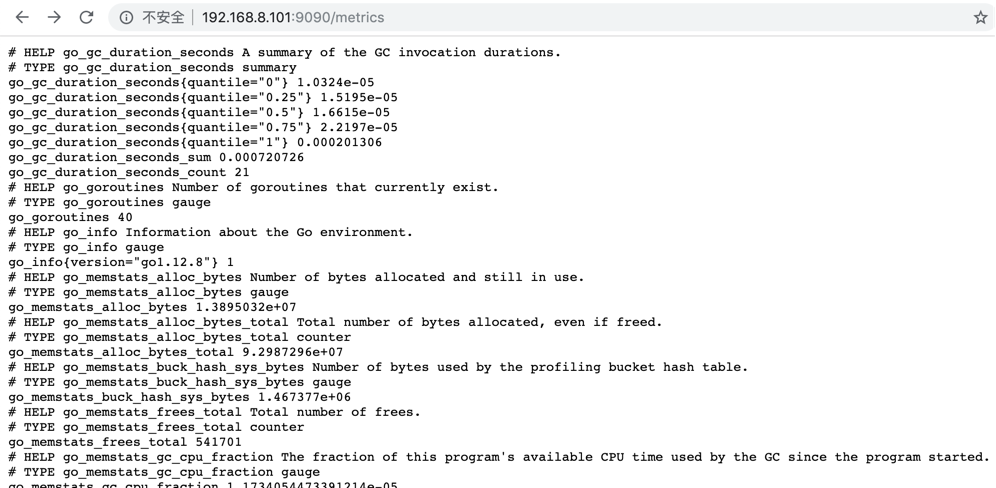
太多了,真是没法看,还好有个弱弱的图形页面 (待会整合到Grafana 中就方便看了)
5)prometheus自身graph
http://192.168.8.101:9090/graph
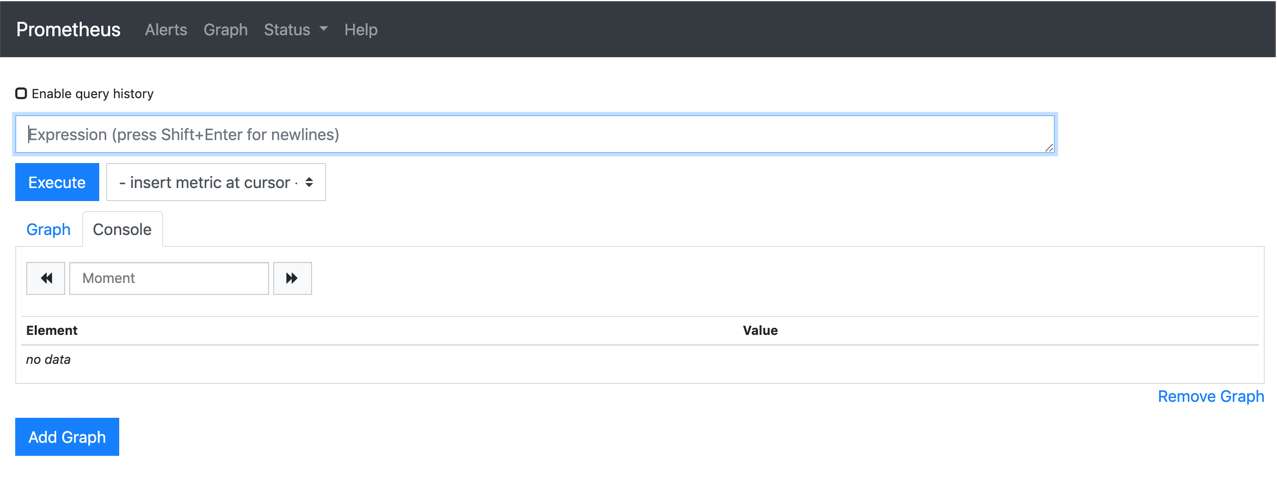
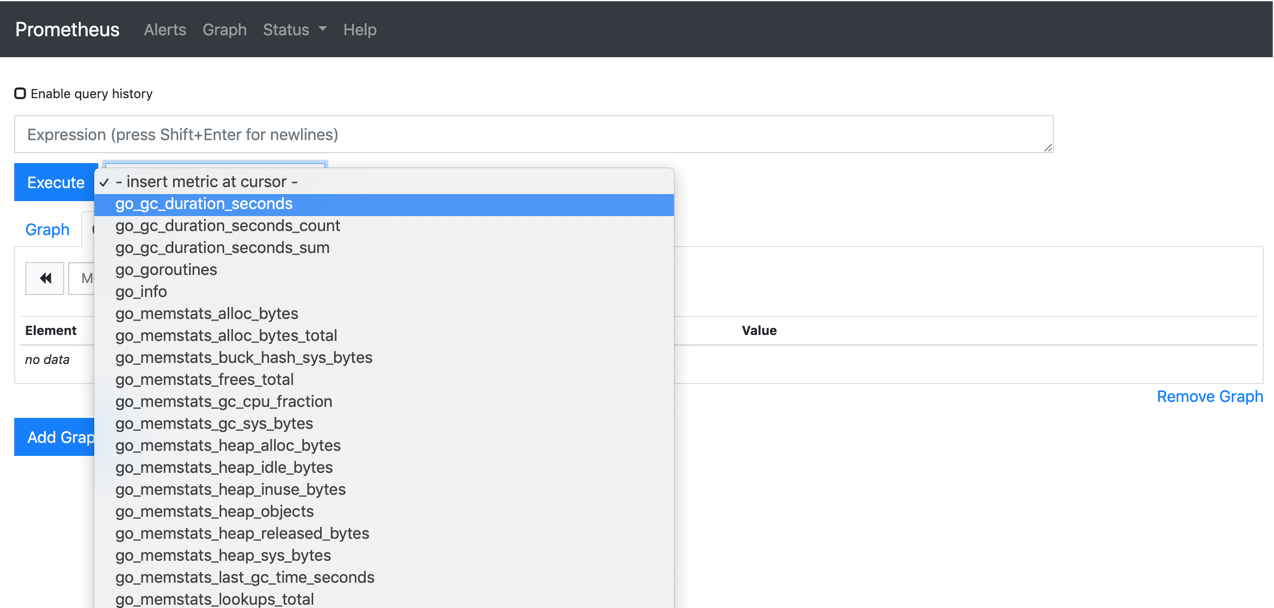
选中某个指标,点击Execute . 超多指标可以查看 …
6)查看prometheus配置
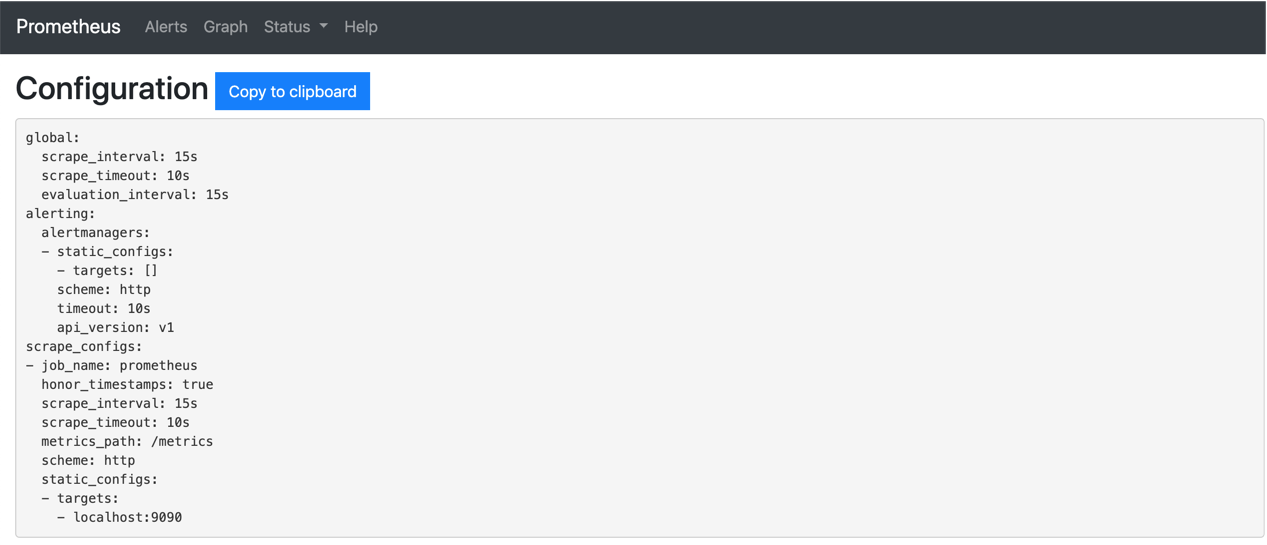
prometheus.yml文件
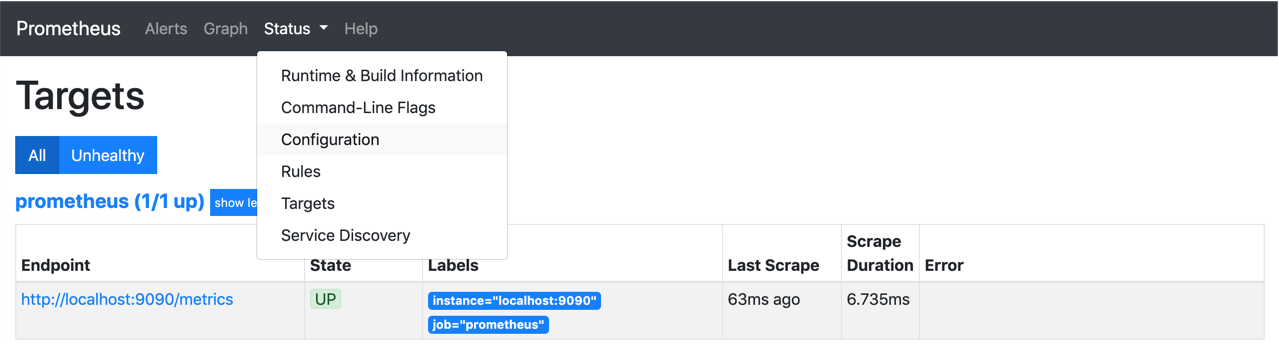
7)查看监控对象
2、SpringBoot
1)pom依赖
<?xml version="1.0" encoding="UTF-8"?>
<project xmlns="http://maven.apache.org/POM/4.0.0" xmlns:xsi="http://www.w3.org/2001/XMLSchema-instance"
	xsi:schemaLocation="http://maven.apache.org/POM/4.0.0 https://maven.apache.org/xsd/maven-4.0.0.xsd">
	<modelVersion>4.0.0</modelVersion>
	<parent>
		<groupId>org.springframework.boot</groupId>
		<artifactId>spring-boot-starter-parent</artifactId>
		<version>2.1.8.RELEASE</version>
		<relativePath/> <!-- lookup parent from repository -->
	</parent>
	<groupId>com.test</groupId>
	<artifactId>clientmonitor</artifactId>
	<version>0.0.1-SNAPSHOT</version>
	<name>clientmonitor</name>
	<description>Demo project for Spring Boot</description>

	<properties>
		<java.version>1.8</java.version>
	</properties>

	<dependencies>
		<dependency>
			<groupId>org.springframework.boot</groupId>
			<artifactId>spring-boot-starter-web</artifactId>
		</dependency>

		<dependency>
			<groupId>org.springframework.boot</groupId>
			<artifactId>spring-boot-devtools</artifactId>
			<scope>runtime</scope>
			<optional>true</optional>
		</dependency>
		<dependency>
			<groupId>org.springframework.boot</groupId>
			<artifactId>spring-boot-starter-test</artifactId>
			<scope>test</scope>
		</dependency>

		<!--增加依赖-->
		<dependency>
			<groupId>org.springframework.boot</groupId>
			<artifactId>spring-boot-starter-actuator</artifactId>
		</dependency>
		<dependency>
			<groupId>io.micrometer</groupId>
			<artifactId>micrometer-core</artifactId>
		</dependency>
		<dependency>
			<groupId>io.micrometer</groupId>
			<artifactId>micrometer-registry-prometheus</artifactId>
		</dependency>

	</dependencies>

	<build>
		<plugins>
			<plugin>
				<groupId>org.springframework.boot</groupId>
				<artifactId>spring-boot-maven-plugin</artifactId>
			</plugin>
		</plugins>
	</build>

</project>
2) application.yaml or application.properties
spring:
  application:
    name: springbootPrometheusGrafana

management:
  endpoints:
    web:
      exposure:
        include:  '*'
  metrics:
    tags:
       application: ${spring.application.name}
spring.application.name=springbootPrometheusGrafana
management.endpoints.web.exposure.include=*
management.metrics.tags.application=${spring.application.name}
#注意此处使用,访问的时候必须访问/actuator/prometheus,如不配置则访问/prometheus
management.endpoints.web.base-path=/actuator
3)实例化MeterRegistryCustomizer
@SpringBootApplication
public class ClientmonitorApplication {

	public static void main(String[] args) {
		SpringApplication.run(ClientmonitorApplication.class, args);
	}

	@Bean
	MeterRegistryCustomizer<MeterRegistry> configurer(@Value("${spring.application.name}") String applicationName) {
		return (registry) -> registry.config().commonTags("application", applicationName);
	}
}
4) 注册Metrics
实现 MeterBinder 接口的 bindTo 方法,将要采集的指标注册到 MeterRegistry
@Component
public class JobMetrics implements MeterBinder {
    public Counter job1Counter;
    public Counter job2Counter;

    public Map<String, Double> map;

    JobMetrics() {
        map = new HashMap<>();
    }

    @Override
    public void bindTo(MeterRegistry meterRegistry) {
         this.job1Counter = Counter.builder("counter_builder_job_counter1")
                .tags(new String[]{"name", "tag_job_counter1"})
                .description("description-Job counter1 execute count").register(meterRegistry);

        this.job2Counter = Counter.builder("counter_builder_job_counter2")
                .tags(new String[]{"name", "tag_job_counter2"})
                .description("description-Job counter2 execute count ").register(meterRegistry);

        Gauge.builder("gauge_builder_job_gauge", map, x -> x.get("x"))
                .tags("name", "tag_job_gauge")
                .description("description-Job gauge")
                .register(meterRegistry);
    }

}
5) 定时任务实现counter,gauge数据填充
@Component
@EnableScheduling
public class MyJob {

    private Integer count1 = 0;

    private Integer count2 = 0;

    @Autowired
    private JobMetrics jobMetrics;

    @Async("main")
    @Scheduled(fixedDelay = 1000)
    public void doSomething() {
        count1++;
        jobMetrics.job1Counter.increment();
        jobMetrics.map.put("x", Double.valueOf(count1));
        System.out.println("task1 count:" + count1);
        if(count1%2==0){
            System.out.println("%5==0");
            jobMetrics.map.put("x", Double.valueOf(1));
        }

    }

    @Async
    @Scheduled(fixedDelay = 10000)
    public void doSomethingOther() {
        count2++;
        jobMetrics.job2Counter.increment();
        System.out.println("task2 count:" + count2);
    }
}
7) Controller 接口方式实现counter,gauge数据填充
@RestController
public class CounterController {
    @Autowired
    private JobMetrics jobMetrics;

    @RequestMapping(value = "/counter1", method= RequestMethod.GET)
    public void counter1() {
        jobMetrics.job2Counter.increment();
    }

    @RequestMapping(value = "/counter2", method= RequestMethod.GET)
    public void counter2() {
        jobMetrics.job2Counter.increment();
    }
    @RequestMapping(value = "/gauge", method= RequestMethod.GET)
    public void gauge(@RequestParam(value = "x") String x) {
        System.out.println("gauge controller x"+x);
        jobMetrics.map.put("x",Double.valueOf(x));
    }
}
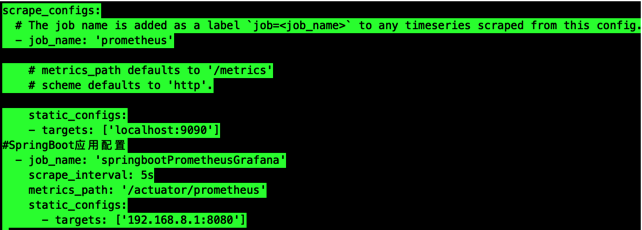
6) prometheus 更改配置文件,接入SpringBoot
增加如下配置
#SpringBoot应用配置
  - job_name: 'springbootPrometheusGrafana'
    scrape_interval: 5s
    metrics_path: '/actuator/prometheus'
    static_configs:
      - targets: ['192.168.8.1:8080']
Targets
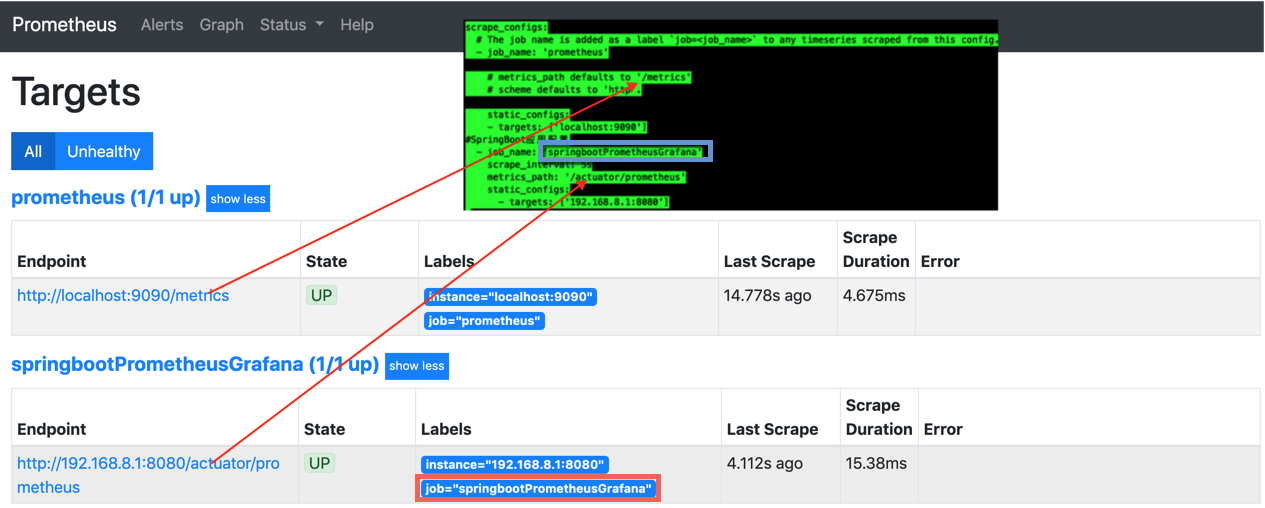
metrisc_path:/actuator/prometheus

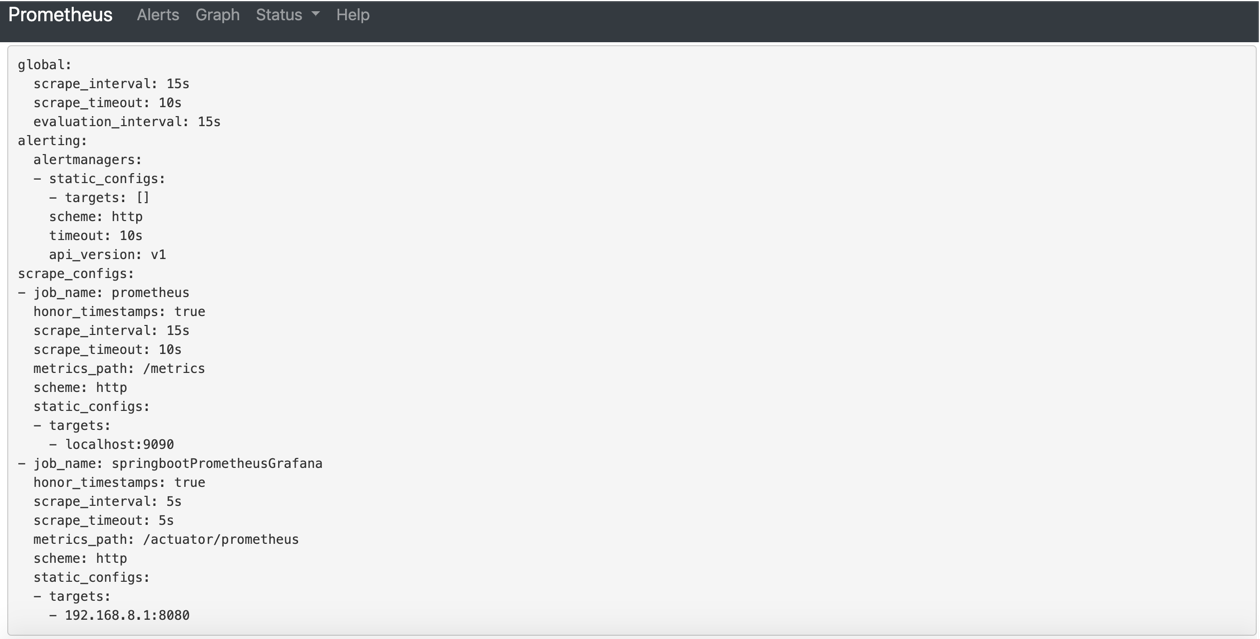
Configuration
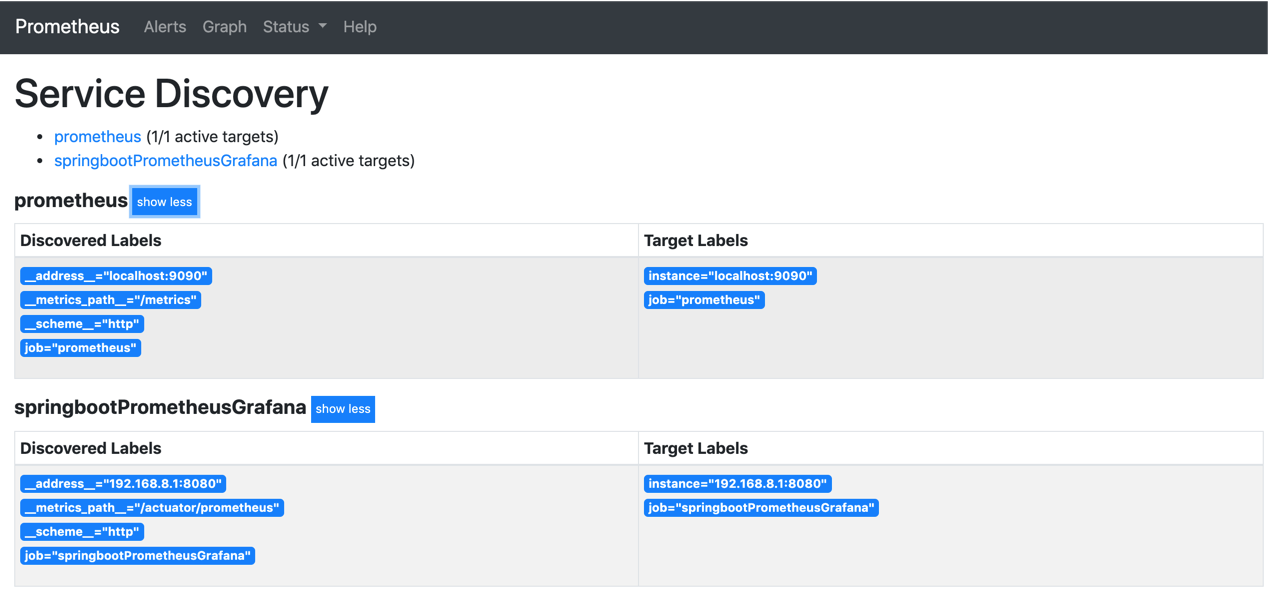
Service Discovery:
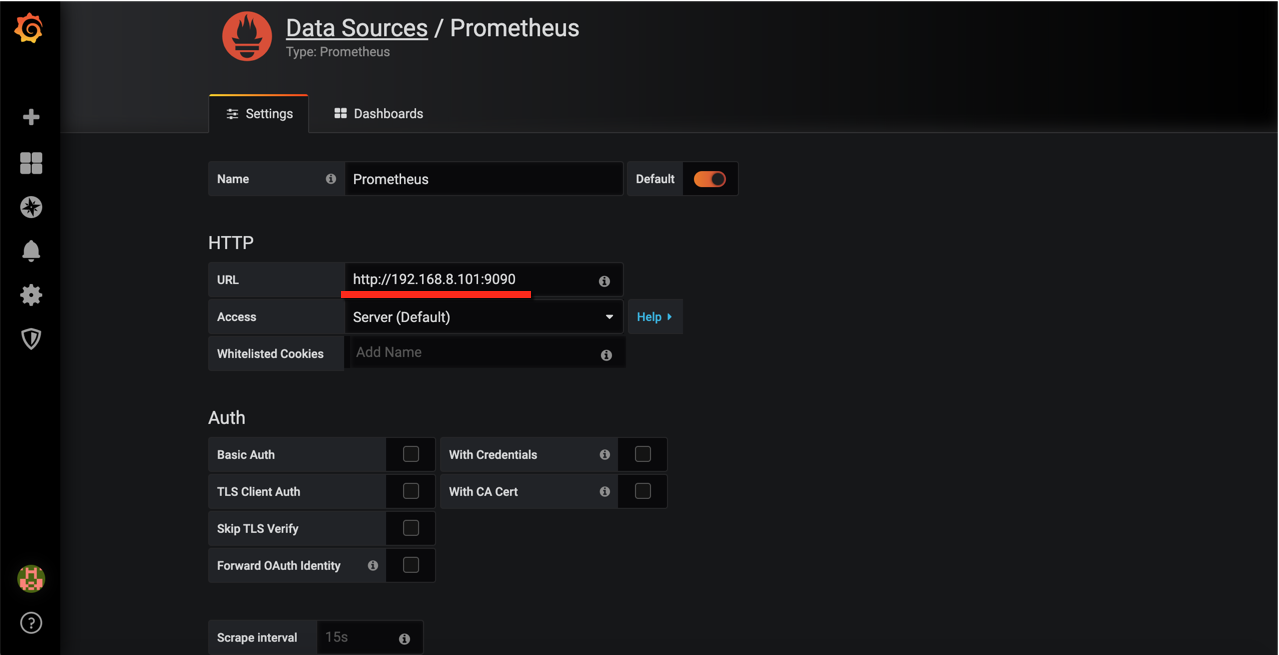
3、Grafana
1)介绍
Prometheus 的可视化功能比较弱,这里我们来接入Grafana 。
Grafana是一个跨平台的开源的度量分析和可视化工具,可以通过将采集的数据查询然后可视化的展示,并及时通知。它主要有以下六大特点:
-
展示方式:快速灵活的客户端图表,面板插件有许多不同方式的可视化指标和日志,官方库中具有丰富的仪表盘插件,比如热图、折线图、图表等多种展示方式;
-
数据源:Graphite,InfluxDB,OpenTSDB,Prometheus,Elasticsearch,CloudWatch和KairosDB等;
-
通知提醒:以可视方式定义最重要指标的警报规则,Grafana将不断计算并发送通知,在数据达到阈值时通过Slack、PagerDuty等获得通知;
-
混合展示:在同一图表中混合使用不同的数据源,可以基于每个查询指定数据源,甚至自定义数据源;
-
注释:使用来自不同数据源的丰富事件注释图表,将鼠标悬停在事件上会显示完整的事件元数据和标记;
-
过滤器:Ad-hoc过滤器允许动态创建新的键/值过滤器,这些过滤器会自动应用于使用该数据源的所有查询。
2) 安装
yum localinstall grafana-6.2.1-1.x86_64.rpm
systemctl start grafana-server
#设为开机启动
systemctl enable grafana-server
ps -ef|grep grafana-server |grep -v grep
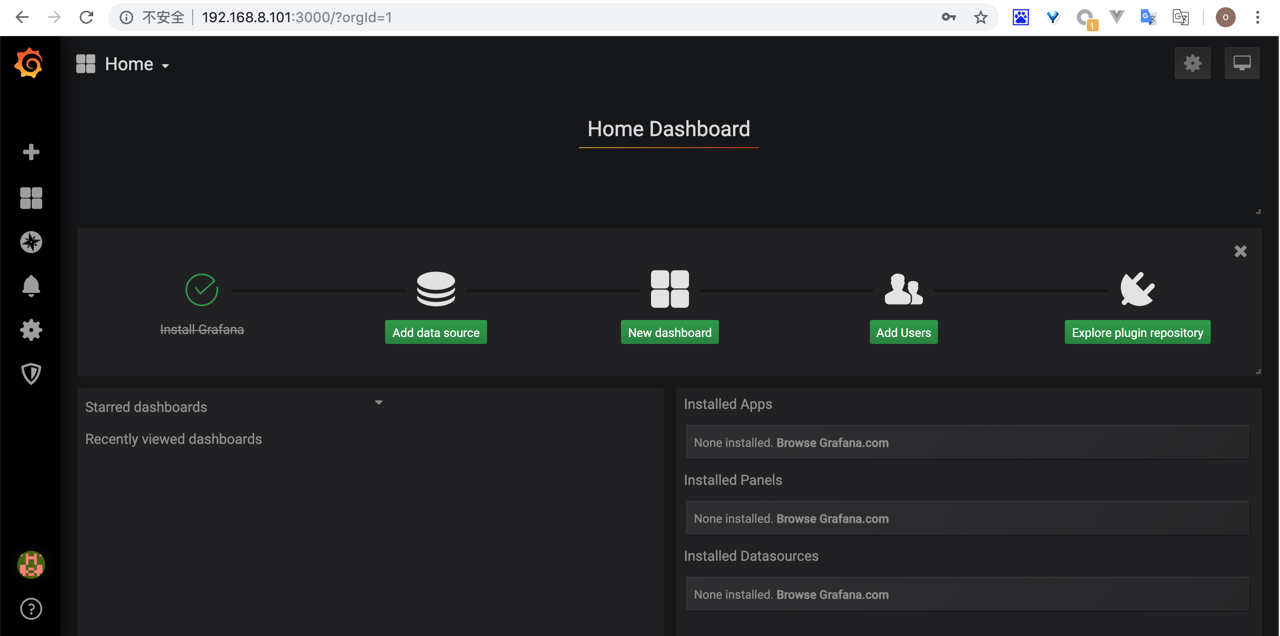
3)访问
配置文件 /etc/grafana/grafana.ini , 默认3000端口,按需修改
##################### Grafana Configuration Example #####################
#
# Everything has defaults so you only need to uncomment things you want to
# change

# possible values : production, development
;app_mode = production

# instance name, defaults to HOSTNAME environment variable value or hostname if HOSTNAME var is empty
;instance_name = ${HOSTNAME}

#################################### Paths ####################################
[paths]
# Path to where grafana can store temp files, sessions, and the sqlite3 db (if that is used)
;data = /var/lib/grafana

# Temporary files in `data` directory older than given duration will be removed
;temp_data_lifetime = 24h

# Directory where grafana can store logs
;logs = /var/log/grafana

# Directory where grafana will automatically scan and look for plugins
;plugins = /var/lib/grafana/plugins

# folder that contains provisioning config files that grafana will apply on startup and while running.
;provisioning = conf/provisioning

#################################### Server ####################################
[server]
# Protocol (http, https, socket)
;protocol = http

# The ip address to bind to, empty will bind to all interfaces
;http_addr =

# The http port  to use
;http_port = 3000

"/etc/grafana/grafana.ini" 530L, 16841C
;access_key =
;secret_key =

[external_image_storage.webdav]
;url =
;public_url =
;username =
;password =

[external_image_storage.gcs]
;key_file =
;bucket =
;path =

[external_image_storage.azure_blob]
;account_name =
;account_key =
;container_name =

[external_image_storage.local]
# does not require any configuration

[rendering]
# Options to configure external image rendering server like https://github.com/grafana/grafana-image-renderer
;server_url =
;callback_url =

[enterprise]
# Path to a valid Grafana Enterprise license.jwt file
;license_path =

[panels]
# If set to true Grafana will allow script tags in text panels. Not recommended as it enable XSS vulnerabilities.
;disable_sanitize_html = false

[plugins]
;enable_alpha = false
;app_tls_skip_verify_insecure = false
访问 http://192.168.8.101:3000/login
默认的用户名和密码为 admin/admin


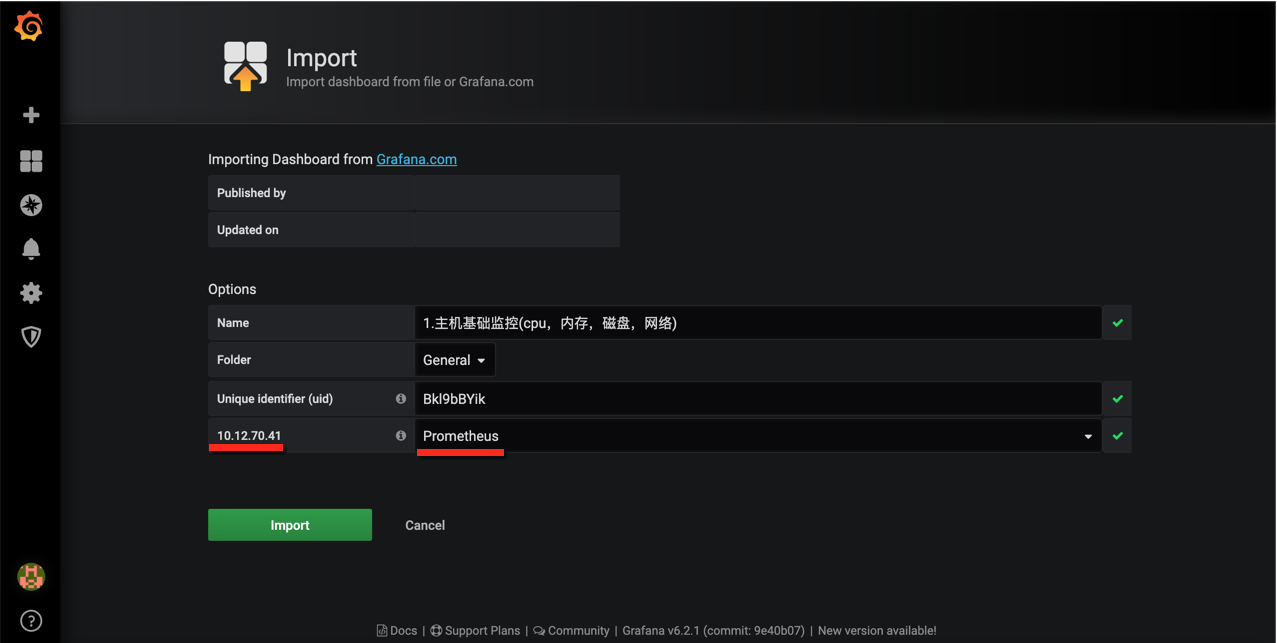
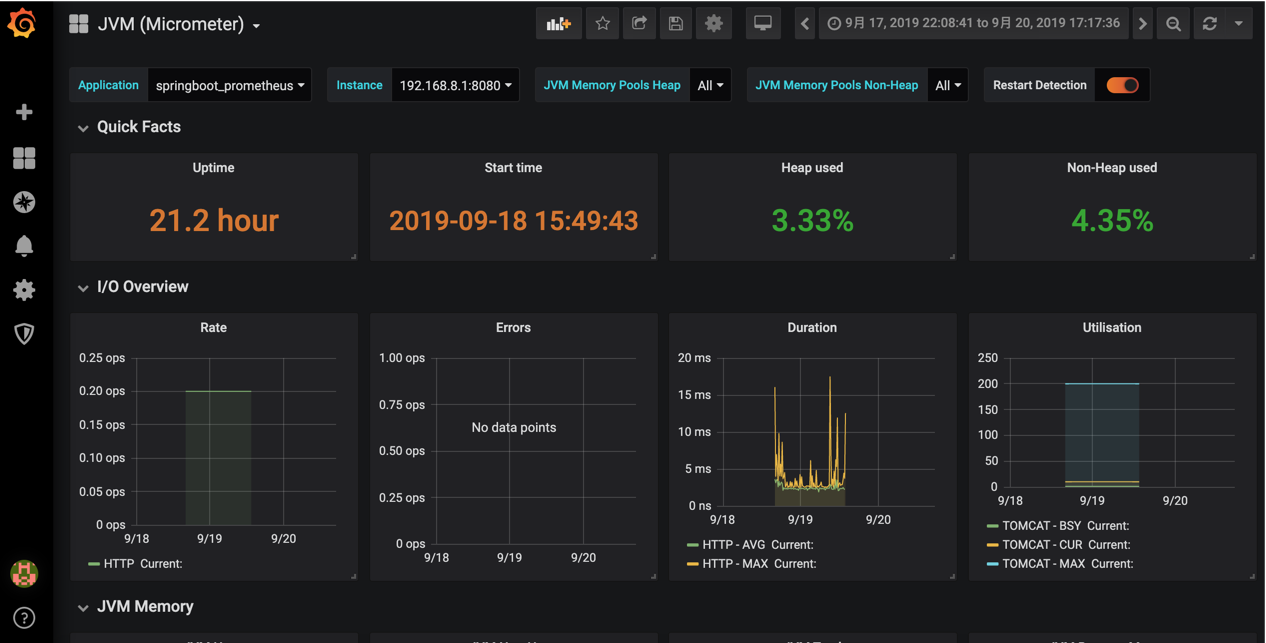
SpringBoot JVM监控 grafana 导入471 dashboard

 浙公网安备 33010602011771号