![]()
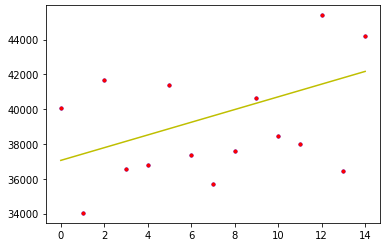
![]() y = groupall.values[:, 2:] x = range(np.shape(y)[1]) plt.plot(x, y[0], "b.") x2 = np.array(x).reshape(-1,1) y2 = np.array(y[0]).reshape(-1,1) plt.plot(x2, y2, "r.") sgd_reg2 = SGDRegressor(n_iter_no_change=5000, penalty=None, eta0=0.1, random_state=42, max_iter=100000) sgd_reg2.fit(x2, y2.ravel()) y_predict = sgd_reg2.predict(x2) plt.plot(x2, y_predict, "y-") print(y_predict)
y = groupall.values[:, 2:] x = range(np.shape(y)[1]) plt.plot(x, y[0], "b.") x2 = np.array(x).reshape(-1,1) y2 = np.array(y[0]).reshape(-1,1) plt.plot(x2, y2, "r.") sgd_reg2 = SGDRegressor(n_iter_no_change=5000, penalty=None, eta0=0.1, random_state=42, max_iter=100000) sgd_reg2.fit(x2, y2.ravel()) y_predict = sgd_reg2.predict(x2) plt.plot(x2, y_predict, "y-") print(y_predict)
![]()
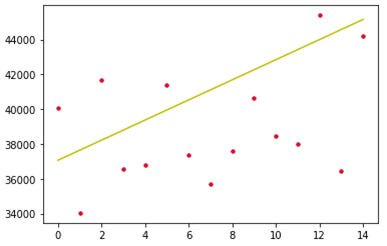
注意,一旦我把 eta0=0.1改为0.2之后,图形便失真了:
![]()
到了0.3,学习结果基本失控了:
![]()
x=[[1],[2],[3],[4],[5]] y=[[1],[2],[3],[4],[5]] x=[1,2,3,4,5] y=[1,2,3,4,5] plt.plot(x, y, "b.") sgd_reg = SGDRegressor(n_iter_no_change=5000, penalty=None, eta0=0.5, random_state=42, max_iter=100000) x_reshape = np.array(x).reshape(-1,1) y_reshape = np.array(y).reshape(-1,1) print("x_re:", x_reshape) print("y_re:", y_reshape) sgd_reg.fit(x_reshape, y_reshape) y_predict = sgd_reg.predict(x_reshape) plt.plot(x_reshape, y_predict, "y-")
这是一段代码想要说明,对于plot画图而言x,y两种形式:一种shape是(5,1),另外一种是(5,)),暂且称之为矩阵类型,一种是列表类型,两者都是可以的;但是对于学习器的fit函数而言,一定是要矩阵形式;列表形式转为矩阵类型需要使用reshape来做。
reshape这里我要多说一句,正常第一个参数代表要分割为多少个元素,第二个代表要每个元素里面有几个维度;在数组角度就是一维数组和二维数组的维度数;这里有一个特殊值-1,代表忽略指定,根据另外一个维度来自动进行计算:
arr = np.arange(6) brr = arr.reshape((2,-1)) print(brr) brr = arr.reshape((-1,3)) print(brr) brr = arr.reshape((2,3)) print(brr)
上述代码中第一段代表arr要被分为两个元素,维度据此计算;第二段代码指定每个元素维度是3,划分几个numpy.array自动算;第三段代码就比较苦逼,是程序员自己来算,其实已经没有第三段的必要了。


 y = groupall.values[:, 2:] x = range(np.shape(y)[1]) plt.plot(x, y[0], "b.") x2 = np.array(x).reshape(-1,1) y2 = np.array(y[0]).reshape(-1,1) plt.plot(x2, y2, "r.") sgd_reg2 = SGDRegressor(n_iter_no_change=5000, penalty=None, eta0=0.1, random_state=42, max_iter=100000) sgd_reg2.fit(x2, y2.ravel()) y_predict = sgd_reg2.predict(x2) plt.plot(x2, y_predict, "y-") print(y_predict)


 浙公网安备 33010602011771号