

在小程序项目中使用插件AntV(即F2)做K线含成交量图
前言:因为项目需要,要在小程序里面做一段K线含成交量图一起的图表,虽然有一些专业的行情图插件可以用,但其实感觉像是“杀鸡用牛刀”。所以还是用小巧一点的AntV-F2的来做,官方地址如下:https://f2.antv.vision/zh/examples/candlestick/basic#daily
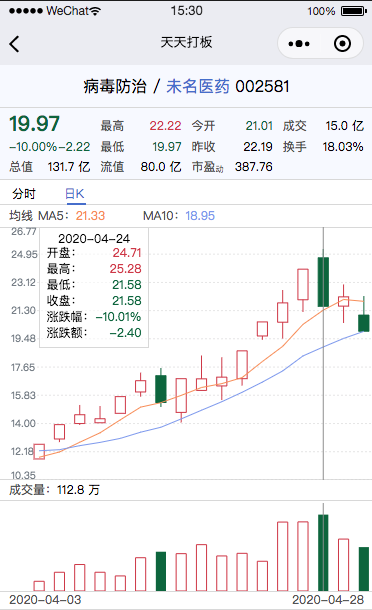
下面是根据官方文档进行更改的小程序版K线图(蜡烛图),如图,看完图就直接上代码
(附带common中的f2-canvas源:https://github.com/FreeGrowth/f2-canvas)
HTML:(这里说一下为什么用cover-view,是为了覆盖canvas可以展示在最上面)
<view class="detail-container">
  <view class="detail-chart">
    <cover-view class="tooltip-wrapper {{tooltipPosition === 'left' ?  'tooltip-wrapper-left' : 'tooltip-wrapper-right'}}" wx:if="{{showTootip}}">
      <cover-view class="tooltip-title">{{range.date}}</cover-view>
      <cover-view class="tooltip-item">
        <cover-view class="tooltio-num-type">开盘:</cover-view>
        <cover-view class="tooltio-num {{range.open > range.last_close ? 'red' : 'green'}}">{{range.open}}</cover-view>
      </cover-view>
      <cover-view class="tooltip-item">
        <cover-view class="tooltio-num-type">最高:</cover-view>
        <cover-view class="tooltio-num {{range.high > range.last_close ? 'red' : 'green'}}">{{range.high}}</cover-view>
      </cover-view>
      <cover-view class="tooltip-item">
        <cover-view class="tooltio-num-type">最低:</cover-view>
        <cover-view class="tooltio-num {{range.low > range.last_close ? 'red' : 'green'}}">{{range.low}}</cover-view>
      </cover-view>
      <cover-view class="tooltip-item">
        <cover-view class="tooltio-num-type">收盘:</cover-view>
        <cover-view class="tooltio-num {{range.close > range.last_close ? 'red' : 'green'}}">{{range.close}}</cover-view>
      </cover-view>
      <cover-view class="tooltip-item">
        <cover-view class="tooltio-num-type">涨跌幅:</cover-view>
        <cover-view class="tooltio-num {{range.change_rate > 0 ? 'red' : 'green'}}">{{range.change_rate}}%</cover-view>
      </cover-view>
      <cover-view class="tooltip-item">
        <cover-view class="tooltio-num-type">涨跌额:</cover-view>
        <cover-view class="tooltio-num {{range.change_rate > 0 ? 'red' : 'green'}}">{{range.change_amount}}</cover-view>
      </cover-view>
    </cover-view>
    <view class="chart-k-view">
      <view class="chart-ma-view">
        <view class="secondary">均线</view>
        <view class="chart-ma secondary">MA5:<text class="chart-ma-five">{{range.ma5}}</text></view>
        <view class="chart-ma secondary">MA10:<text class="chart-ma-ten">{{range.ma10}}</text></view>
      </view>
      <ff-canvas id="kChart" canvas-id="kChart" opts="{{ kOpts }}" bindtouchstart="clickCanvas" bindtouchmove="clickCanvas"></ff-canvas>
    </view>

    <view class="chart-bar-view">
      <view class="chart-bar-num secondary">成交量:<text style="color: #000000;">{{range.vol_text}}</text></view>
      <ff-canvas id="barChart" canvas-id="barChart" opts="{{ barOpts }}" bindtouchstart="clickCanvas" bindtouchmove="clickCanvas"></ff-canvas>
      <view class="chart-date">
        <view class="chart-date-view secondary">{{chartDate[0]}}</view>
        <view class="chart-date-view secondary">{{chartDate[1]}}</view>
      </view>
    </view>
  </view>
</view>
JS
import F2 from '../../common/f2-canvas/lib/f2'


Page({
  data: {
    kOpts: {}, // k线图变量
    barOpts: {}, // 柱状图变量
    range: null, // 个股相关数值
    showTootip: false, // 是否显示图表提示框
    chartDate: [], // 图表日期区间
    tooltipPosition: 'left' // 图表提示框定位
  },

  // 成交量数值转换
  switchNum(val) {
    if (val > 99999999 || val < -99999999) {
      return (val / 100000000).toFixed(1) + ' 亿'
    } else if (val > 9999 || val < -9999) {
      return (val / 10000).toFixed(2) + ' 万'
    } else {
      return val.toFixed(2)
    }
  },


  // tooltip数据处理
  switchRange(data) {
    if (data.vol) {
      data.vol_text = this.switchNum(Number(data.vol))
    }
    data.close = Number(data.close).toFixed(2)
    data.high = Number(data.high).toFixed(2)
    data.low = Number(data.low).toFixed(2)
    data.ma5 = Number(data.ma5).toFixed(2)
    data.ma10 = Number(data.ma10).toFixed(2)
    data.open = Number(data.open).toFixed(2)
    data.change_rate = Number(data.change_rate).toFixed(2)
    data.change_amount = Number(data.change_amount).toFixed(2)
    data.last_close = Number(data.last_close).toFixed(2)
    this.data.showTootip = true
    this.data.range = data
    this.setData({
      range: this.data.range,
      showTootip: this.data.showTootip
    })
  },

  // tooltip位置处理
  tooltipSite(x) {
    if (x < 200) { // 如果小于200则在右边,否则左边
      this.data.tooltipPosition = 'right'
    } else {
      this.data.tooltipPosition = 'left'
    }
    this.setData({
      tooltipPosition: this.data.tooltipPosition,
      showTootip: true
    })
  },
// 兼容部分机型的canvas手势滑动图表事件
clickCanvas (e) {
const currentPoint = {
x: e.touches[0].pageX,
y: e.touches[0].pageY
}
this.tooltipSite(e.touches[0].pageX)
this.barChart.showTooltip(currentPoint) // 显示柱状图tooltip
this.kchart.showTooltip(currentPoint) // 显示k线图tooltip
},
// 绘制K线图
  renderKChart(code) {
    const that = this
    const data = [
      {
        amount: 83533632,
        change_amount: 3.26,
        change_rate: 10.02,
        close: 35.81,
        date: "2020-02-28",
        high: 35.81,
        last_close: 32.55,
        low: 35.02,
        ma5: 33.068000030518,
        ma10: 31.979000091553,
        open: 35.81,
        turnover_rate: 4.92,
        vol: 23333.94,
      },
      {
        amount: 6625398,
        change_amount: 3.58,
        change_rate: 10,
        close: 39.39,
        date: "2020-03-02",
        high: 39.39,
        last_close: 35.81,
        low: 39.39,
        ma5: 34.465999603271,
        ma10: 32.915999984741,
        open: 39.39,
        turnover_rate: 0.35,
        vol: 1682,
      },
      {
        amount: 7135281,
        change_amount: 3.94,
        change_rate: 10,
        close: 43.33,
        date: "2020-03-03",
        high: 43.33,
        last_close: 39.39,
        low: 43.33,
        ma5: 36.612000274658,
        ma10: 34.143000221252,
        open: 43.33,
        turnover_rate: 0.35,
        vol: 1646.73,
      },
      {
        amount: 11762488,
        change_amount: 4.33,
        change_rate: 9.99,
        close: 47.66,
        date: "2020-03-04",
        high: 47.66,
        last_close: 43.33,
        low: 47.66,
        ma5: 39.748000335693,
        ma10: 35.829000282288,
        open: 47.66,
        turnover_rate: 0.52,
        vol: 2468,
      },
      {
        amount: 15330532,
        change_amount: 4.77,
        change_rate: 10.01,
        close: 52.43,
        date: "2020-03-05",
        high: 52.43,
        last_close: 47.66,
        low: 52.43,
        ma5: 43.724000549316,
        ma10: 37.952000236511,
        open: 52.43,
        turnover_rate: 0.62,
        vol: 2924,
      }
    ]
    that.data.chartDate = [data[0].date, data[data.length - 1].date]
    that.data.range = {
      ma5: Number(data[data.length - 1].ma5).toFixed(2),
      ma10: Number(data[data.length - 1].ma10).toFixed(2),
      vol_text: that.switchNum(Number(data[data.length - 1].vol))
    }
    that.setData({
      chartDate: that.data.chartDate,
      range: that.data.range
    })
    const kChartComponent = that.selectComponent('#kChart') // k线图元素
    kChartComponent.init((canvas, width, height) => { // 开始初始化图表
      let max = data[0].high
      let min = data[0].low
      data.forEach(function (obj) { // 遍历处理k线图数据获得蜡烛数据和涨跌红绿
        obj.range = [obj.open, obj.close, obj.high, obj.low] // 合集range
        obj.trend = obj.open < obj.close ? 0 : 1 // 开盘小于收盘为涨0,否则为跌1
        if (obj.open === obj.close) obj.trend = obj.change_rate > 0 ? 0 : 1 // 开盘等于收盘时,当日涨跌幅为正则为涨0,否则为跌1
        if (max < obj.high) max = obj.high // 筛选出数据中最高点用于画图结点依据
        if (min > obj.low) min = obj.low // 筛选出数据中最低点用于画起点依据
        if (min > obj.ma5) min = obj.ma5
        if (min > obj.ma10) min = obj.ma10
      })
      const chart = new F2.Chart({
        el: canvas,
        padding: [-1, 0, 0, 30],
        width,
        height
      })
      let tickArr = [] // 左侧Y坐标轴刻度集
      min = min - ((max - min) * (1 / 10)) // 按分为10个刻度来计算,减去1/10兼容最小,获得实际最小值
      max = max + ((max - min) * (1 / 10)) // 按分为10个刻度来计算,加上1/10兼容最大,获得实际最大值
      let average = (max - min) / 9 // 除去最大值占据一个刻度,用最大值与最小值的差用以做刻度平均值
      for (let i = 0; i < 9; i++) { // 循环9次计算出每个刻度递增平均值后的实际刻度值
        tickArr.push((min + i * average).toFixed(2)) // 保留两位小数
      }
      tickArr.push(max.toFixed(2)) // 最后压入最大值

      chart.source(data, {
        ma5: {
          ticks: tickArr
        },
        ma10: {
          ticks: tickArr
        },
        range: {
          ticks: tickArr
        }
      })
      chart.axis('range', {
        labelOffset: 18,
        grid: {
          top: false
        },
        label(text, index, total) {
          const cfg = {
            textAlign: 'start',
            text: parseFloat(text).toFixed(2),
            fill: '#818991'
          };
          if (index === 0) {
            cfg.textBaseline = 'bottom';
          } else if (index === (total - 1)) {
            cfg.textBaseline = 'top';
          }
          return cfg;
        }
      })
      chart.axis('date', false)
      chart.axis('ma5', false)
      chart.axis('ma10', false)
      chart.legend(false)
      chart.animate(false)
      chart.tooltip({
        alwaysShow: true,
        showCrosshairs: true,
        showTooltipMarker: false,
        crosshairsType: 'xy',
        custom: true,
        showXTip: true,
        showYTip: true,
        yTip: function yTip(val) {
          return {
            text: val.toFixed(2),
            fill: '#999999',
            fontSize: 10
          }
        },

        xTip: {
          fill: '#999999',
          fontSize: 10
        },
        xTipBackground: {
          fill: '#999999'
        },
        yTipBackground: {
          fill: '#999999'
        },
        crosshairsStyle: {
          stroke: '#999999'
        },

        onChange(obj) {
          console.log(obj)
          const currentPoint = {
            x: obj.x,
            y: obj.y
          }
          that.tooltipSite(obj.x)
          that.barChart.showTooltip(currentPoint) // 显示柱状图tooltip
          that.switchRange(obj.items[0].origin)  // 数据处理
        },
      })
      chart.schema().position('date*range')
        .color('trend', val => {
          if (val === 1) {
            return '#097045'
          } else {
            return '#d44151'
          }
        })
        .style('trend', {
          lineWidth: 1,
          fill: val => {
            if (val === 0) return '#ffffff'
          },
          stroke: val => {
            if (val === 0) return '#d44151'
          },
        })
        .shape('candle')

      chart.line().position('date*ma5').color('#F89863').size(1)
      chart.line().position('date*ma10').color('#89A3EF').size(1)
      chart.render()
      that.kchart = chart // 赋值给到this指向的kchart用于同步柱状图的tooltip显示
      that.renderBarChart(data) // 进行成交量柱状图绘制
      return chart
    })
  },

  // 绘制柱状图
  renderBarChart(data) {
    const that = this
    const barChartComponent = that.selectComponent('#barChart') // 柱状图元素
    barChartComponent.init((canvas, width, height) => {
      const chart = new F2.Chart({
        el: canvas,
        padding: [0, 0, 0, 30],
        width,
        height
      })

      chart.source(data)
      chart.axis(false)
      chart.legend(false)
      chart.animate(false)
      chart.tooltip({
        alwaysShow: true,
        showCrosshairs: true,
        showTooltipMarker: false,
        crosshairsType: 'xy',
        custom: true,
        showXTip: true,
        showYTip: true,
        yTip: function yTip(val) {
          return {
            text: val.toFixed(2),
            fill: '#999999',
            fontSize: 10
          }
        },

        xTip: {
          fill: '#999999',
          fontSize: 10
        },
        xTipBackground: {
          fill: '#999999'
        },
        yTipBackground: {
          fill: '#999999'
        },
        crosshairsStyle: {
          stroke: '#999999'
        },

        onChange(obj) {
          const currentPoint = {
            x: obj.x,
            y: obj.y
          }
          that.tooltipSite(obj.x)
          that.kchart.showTooltip(currentPoint) // 显示k线图tooltip
          that.switchRange(obj.items[0].origin) // 数据处理
        },
      })
      chart.interval().position('date*amount')
        .color('trend', val => {
          if (val === 1) {
            return '#097045'
          } else {
            return '#d44151'
          }
        })
        .style('trend', {
          lineWidth: 1,
          fill: val => {
            if (val === 0) return '#ffffff'
          },
          stroke: val => {
            if (val === 0) return '#d44151'
          },
        })
      chart.render()
      that.barChart = chart // 赋值给到this指向的barChart用于同步k线图的tooltip显示
      return chart
    })
  },


  onLoad() {
  this.renderKChart() // 进行绘制
  },
})
CSS
page {
  width: 100%;
  height: 100%;
  font-size: 25rpx;
  background-color: #f8faff;
}

ff-canvas {
  width: 100%;
}

.red {
  color: #d44151;
}

.green {
  color: #097045;
}

.secondary {
  color: #5e5e5e;
}

.top-padding {
  padding-top: 8rpx;
}

.detail-title {
  font-size: 32rpx;
  text-align: center;
  border-bottom: 1rpx solid rgb(221, 221, 221);
  padding: 20rpx 0;
}

.blue-text {
  color: #5079d1;
}

.detail-chart {
  width: 100%;
  background-color: #ffffff;
  position: relative;
}

.tooltip-wrapper {
  position: absolute;
  top: 45rpx;
  width: 220rpx;
  padding: 10rpx 15rpx;
  background-color: rgba(255, 255, 255, 0.6);
  z-index: 99;
  font-size: 25rpx;
  box-sizing: border-box;
  border: 1rpx solid rgb(221, 221, 221);
}

.tooltip-wrapper-left {
  left: 80rpx;
}

.tooltip-wrapper-right {
  right: 20rpx;
}

.tooltip-title {
  text-align: center;
}

.tooltip-item {
  display: flex;
  margin-bottom: 5rpx;
}

.tooltio-num-type {
  flex: 1;
}

.tooltio-num {
  flex: 1;
  text-align: right;
}

.chart-k-view {
  width: 100%;
  height: 550rpx;
  display: flex;
  flex-direction: column;
}

.chart-ma-view {
  flex: 0 0 44rpx;
  display: flex;
  padding: 5rpx 20rpx;
  box-sizing: border-box;
}

.chart-ma-view > view {
  margin-right: 10rpx;
}

.chart-ma {
  width: 200rpx;
}

.chart-ma-five {
  color: #F89863;
}
.chart-ma-ten {
  color: #89A3EF;
}

#kChart {
  position: relative;
  z-index: 1;
  flex: 1;
  border-top: 1rpx solid rgb(221, 221, 221);

}

#barChart {
  flex: 1;
}

.chart-bar-view {
  width: 100%;
  height: 220rpx;
  display: flex;
  flex-direction: column;
}

.chart-bar-num {
  flex: 0 0 44rpx;
  padding: 5rpx 20rpx;
  margin-bottom: 5rpx;
  box-sizing: border-box;
  border-top: 1rpx solid rgb(221, 221, 221);
  margin-top: -1.5rpx;
  border-bottom: 1rpx solid rgb(221, 221, 221);
}

.chart-date {
  flex: 0 0 38rpx;
  display: flex;
  padding: 0 20rpx;
  box-sizing: border-box;
  border-top: 1rpx solid rgb(221, 221, 221);
  border-bottom: 1rpx solid rgb(221, 221, 221);
  background-color: #ffffff;
}

.chart-date .chart-date-view {
  flex: 1;
}

.chart-date .chart-date-view:last-child {
  text-align: right;
}

 浙公网安备 33010602011771号