
服务器A :192.168.1.190 (Prometheus、alertmanager)
服务器B :192.168.1.206(Prometheus、alertmanager、influxdb、nginx)
基本HA + 远程存储
在基本HA模式的基础上通过添加Remote Storage存储支持,将监控数据保存在第三方存储服务上。
在保证Promthues服务可用性的基础上,同时确保了数据的持久化,当Promthues Server发生宕机或者数据丢失的情况下,可以快速的恢复。 同时Promthues
Server可能很好的进行迁移。因此,该方案适用于用户监控规模不大,但是希望能够将监控数据持久化,同时能够确保Promthues
Server的可迁移性的场景。

在B 上使用docker安装influxDB库
mkdir -p /data/infuxdb
vi /data/infuxdb/docker-compose-monitor.yml
version: '2'
services:
  influxdb:
    image: influxdb
    container_name: influxdb
    hostname: influxdb
    restart: always
    command: -config /etc/influxdb/influxdb.conf
    ports:
      - "8086:8086"
      - "8083:8083"
    volumes:
      - /data/influxdb/conf:/etc/influxdb
      - /data/influxdb/data:/var/lib/influxdb/data
      - /data/influxdb/meta:/var/lib/influxdb/meta
      - /data/influxdb/wal:/var/lib/influxdb/wal
vi /data/influxdb/conf/influxdb.conf
### Welcome to the InfluxDB configuration file.
# The values in this file override the default values used by the system if
# a config option is not specified. The commented out lines are the configuration
# field and the default value used. Uncommenting a line and changing the value
# will change the value used at runtime when the process is restarted.
# Once every 24 hours InfluxDB will report usage data to usage.influxdata.com
# The data includes a random ID, os, arch, version, the number of series and other
# usage data. No data from user databases is ever transmitted.
# Change this option to true to disable reporting.
# reporting-disabled = false
# Bind address to use for the RPC service for backup and restore.
# bind-address = "127.0.0.1:8088"
#
#
###############################
#InfluxDB 配置优化 version 1.6##
###############################
###
### [meta]
###
### Controls the parameters for the Raft consensus group that stores metadata
### about the InfluxDB cluster.
###
[meta]
# Where the metadata/raft database is stored
# 元数据存储目录
dir = "/var/lib/influxdb/meta"
# Automatically create a default retention policy when creating a database.
# retention-autocreate = true
# If log messages are printed for the meta service
# logging-enabled = true
###
### [data]
###
### Controls where the actual shard data for InfluxDB lives and how it is
### flushed from the WAL. "dir" may need to be changed to a suitable place
### for your system, but the WAL settings are an advanced configuration. The
### defaults should work for most systems.
###
[data]
# The directory where the TSM storage engine stores TSM files.
# 数据存储的目录
dir = "/var/lib/influxdb/data"
# The directory where the TSM storage engine stores WAL files.
# wal数据目录
wal-dir = "/var/lib/influxdb/wal"
# The amount of time that a write will wait before fsyncing. A duration
# greater than 0 can be used to batch up multiple fsync calls. This is useful for slower
# disks or when WAL write contention is seen. A value of 0s fsyncs every write to the WAL.
# Values in the range of 0-100ms are recommended for non-SSD disks.
# wal-fsync-delay = "0s"
# The type of shard index to use for new shards. The default is an in-memory index that is
# recreated at startup. A value of "tsi1" will use a disk based index that supports higher
# cardinality datasets.
# index-version = "inmem"
# Trace logging provides more verbose output around the tsm engine. Turning
# this on can provide more useful output for debugging tsm engine issues.
# trace-logging-enabled = false
# Whether queries should be logged before execution. Very useful for troubleshooting, but will
# log any sensitive data contained within a query.
# query-log-enabled = true
# Settings for the TSM engine
# CacheMaxMemorySize is the maximum size a shard's cache can
# reach before it starts rejecting writes.
# Valid size suffixes are k, m, or g (case insensitive, 1024 = 1k).
# Values without a size suffix are in bytes.
#
# 4294967296(b)=4G 最大缓存数据,先缓存再写入
cache-max-memory-size = "8g"
# CacheSnapshotMemorySize is the size at which the engine will
# snapshot the cache and write it to a TSM file, freeing up memory
# Valid size suffixes are k, m, or g (case insensitive, 1024 = 1k).
# Values without a size suffix are in bytes.
# cache-snapshot-memory-size = "25m"
# CacheSnapshotWriteColdDuration is the length of time at
# which the engine will snapshot the cache and write it to
# a new TSM file if the shard hasn't received writes or deletes
# cache-snapshot-write-cold-duration = "10m"
# CompactFullWriteColdDuration is the duration at which the engine
# will compact all TSM files in a shard if it hasn't received a
# write or delete
# compact-full-write-cold-duration = "4h"
# The maximum number of concurrent full and level compactions that can run at one time. A
# value of 0 results in 50% of runtime.GOMAXPROCS(0) used at runtime. Any number greater
# than 0 limits compactions to that value. This setting does not apply
# to cache snapshotting.
# max-concurrent-compactions = 0
# The threshold, in bytes, when an index write-ahead log file will compact
# into an index file. Lower sizes will cause log files to be compacted more
# quickly and result in lower heap usage at the expense of write throughput.
# Higher sizes will be compacted less frequently, store more series in-memory,
# and provide higher write throughput.
# Valid size suffixes are k, m, or g (case insensitive, 1024 = 1k).
# Values without a size suffix are in bytes.
# max-index-log-file-size = "1m"
# The maximum series allowed per database before writes are dropped. This limit can prevent
# high cardinality issues at the database level. This limit can be disabled by setting it to
# 0.
max-series-per-database = 0
# The maximum number of tag values per tag that are allowed before writes are dropped. This limit
# can prevent high cardinality tag values from being written to a measurement. This limit can be
# disabled by setting it to 0.
max-values-per-tag = 0
# If true, then the mmap advise value MADV_WILLNEED will be provided to the kernel with respect to
# TSM files. This setting has been found to be problematic on some kernels, and defaults to off.
# It might help users who have slow disks in some cases.
# tsm-use-madv-willneed = false
###
### [coordinator]
###
### Controls the clustering service configuration.
###
[coordinator]
# The default time a write request will wait until a "timeout" error is returned to the caller.
write-timeout = "10s"
# The maximum number of concurrent queries allowed to be executing at one time. If a query is
# executed and exceeds this limit, an error is returned to the caller. This limit can be disabled
# by setting it to 0.
#
# max-concurrent-queries项是配置最大的可执行的命令数,此项值为零则表示无限制。
# 如果你执行的命令数超过这个配置项的数量,则会报如下错误:
# ERR: max concurrent queries reached
#
max-concurrent-queries = 0
# The maximum time a query will is allowed to execute before being killed by the system. This limit
# can help prevent run away queries. Setting the value to 0 disables the limit.
#
# query-timeout项用来配置命令的超时时间,如果命令的执行时长超过了此时间,则influxDB会杀掉这条语句并报出如下错误:
# ERR: query timeout reached
# 如果配置了连续查询,那么最好不要配置query-timeout超时时间,因为随着数据量的增加,连续查询生成的数据所需要的时间更长,配置之后会导致数据生成不成功。
query-timeout = "0"
# The time threshold when a query will be logged as a slow query. This limit can be set to help
# discover slow or resource intensive queries. Setting the value to 0 disables the slow query logging.
#
# log-queries-after用来配置执行时长为多少的语句会被记录为慢查询。配置为0则表示不会记录这些语句。
# 比如,改项配置为“1s”,则执行时长超过1秒的语句会被标记为慢查询,并记录在日志里。
#
log-queries-after = "10s"
# The maximum number of points a SELECT can process. A value of 0 will make
# the maximum point count unlimited. This will only be checked every second so queries will not
# be aborted immediately when hitting the limit.
#
# 在point可控的情况下,可以设置此参数
# max-select-point配置一次可查询出的数据量,因为在influxDB中一条数据看做一个点,因此这个配置叫每次可查询的最大的点数。
# 配置为0则表示无限制,如果查询出来的数量大于此项配置,则influxDB会杀掉这条语句并报出如下错误:
# ERR: max number of points reached
#
max-select-point = 0
# The maximum number of series a SELECT can run. A value of 0 will make the maximum series
# count unlimited.
#
# max-select-series用来配置influxDB语句中最多可处理的series的数量,如果你的语句中要处理的series数量大于此配置,则influxDB不会执行这条语句并且会报出如下错误:
# ERR: max select series count exceeded: <query_series_count> series
#
max-select-series = 0
# The maxium number of group by time bucket a SELECT can create. A value of zero will max the maximum
# number of buckets unlimited.
max-select-buckets = 0
###
### [retention]
###
### Controls the enforcement of retention policies for evicting old data.
###
[retention]
# Determines whether retention policy enforcement enabled.
# enabled = true
# The interval of time when retention policy enforcement checks run.
# check-interval = "30m"
###
### [shard-precreation]
###
### Controls the precreation of shards, so they are available before data arrives.
### Only shards that, after creation, will have both a start- and end-time in the
### future, will ever be created. Shards are never precreated that would be wholly
### or partially in the past.
[shard-precreation]
# Determines whether shard pre-creation service is enabled.
# enabled = true
# The interval of time when the check to pre-create new shards runs.
# check-interval = "10m"
# The default period ahead of the endtime of a shard group that its successor
# group is created.
advance-period = "10m"
###
### Controls the system self-monitoring, statistics and diagnostics.
###
### The internal database for monitoring data is created automatically if
### if it does not already exist. The target retention within this database
### is called 'monitor' and is also created with a retention period of 7 days
### and a replication factor of 1, if it does not exist. In all cases the
### this retention policy is configured as the default for the database.
[monitor]
# Whether to record statistics internally.
# store-enabled = true
# The destination database for recorded statistics
# store-database = "_internal"
# The interval at which to record statistics
# store-interval = "10s"
###
### [http]
###
### Controls how the HTTP endpoints are configured. These are the primary
### mechanism for getting data into and out of InfluxDB.
###
[http]
# Determines whether HTTP endpoint is enabled.
# enabled = true
# The bind address used by the HTTP service.
bind-address = ":8086"
# Determines whether user authentication is enabled over HTTP/HTTPS.
#auth-enabled = true
# The default realm sent back when issuing a basic auth challenge.
# realm = "InfluxDB"
# Determines whether HTTP request logging is enabled.
# 默认为true,会生成很多http请求的数据,建议关闭,不然日志文件跟插入数据量成正比,大致1:1的关系
#
log-enabled = false
# Determines whether the HTTP write request logs should be suppressed when the log is enabled.
# suppress-write-log = false
# When HTTP request logging is enabled, this option specifies the path where
# log entries should be written. If unspecified, the default is to write to stderr, which
# intermingles HTTP logs with internal InfluxDB logging.
#
# If influxd is unable to access the specified path, it will log an error and fall back to writing
# the request log to stderr.
# access-log-path = ""
# Determines whether detailed write logging is enabled.
# write-tracing = false
# Determines whether the pprof endpoint is enabled. This endpoint is used for
# troubleshooting and monitoring.
# pprof-enabled = true
# Enables a pprof endpoint that binds to localhost:6060 immediately on startup.
# This is only needed to debug startup issues.
# debug-pprof-enabled = false
# Determines whether HTTPS is enabled.
# https-enabled = false
# The SSL certificate to use when HTTPS is enabled.
# https-certificate = "/etc/ssl/influxdb.pem"
# Use a separate private key location.
# https-private-key = ""
# The JWT auth shared secret to validate requests using JSON web tokens.
# shared-secret = ""
# The default chunk size for result sets that should be chunked.
# 查询页面显示最大记录数
#
max-row-limit = 10000
# The maximum number of HTTP connections that may be open at once. New connections that
# would exceed this limit are dropped. Setting this value to 0 disables the limit.
# max-connection-limit = 0
# Enable http service over unix domain socket
# unix-socket-enabled = false
# The path of the unix domain socket.
# bind-socket = "/var/run/influxdb.sock"
# The maximum size of a client request body, in bytes. Setting this value to 0 disables the limit.
# max-body-size = 25000000
# The maximum number of writes processed concurrently.
# Setting this to 0 disables the limit.
# max-concurrent-write-limit = 0
# The maximum number of writes queued for processing.
# Setting this to 0 disables the limit.
# max-enqueued-write-limit = 0
# The maximum duration for a write to wait in the queue to be processed.
# Setting this to 0 or setting max-concurrent-write-limit to 0 disables the limit.
# enqueued-write-timeout = 0
###
### [ifql]
###
### Configures the ifql RPC API.
###
[ifql]
# Determines whether the RPC service is enabled.
# enabled = true
# Determines whether additional logging is enabled.
# log-enabled = true
# The bind address used by the ifql RPC service.
# bind-address = ":8082"
###
### [logging]
###
### Controls how the logger emits logs to the output.
###
[logging]
# Determines which log encoder to use for logs. Available options
# are auto, logfmt, and json. auto will use a more a more user-friendly
# output format if the output terminal is a TTY, but the format is not as
# easily machine-readable. When the output is a non-TTY, auto will use
# logfmt.
# format = "auto"
# Determines which level of logs will be emitted. The available levels
# are error, warn, info, and debug. Logs that are equal to or above the
# specified level will be emitted.
# level = "info"
# Suppresses the logo output that is printed when the program is started.
# The logo is always suppressed if STDOUT is not a TTY.
# suppress-logo = false
###
### [subscriber]
###
### Controls the subscriptions, which can be used to fork a copy of all data
### received by the InfluxDB host.
###
[subscriber]
# Determines whether the subscriber service is enabled.
# enabled = true
# The default timeout for HTTP writes to subscribers.
# http-timeout = "30s"
# Allows insecure HTTPS connections to subscribers. This is useful when testing with self-
# signed certificates.
# insecure-skip-verify = false
# The path to the PEM encoded CA certs file. If the empty string, the default system certs will be used
# ca-certs = ""
# The number of writer goroutines processing the write channel.
# write-concurrency = 40
# The number of in-flight writes buffered in the write channel.
# write-buffer-size = 1000
###
### [[graphite]]
###
### Controls one or many listeners for Graphite data.
###
[[graphite]]
# Determines whether the graphite endpoint is enabled.
# enabled = false
# database = "graphite"
# retention-policy = ""
# bind-address = ":2003"
# protocol = "tcp"
# consistency-level = "one"
# These next lines control how batching works. You should have this enabled
# otherwise you could get dropped metrics or poor performance. Batching
# will buffer points in memory if you have many coming in.
# Flush if this many points get buffered
# batch-size = 5000
# number of batches that may be pending in memory
# batch-pending = 10
# Flush at least this often even if we haven't hit buffer limit
# batch-timeout = "1s"
# UDP Read buffer size, 0 means OS default. UDP listener will fail if set above OS max.
# udp-read-buffer = 0
### This string joins multiple matching 'measurement' values providing more control over the final measurement name.
# separator = "."
### Default tags that will be added to all metrics. These can be overridden at the template level
### or by tags extracted from metric
# tags = ["region=us-east", "zone=1c"]
### Each template line requires a template pattern. It can have an optional
### filter before the template and separated by spaces. It can also have optional extra
### tags following the template. Multiple tags should be separated by commas and no spaces
### similar to the line protocol format. There can be only one default template.
# templates = [
# "*.app env.service.resource.measurement",
# # Default template
# "server.*",
# ]
###
### [collectd]
###
### Controls one or many listeners for collectd data.
###
[[collectd]]
# enabled = false
# bind-address = ":25826"
# database = "collectd"
# retention-policy = ""
#
# The collectd service supports either scanning a directory for multiple types
# db files, or specifying a single db file.
# typesdb = "/usr/local/share/collectd"
#
# security-level = "none"
# auth-file = "/etc/collectd/auth_file"
# These next lines control how batching works. You should have this enabled
# otherwise you could get dropped metrics or poor performance. Batching
# will buffer points in memory if you have many coming in.
# Flush if this many points get buffered
# batch-size = 5000
# Number of batches that may be pending in memory
# batch-pending = 10
# Flush at least this often even if we haven't hit buffer limit
# batch-timeout = "10s"
# UDP Read buffer size, 0 means OS default. UDP listener will fail if set above OS max.
# read-buffer = 0
# Multi-value plugins can be handled two ways.
# "split" will parse and store the multi-value plugin data into separate measurements
# "join" will parse and store the multi-value plugin as a single multi-value measurement.
# "split" is the default behavior for backward compatability with previous versions of influxdb.
# parse-multivalue-plugin = "split"
###
### [opentsdb]
###
### Controls one or many listeners for OpenTSDB data.
###
[[opentsdb]]
# enabled = false
# bind-address = ":4242"
# database = "opentsdb"
# retention-policy = ""
# consistency-level = "one"
# tls-enabled = false
# certificate= "/etc/ssl/influxdb.pem"
# Log an error for every malformed point.
# log-point-errors = true
# These next lines control how batching works. You should have this enabled
# otherwise you could get dropped metrics or poor performance. Only points
# metrics received over the telnet protocol undergo batching.
# Flush if this many points get buffered
# batch-size = 1000
# Number of batches that may be pending in memory
# batch-pending = 5
# Flush at least this often even if we haven't hit buffer limit
# batch-timeout = "1s"
###
### [[udp]]
###
### Controls the listeners for InfluxDB line protocol data via UDP.
###
[[udp]]
# enabled = false
# bind-address = ":8089"
# database = "udp"
# retention-policy = ""
# InfluxDB precision for timestamps on received points ("" or "n", "u", "ms", "s", "m", "h")
# precision = ""
# These next lines control how batching works. You should have this enabled
# otherwise you could get dropped metrics or poor performance. Batching
# will buffer points in memory if you have many coming in.
# Flush if this many points get buffered
# batch-size = 5000
# Number of batches that may be pending in memory
# batch-pending = 10
# Will flush at least this often even if we haven't hit buffer limit
# batch-timeout = "1s"
# UDP Read buffer size, 0 means OS default. UDP listener will fail if set above OS max.
# read-buffer = 0
###
### [continuous_queries]
###
### Controls how continuous queries are run within InfluxDB.
### 连续查询
[continuous_queries]
# Determines whether the continuous query service is enabled.
# //开启连续查询
#
enabled = true
# Controls whether queries are logged when executed by the CQ service.
# //开启连续查询的日志,有助于异常发现
#
log-enabled = true
# Controls whether queries are logged to the self-monitoring data store.
# query-stats-enabled = false
# interval for how often continuous queries will be checked if they need to run
# run-interval = "1s"
###
### [tls]
###
### Global configuration settings for TLS in InfluxDB.
###
[tls]
# Determines the available set of cipher suites. See https://golang.org/pkg/crypto/tls/#pkg-constants
# for a list of available ciphers, which depends on the version of Go (use the query
# SHOW DIAGNOSTICS to see the version of Go used to build InfluxDB). If not specified, uses
# the default settings from Go's crypto/tls package.
# ciphers = [
# "TLS_ECDHE_ECDSA_WITH_CHACHA20_POLY1305",
# "TLS_ECDHE_RSA_WITH_AES_128_GCM_SHA256",
# ]
# Minimum version of the tls protocol that will be negotiated. If not specified, uses the
# default settings from Go's crypto/tls package.
# min-version = "tls1.2"
# Maximum version of the tls protocol that will be negotiated. If not specified, uses the
# default settings from Go's crypto/tls package.
# max-version = "tls1.2"
启动后创建一个名称为 prometheus 的库
docker exec -it influxdb bash
influx
create database prometheus
Prometheus集群
在A和B 上分别使用docker安装Prometheus
参照https://www.cnblogs.com/xiaoyou2018/p/14037006.html
A :http://192.168.1.190:9090
B :http://192.168.1.206.9090
在B 上安装nginx,使用nginx代理A和B
[root@kibana vhost]# cat prometheus.conf
upstream prom.midust.com{
        server 192.168.1.190:9090  max_fails=0 fail_timeout=0s weight=3;
        server 192.168.1.106:9090  max_fails=0 fail_timeout=0s weight=3;
        keepalive 300;
        }

    server {
        listen       80;
        server_name  prom.test.com;
        access_log /var/log/nginx/prom.midust.com.access.log;
        error_log  /var/log/nginx/prom.midust.com.error.log;
        # Load configuration files for the default server block.
        #include /etc/nginx/default.d/*.conf;

        location / {
             proxy_pass http://prom.test.com;
                proxy_set_header Host $host;
                proxy_set_header X-Real-IP $remote_addr;
                proxy_set_header x-forwarded-for $proxy_add_x_forwarded_for;
                proxy_redirect default;
                proxy_http_version 1.1;
                proxy_set_header Connection "";
        }

        error_page 404 /404.html;
            location = /40x.html {
        }

        error_page 500 502 503 504 /50x.html;
            location = /50x.html {
        }
    }
解析之后,
访问 http://prom.test.com
A和B 上的Prometheus 接入 influxdb
A 读和写
B只读
安装remote_storage_adapter 组件
链接:https://pan.baidu.com/s/1c0rWQhRg9QZpDb4eadkeOg
提取码:cu6n
放在 /data/prometheus目录
A和B 分别运行
nohup /data/prometheus/remote_storage_adapter --influxdb-url=http://192.168.1.206:8086 --influxdb.username=prom --influxdb.database=prometheus --influxdb.retention-policy=autogen &
A和B 上的Prometheus.yml 文件修改
A 的Prometheus.yml最后添加
remote_write:
  - url: "http://192.168.1.206:8086/api/v1/prom/write?db=prometheus&u=prom&p=xxx"

remote_read:
  - url: "http://192.168.1.206:8086/api/v1/prom/read?db=prometheus&u=prom&p=xxx"
B 的Prometheus.yml最后添加
remote_read:
  - url: "http://192.168.1.206:8086/api/v1/prom/read?db=prometheus&u=prom&p=TTdjy911.500"
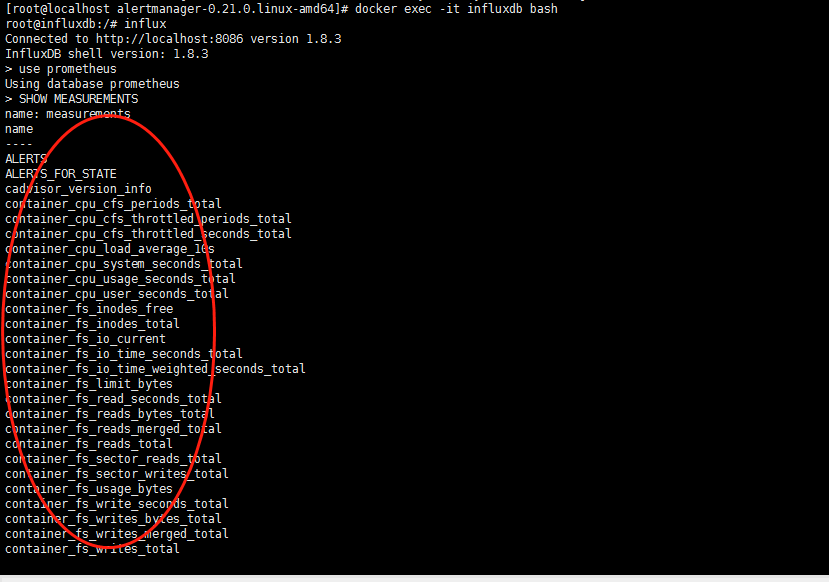
稍等一会查看influxdb是否有数据
[root@localhost alertmanager-0.21.0.linux-amd64]# docker exec -it influxdb bash
root@influxdb:/# influx
Connected to http://localhost:8086 version 1.8.3
InfluxDB shell version: 1.8.3
> use prometheus
Using database prometheus
> SHOW MEASUREMENTS
显示如下说明成功
管理influxDB 工具“InfluxDBStudio”
链接:https://pan.baidu.com/s/1c0rWQhRg9QZpDb4eadkeOg
提取码:cu6n
influxDB 设置保留数据期限:
Using database prometheus
> show retention policies
name duration shardGroupDuration replicaN default
---- -------- ------------------ -------- -------
autogen 2160h0m0s 168h0m0s 1 true
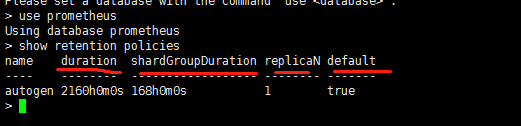
retention policy描述了influxdb中的数据会保留多长时间、数据保留几个副本(开源版的只能保留一个副本),以及每个shard保存多长时间的数据。每个influxdb数据库都有一个独立的retention policy。这里面涉及到几个基本概念,下面描述一下。
DURATION:这个描述了保留策略要保留多久的数据。这个机制对于时序型的数据来讲,是非常有用的。 (2160h表示90天)
SHARD:这个是实际存储influxdb数据的单元。每个shard保留一个时间片的数据,默认是7天。如果你保存1年的数据,那么influxdb会把连续7天的数据放到一个shard中,使用好多个shard来保存数据。
shard duration这个描述了每个shard存放多数据的时间片是多大。默认7天。需要注意的是,当数据超出了保留策略后,influxdb并不是按照数据点的时间一点一点删除的,而是会删除整个shard group。
SHARD GROUP:顾名思义,这个一个shard group包含多个shard。对于开源版的influxdb,这个其实没有什么区别,可以简单理解为一个shard group只包含一个shard,但对于企业版的多节点集群模式来讲,一个shard group可以包含不同节点上的不同shard,这使得influxdb可以保存更多的数据。
SHARD REPLICATION:这个描述了每个shard有几个副本。对于开源版来讲,只支持单副本,对于企业版来讲,每个shard可以冗余存储,这样可以避免单点故障。
默认数据一直保留
如果想修改retention policy的数据保留时间,可以使用alter retention policy语句
alter retention policy autogen on prometheus duration 30d REPLICATION 1 SHARD DURATION 7d default
alertmanager集群
Alertmanager引入了Gossip机制。Gossip机制为多个Alertmanager之间提供了信息传递的机制。确保及时在多个Alertmanager分别接收到相同告警信息的情况下,也只有一个告警通知被发送给Receiver。
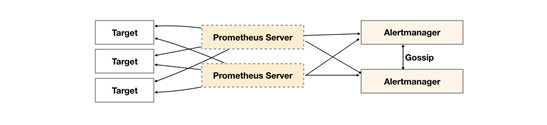
Gossip协议
Gossip是分布式系统中被广泛使用的协议,用于实现分布式节点之间的信息交换和状态同步。Gossip协议同步状态类似于流言或者病毒的传播,如下所示:

Gossip分布式协议
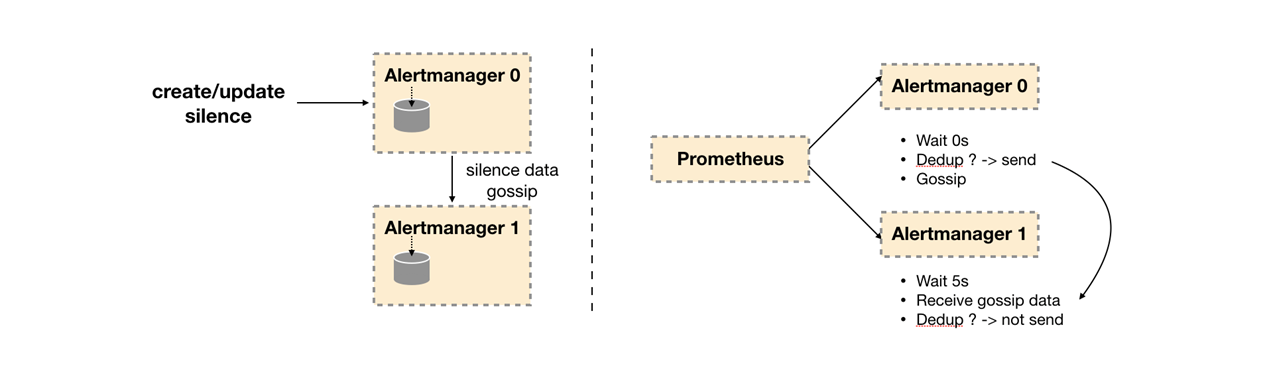
一般来说Gossip有两种实现方式分别为Push-based和Pull-based。在Push-based当集群中某一节点A完成一个工作后,随机的从其它节点B并向其发送相应的消息,节点B接收到消息后在重复完成相同的工作,直到传播到集群中的所有节点。而Pull-based的实现中节点A会随机的向节点B发起询问是否有新的状态需要同步,如果有则返回。在简单了解了Gossip协议之后,我们来看Alertmanager是如何基于Gossip协议实现集群高可用的。如下所示,当Alertmanager接收到来自Prometheus的告警消息后,会按照以下流程对告警进行处理:

通知流水线
- 在第一个阶段Silence中,Alertmanager会判断当前通知是否匹配到任何的静默规则,如果没有则进入下一个阶段,否则则中断流水线不发送通知
- 在第二个阶段Wait中,Alertmanager会根据当前Alertmanager在集群中所在的顺序(index)等待index * 5s的时间。
- 当前Alertmanager等待阶段结束后,Dedup阶段则会判断当前Alertmanager数据库中该通知是否已经发送,如果已经发送则中断流水线,不发送告警,否则则进入下一阶段Send对外发送告警通知。
- 告警发送完成后该Alertmanager进入最后一个阶段Gossip,Gossip会通知其他Alertmanager实例当前告警已经发送。其他实例接收到Gossip消息后,则会在自己的数据库中保存该通知已发送的记录。
因此如下所示,Gossip机制的关键在于两点:
Gossip机制
- Silence设置同步:Alertmanager启动阶段基于Pull-based从集群其它节点同步Silence状态,当有新的Silence产生时使用Push-based方式在集群中传播Gossip信息。
- 通知发送状态同步:告警通知发送完成后,基于Push-based同步告警发送状态。Wait阶段可以确保集群状态一致。
Alertmanager基于Gossip实现的集群机制虽然不能保证所有实例上的数据时刻保持一致,但是实现了CAP理论中的AP系统,即可用性和分区容错性。同时对于Prometheus Server而言保持了配置了简单性,Promthues Server之间不需要任何的状态同步。
下载alertmanager 组件,放在
https://github.com/prometheus/alertmanager/releases/download/v0.21.0/alertmanager-0.21.0.linux-amd64.tar.gz
A和B 都安装
tar zxvf alertmanager-0.21.0.linux-amd64.tar.gz -C /data/alertmanager/
服务器A
vi /etc/systemd/system/alertmanager.service
[Unit]
Description=Alertmanager
After=network-online.target
[Service]
Restart=on-failure
ExecStart=/data/alertmanager/alertmanager-0.21.0.linux-amd64/alertmanager --web.listen-address=":9093" --cluster.listen-address="192.168.1.190:9094" --cluster.peer=192.168.1.206:9094 --config.file=/data/alertmanager/alertmanager-0.21.0.linux-amd64/alertmanager.yml
[Install]
WantedBy=multi-user.target
启动alertmanager
systemctl daemon-reload
systemctl start alertmanager
systemctl status alertmanager
如果启动报错就直接运行
nohup /data/alertmanager/alertmanager-0.21.0.linux-amd64/alertmanager --web.listen-address=":9093" --cluster.listen-address="192.168.1.190:9094" --cluster.peer=192.168.1.206:9094 --config.file=/data/alertmanager/alertmanager-0.21.0.linux-amd64/alertmanager.yml &
服务器B
vi /etc/systemd/system/alertmanager.service
[Unit]
Description=Alertmanager
After=network-online.target

[Service]
Restart=on-failure
ExecStart=/data/alertmanager/alertmanager-0.21.0.linux-amd64/alertmanager --web.listen-address=":9093" --cluster.listen-address="192.168.1.206:9094"  --cluster.peer=192.168.1.190:9094  --config.file=/data/alertmanager/alertmanager-0.21.0.linux-amd64/alertmanager.yml

[Install]
WantedBy=multi-user.target
启动报错运行
nohup /data/alertmanager/alertmanager-0.21.0.linux-amd64/alertmanager --web.listen-address=":9093" --cluster.listen-address="192.168.1.206:9094" --cluster.peer=192.168.1.190:9094 --config.file=/data/alertmanager/alertmanager-0.21.0.linux-amd64/alertmanager.yml &
修改Prometheus.yml文件的Alertmanager configuration
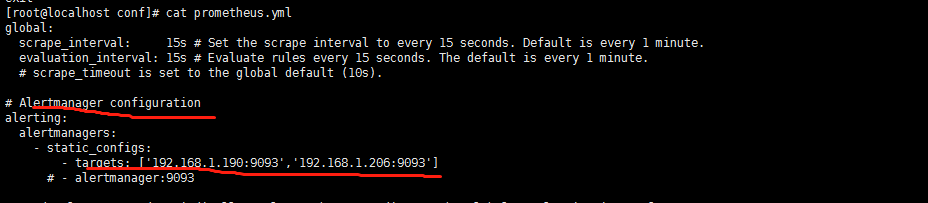
验证:
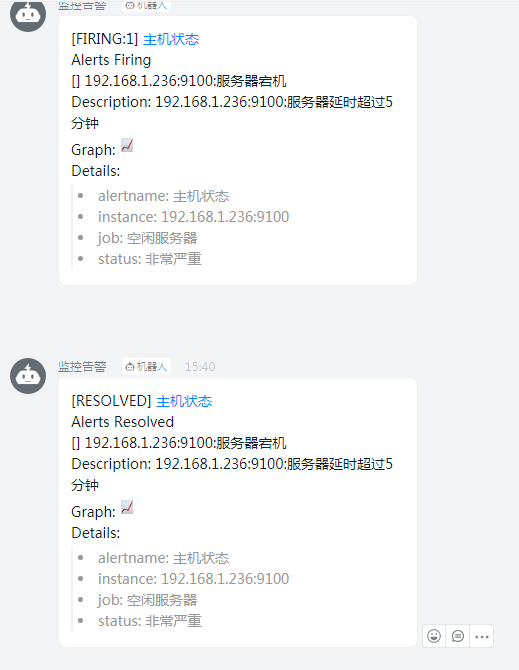
关闭一台服务器的node_exporter
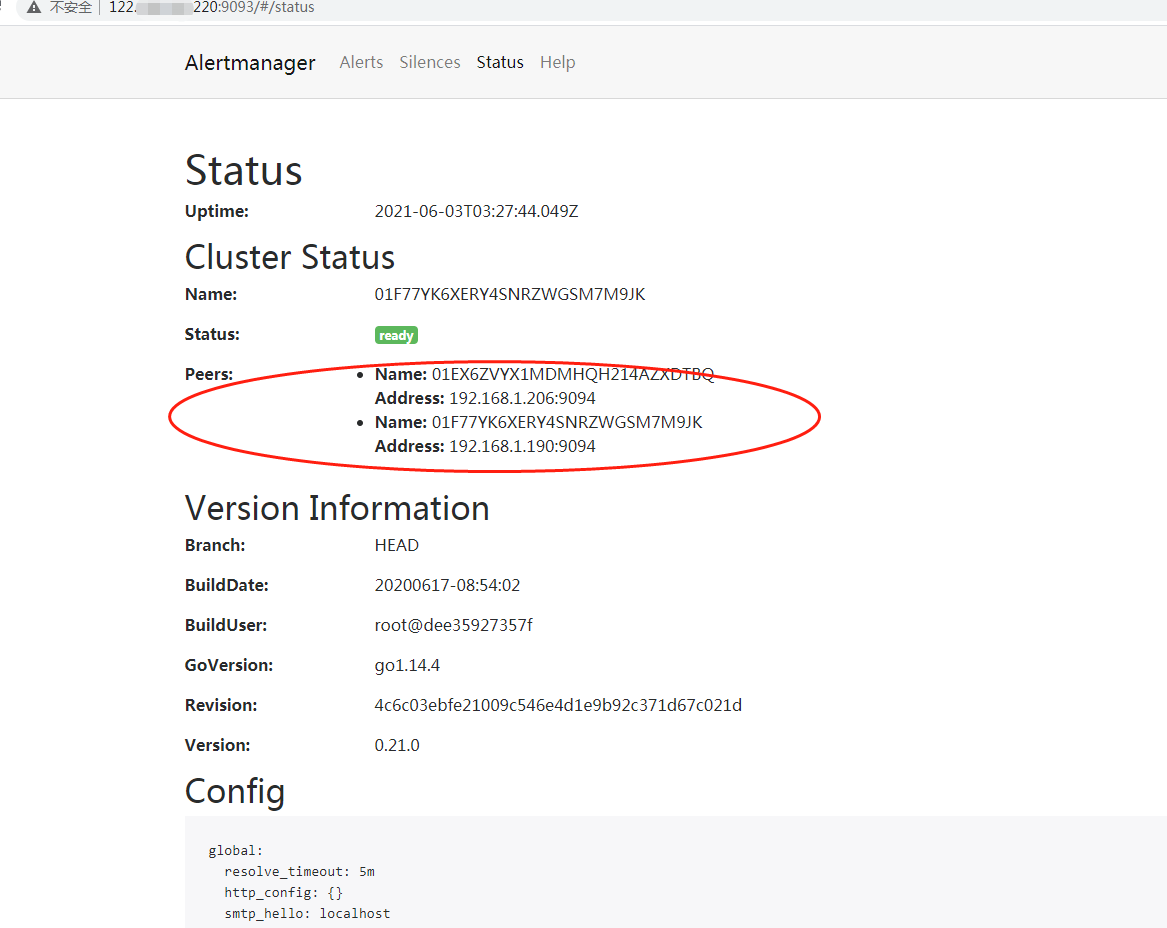
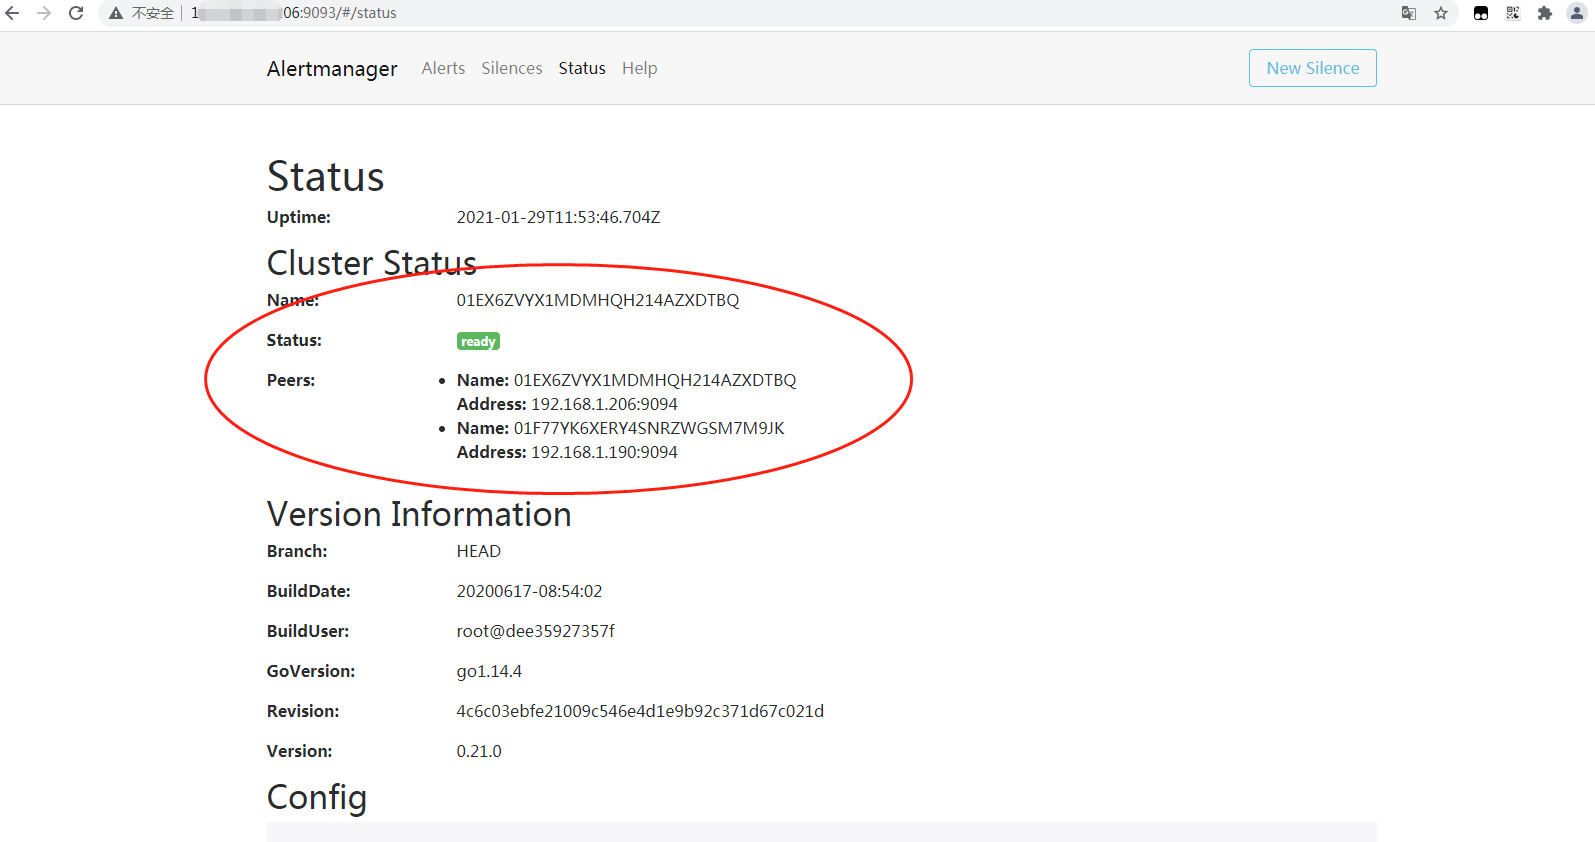
登录 http://192.168.1.190:9093 和 http://192.168.1.206:9093
都能看到接收到的告警信息,但是钉钉只接收到一条告警

 浙公网安备 33010602011771号